.... QQQ and Facebook hit with Dark Clouds
.... Alphabet and Amazon Form Engulfing Patterns
.... AMAT Forms Bearish Pennant
.... A Feeble Bounce for Apple
.... Etrade and Schwab Stall after Breakouts
.... Citigroup Leads, but JP Morgan Shows Short-term Strength
.... Cypress Forms Engulfing within Correction ....
There were quite a few bearish candlestick patterns on Monday. Before considering these as bearish omens, keep in mind that the bigger trend is up for the broader market and this remains the dominant force at work. Pullbacks and corrections are certainly possible, and even healthy, but timing a correction is difficult. Timing is always a challenge, but I prefer timing the end of the correction rather than the beginning. Having clarified that stance, note that the big tech names were hit hard the second week of June and these same names formed bearish candlestick reversals on Monday. First up, QQQ and Facebook formed dark cloud patterns. These patterns form when the open is above the prior close and the close is below the mid point of the prior hollow candlestick.
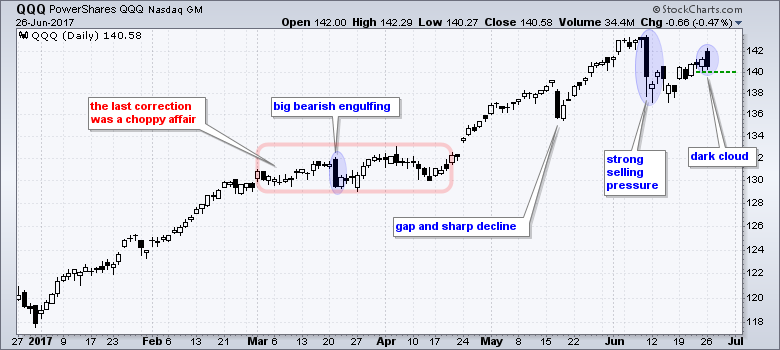
The chart above shows QQQ with a dark cloud and first support at 140. A break here could signal a continuation of the decline earlier this month with a downside target in the 134-136 area. Personally, I am not interested in short positions when the bigger trend is up. The odds are simply stacked against the downside. In addition, note that corrections can be choppy affairs, such as the trading range from early March to mid April. I would, however, consider using a break below 140 to lighten up on short-term longs. Keep in mind that the choice is yours, and yours only.
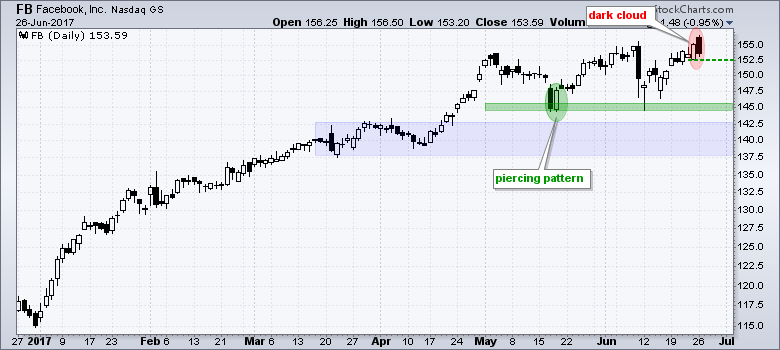
The next chart shows Facebook with a dark cloud on Monday. The pattern is valid, but keep in mind that FB hit a 52-week high on Monday and the bigger trend is up. Short-term bearish patterns at 52-week highs do not make much sense to me because it is a top picking exercise. Nevertheless, a close below 152.5 would reverse the short-term upswing and argue for a pullback of some sort. The May-June lows mark first support and the blue zone marks a major support area to watch.
Alphabet and Amazon Form Engulfing Patterns
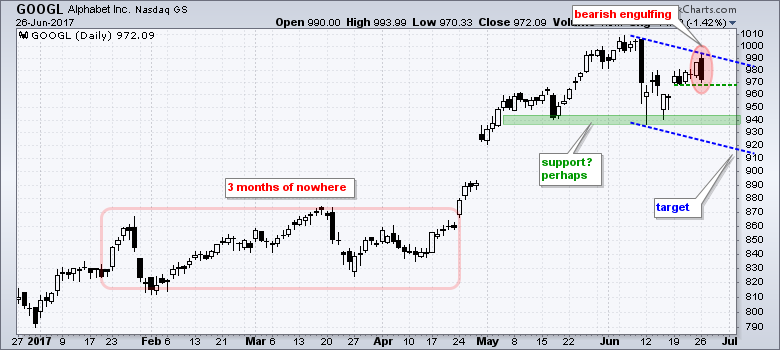
The next chart shows Alphabet (GOOGL) with a bearish engulfing, which forms when the open is above the prior close and the close is below the prior open. This candlestick is also a key outside reversal day because the open was above the prior high and the close was below the prior low. A close below the support line would argue for a pullback that could extend to the 910-920 area.
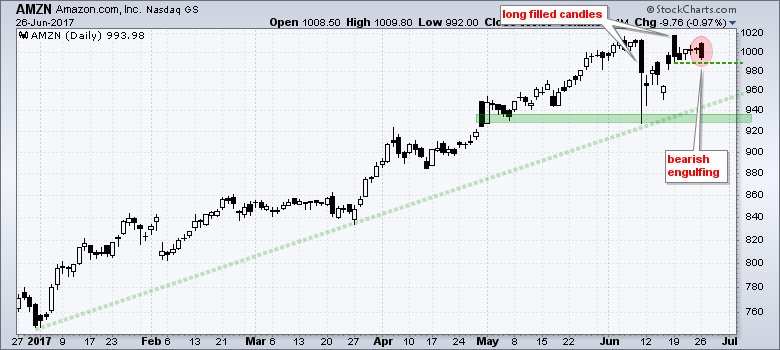
Amazon (AMZN) also formed a bearish engulfing near its 52-week highs. There are signs of selling pressure in the 1000-1020 area from the three long filled candlesticks (black) this month, including Monday's engulfing. A filled candlestick forms when the close is below the open. The longer the filled candlestick, the further the price decline after the open. A break below short-term support would argue for a pullback within the bigger uptrend.
AMAT Forms Bearish Pennant
Applied Materials (AMAT) was hit hard on June 9th with a long filled candlestick and sharp decline. The stock did not really bounce after this decline and instead consolidated with a pennant. A consolidation after a sharp decline is typically a bearish continuation pattern and a break below 43 would argue for further weakness. It may seem that a bearish engulfing formed on Monday. While Monday's candlestick did indeed engulf the prior candlestick, the short-term trend was not up and there is no short-term uptrend to reverse. A bearish engulfing is a short-term reversal pattern that requires some sort of short-term uptrend or bounce that is must actually reverse. This is something I learned from Greg Morris - many moons ago. Elsewhere, note that LRCX broke a small wedge line and KLAC hit a five-week low.

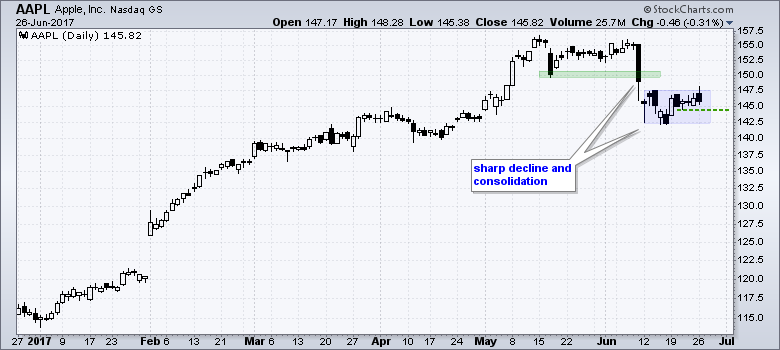
A Feeble Bounce for Apple
I am not one to bet against Apple (AAPL), especially with a house full of iPads, iPhones and Macs. However, the stock did not bounce much after the June 9th decline. The long-term trend is clearly up, but we could see more correction as a flat flag forms the last two weeks. As with AMAT above, this is basically a consolidation after a sharp decline. A break below last week's low would signal the start of a downturn that could lead to a flag break.
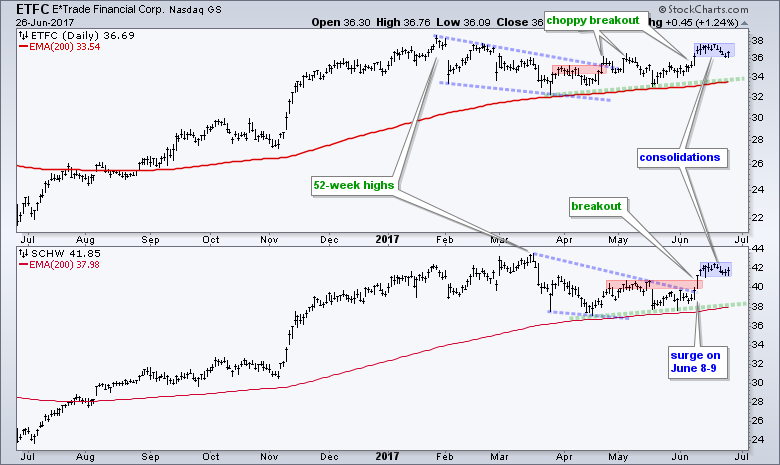
Etrade and Schwab Stall after Breakouts
I am putting E*Trade Financial (ETFC) and Charles Schwab (SCHW) together because they are both stock brokers and highly correlated. Both hit 52-week highs earlier this year, corrected into the spring and broke out of their correction patterns (wedges). More recently, both surged on June 8-9 and then stalled over the last two weeks. These stalls look like consolidations within an uptrend and upside breakouts would signal a continuation higher.
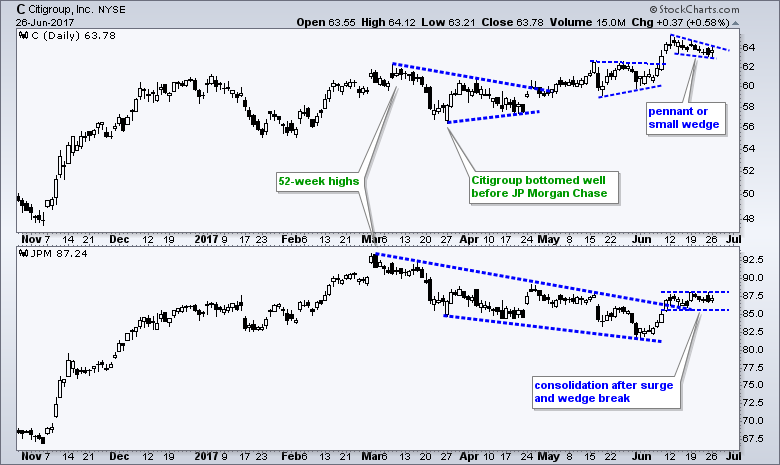
Citigroup Leads Long-term, but JP Morgan Shows Short-term Strength
Citigroup (C) is one of the strongest banks right now with a 52-week high earlier this month. JP MorganChase (JPM) is making a bid to end its correction with a break above the wedge line. Most recently, both consolidated after sharp advances from June 6th to June 9th. C is tracing out a falling wedge, while JPM is forming a flat flag. Note that JPM held up better the last two weeks because it was flat while Citigroup fell back. This means JPM could be the one to lead should we see a breakout in the banks.
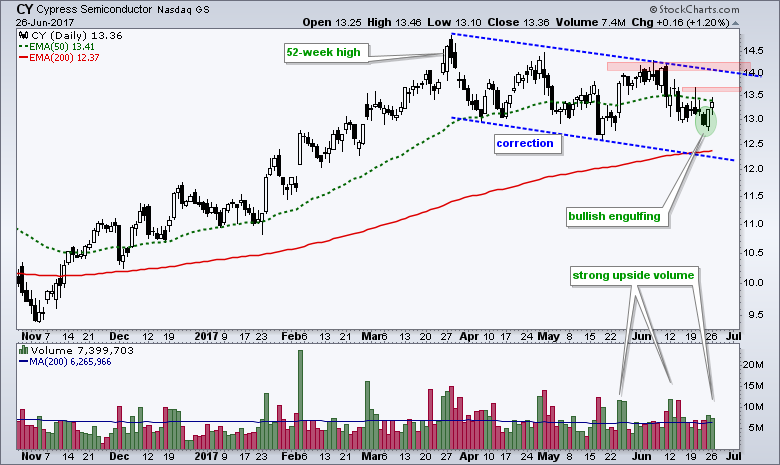
Cypress Forms Engulfing within Correction
Cypress Semi is still intriguing because the stock hit a 52-week high in March, corrected into May and formed a bullish engulfing on Friday. Also notice that upside volume has been outpacing downside volume for the most part. A break above 13.7 would provide the first sign of strength. A close above 14.3 would break channel resistance and signal a continuation of the bigger uptrend.
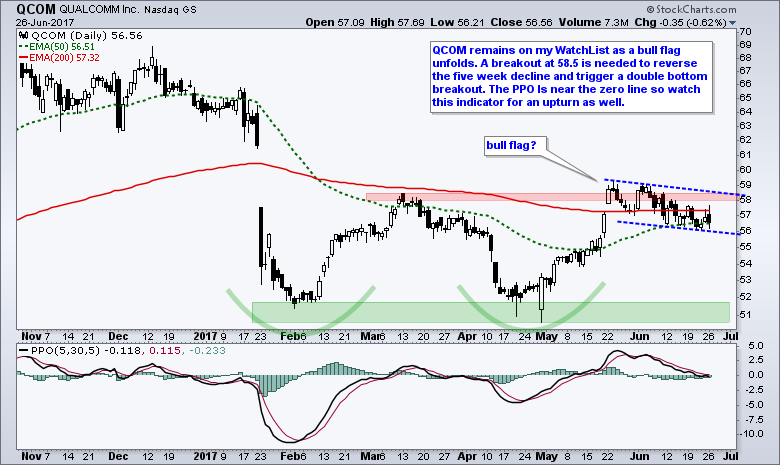
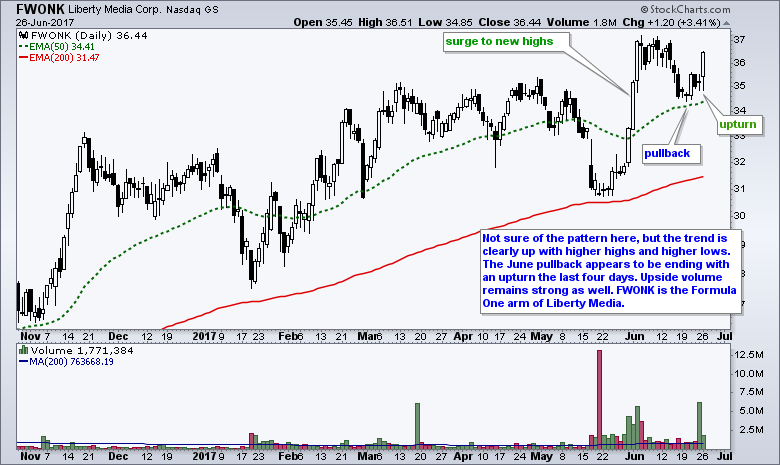
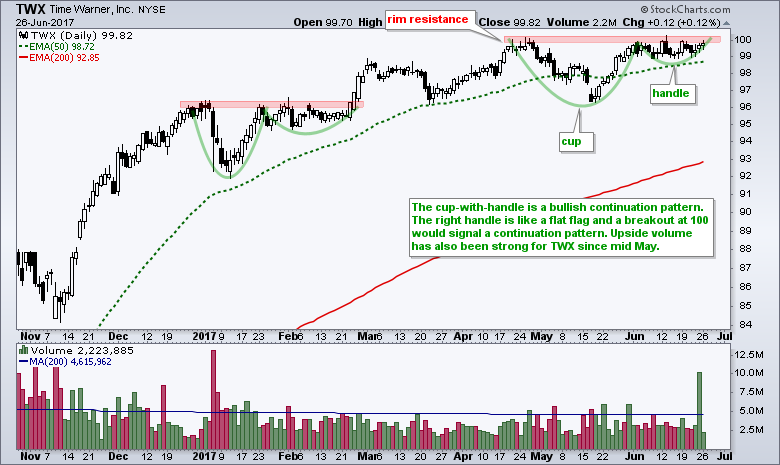
Three more for the Road: QCOM, FWONK, TWX
******************************************************
ETF Master ChartPack - 300+ ETFs organized in a Master ChartList and in individual groups.
Follow me on Twitter @arthurhill - Keep up with my 140 character commentaries.
****************************************
Thanks for tuning in and have a good day!
--Arthur Hill CMT
Plan your Trade and Trade your Plan
*****************************************


