 |
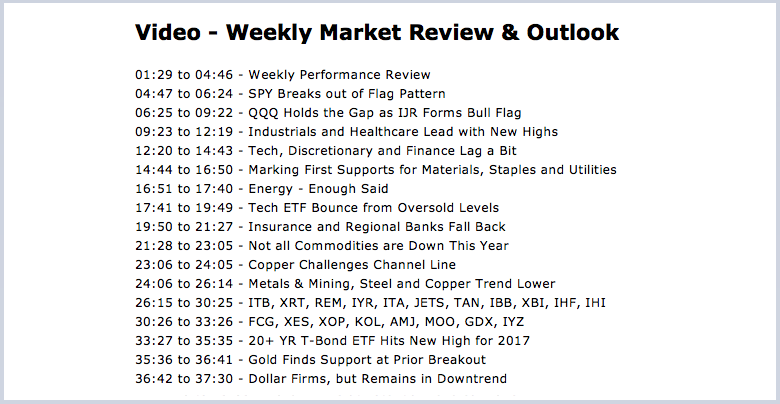
.... SPY Breaks out of Flag Pattern .... QQQ Holds the Gap as IJR Forms Bull Flag .... Industrials and Healthcare Lead with New Highs .... Tech, Discretionary and Finance Lag a Bit .... First Supports for Materials, Staples and Utilities .... Energy - Enough Said .... Tech ETF Bounce from Oversold Levels .... Insurance and Regional Banks Fall Back .... Not all Commodities are Down This Year .... Copper Challenges Channel Line .... Metals & Mining, Steel and Copper Trend Lower .... How Smart is the Bond Market? .... 20+ YR T-Bond ETF Hits New High for 2017 .... Gold Finds Support at Prior Breakout .... Dollar Firms, but Remains in Downtrend |
----- Art's Charts ChartList (updated 23-June) -----
Weekly Market Review & Outlook
There were more new highs again this week, but we are seeing some thinning in the ranks. The S&P 500 SPDR (SPY) and EW S&P 500 ETF (RSP) hit new highs and this is enough to stay bullish on the broader market. These new highs, however, were not confirmed by the Nasdaq 100 ETF (QQQ) and S&P SmallCap iShares (IJR). It looks like large-caps, as in the S&P 500, are leading right now. Large-cap techs, while still strong overall, are not leading. This is not a big deal yet, but it shows a changing of the guard. Healthcare has taken over with new highs in the Biotech iShares (IBB), HealthCare Providers ETF (IHF) and Medical Devices ETF (IHI).
SPY Breaks out of Flag Pattern
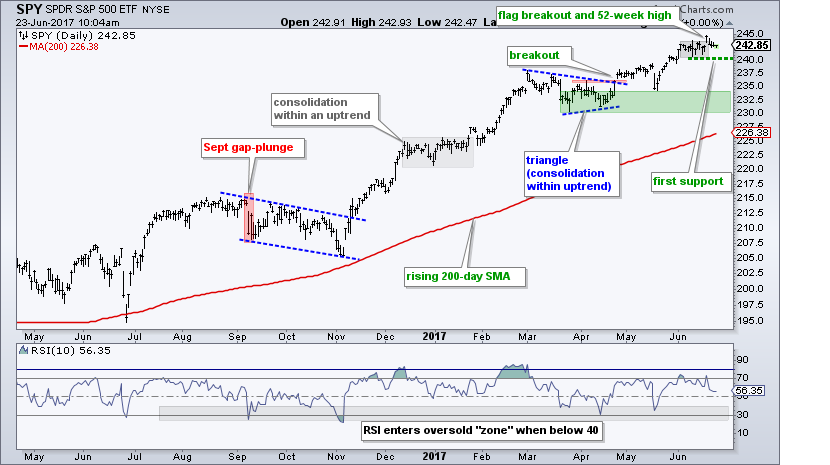
The S&P 500 SPDR (SPY) remains in a long-term uptrend with a fresh 52-week high on Monday. The ETF consolidated with a flat flag the prior two weeks and broke out with Monday's surge. This is a very short-term pattern with support marked at 240. A close below this level would be negative and argue for a pullback within the bigger uptrend. I am adjusting my main support zone to the 230-233 area, which is marked by the March-May lows.
QQQ Holds the Gap
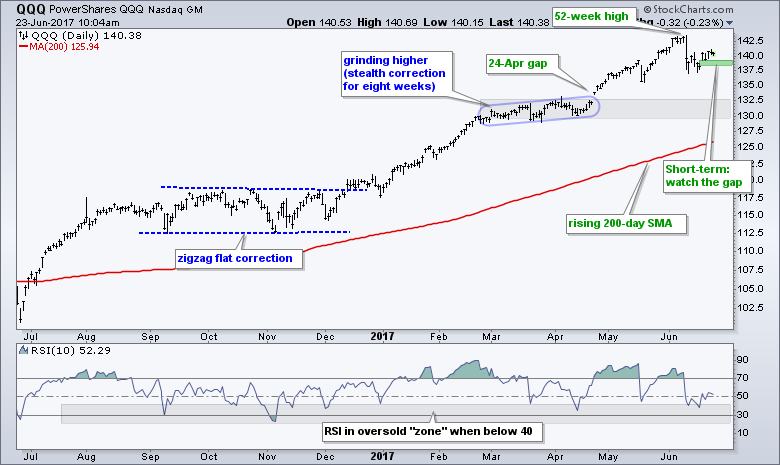
QQQ is still lagging because it did not hit a 52-week high this week. Nevertheless, the ETF came to life on Monday with a gap and this gap is holding, which is short-term bullish. While I hate to get too short-term oriented for this weekly commentary, I will be watching the gap because a close below 138 would fill it. Such a move would be short-term negative and suggest that the second shoe is dropping. This would not affect the long-term uptrend, but it could signal the start of a corrective period during the dog days of summer.
IJR Forms Bull Flag
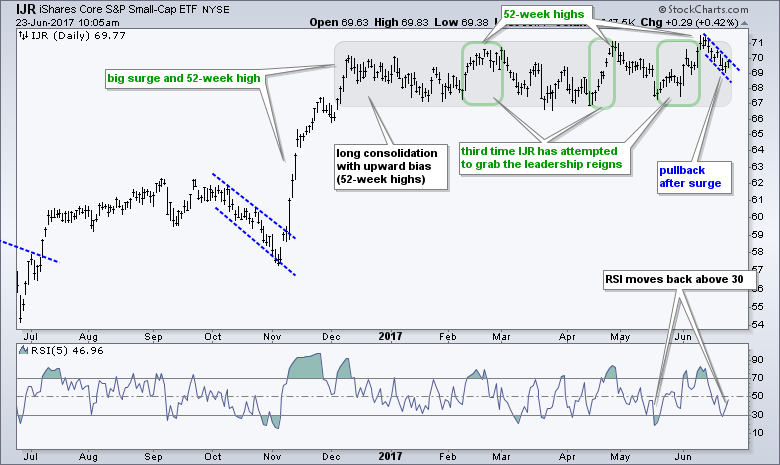
The S&P SmallCap iShares (IJR) remains in a long-term uptrend with 52-week highs in February, April and June. The ETF led the market from mid May to early June, and then fell back over the last two weeks. This could be a falling flag, which is a bullish continuation pattern. Look for a break above 70 to reverse this flag and open the door to more new highs. Chartists interested in the RSI(5) mean-reversion system should note that RSI moved back above 30 on Thursday.
Industrials and Healthcare Lead with New Highs
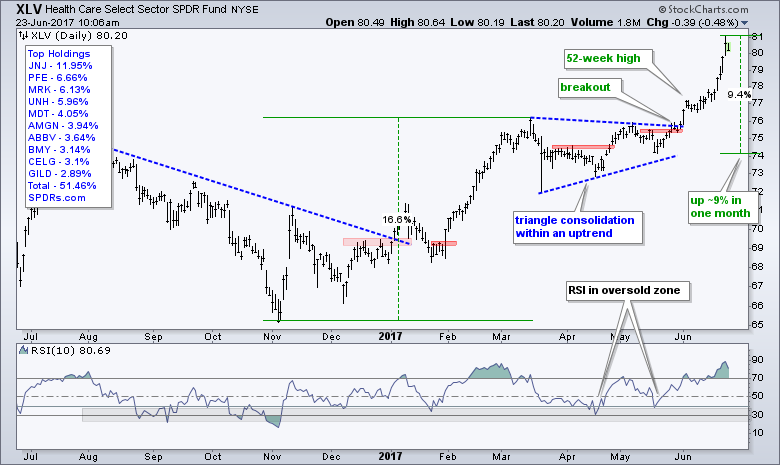
SPY and the EW S&P 500 ETF (RSP) hit 52-week highs on Monday, but only two sector SPDRs hit new highs (XLI and XLV). Among the equal-weight sectors, the EW Finance ETF (RYF), EW Healthcare ETF (RYH) and EW Industrials ETF (RGI) hit new highs on Monday. Note that the EW Utilities ETF (RYU) hit a new high last Friday. The non-confirmations are short-term issues for now, but I will be watching them going forward. The HealthCare SPDR (XLV) is obviously the current leader with a 9% gain over the past month and a 52-week high. As Greg Morris would say, this is just observable information, not actionable information. The actionable information came with the breakouts in April and May, as well as the RSI oversold conditions in April and May. The same is true with IBB and XBI, broke out on Monday and led the market this week.
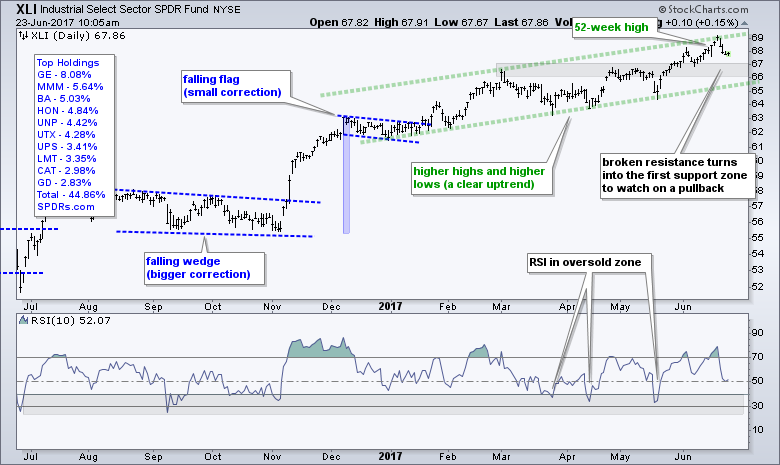
The Industrials SPDR (XLI) sports a rising channel to define the rate-of-ascent since December (hint: the slope of the trend lines reflects the rate-of-ascent). The broken resistance zone around 66-67 turns into the first support zone to watch on a pullback.
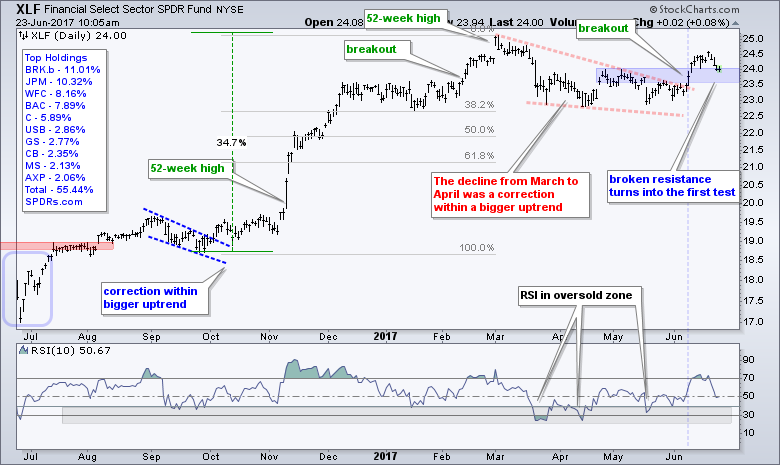
Tech, Discretionary and Finance Lag a Bit
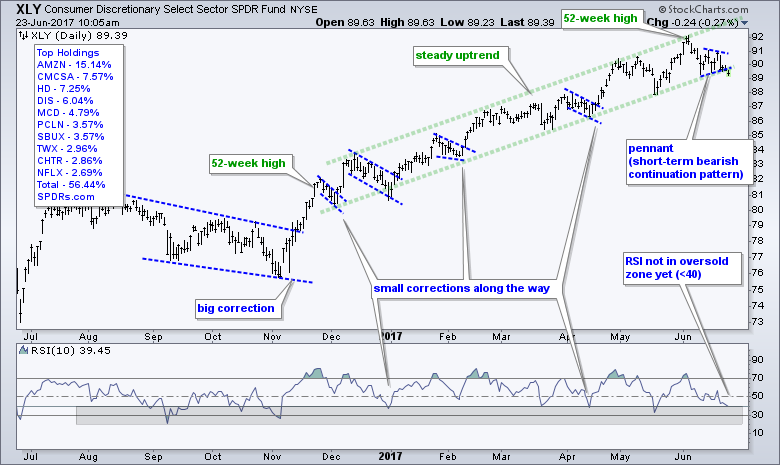
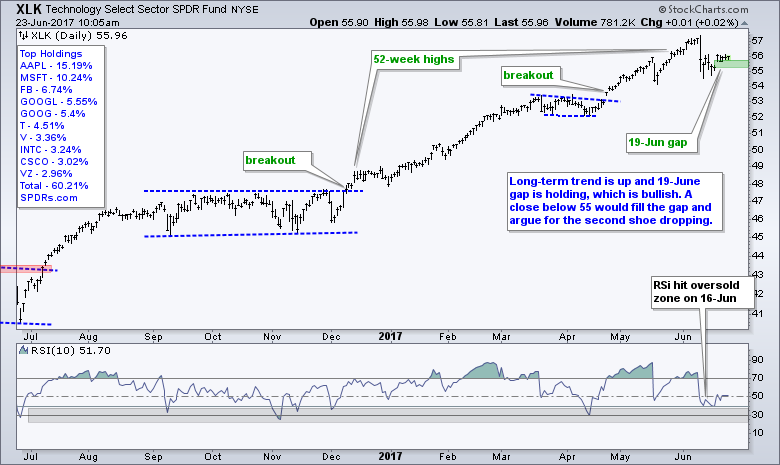
The Technology SPDR (XLK), Consumer Discretionary SPDR (XLY) and Finance SPDR (XLF) did not hit new highs this week. Even though XLK and XLY remain in long-term uptrends, they are showing some short-term weakness and should be watched for a correction. XLY formed a pennant over the last two weeks and a break below pennant support would argue for further weakness. This would not be a long-term issue though. Instead, it would suggest that a corrective period is unfolding. XLK gapped up on 19-June for a short-term bullish reversal. A close below 55 would fill this gap, reverse the short-term uptrend and argue for a correction.
XLF broke out with a big move that started on June 8th (vertical line) and it is important that this move holds. The breakout zone around 23.5-24 turns into the first support zone. A close below 23.5 would negate this breakout and suggest a failure.
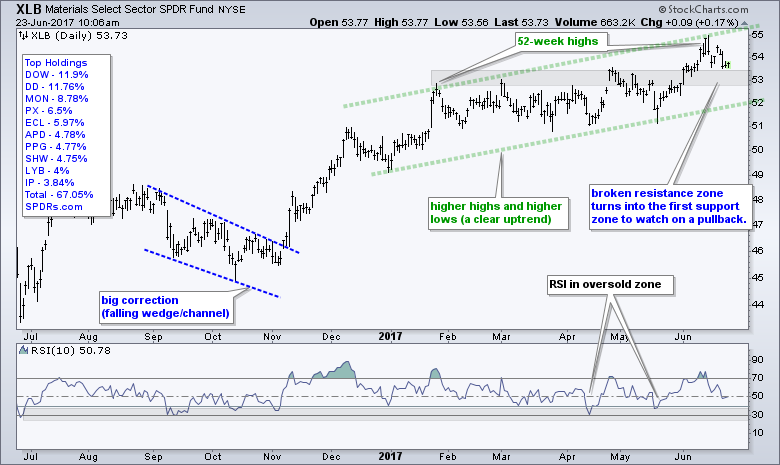
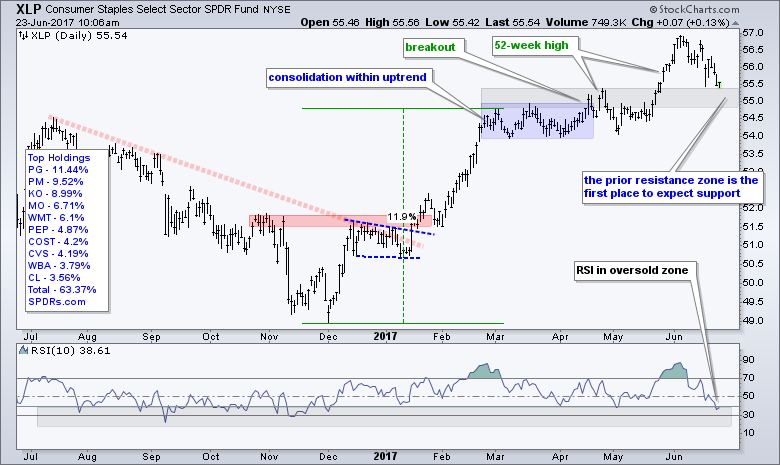
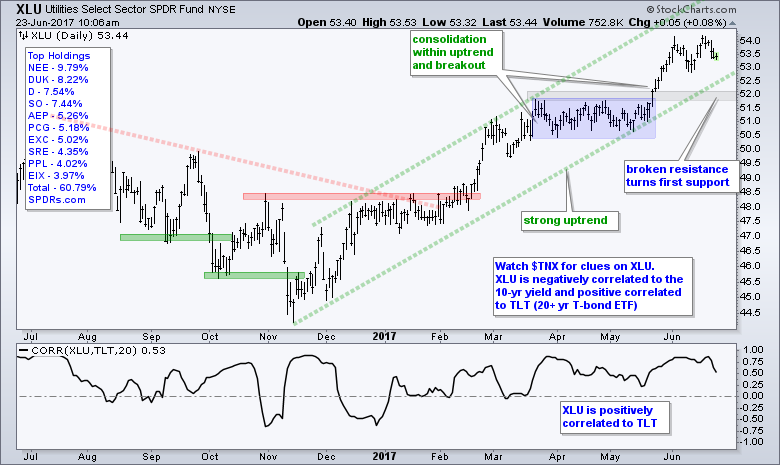
Marking First Supports for Materials, Staples and Utilities
It is reasonable to expect a pullback after a sharp advance. When the big trend is up, I treat pullbacks as opportunities and look for potential reversal zones. In addition, I look for RSI(10) to enter is oversold zone between 40 and 20. The next three charts are on pullback watch. The Materials SPDR (XLB) surged to a new high with a sharp advance from mid May to mid June and then fell back the last seven days. The breakout zone around 53 turns into the first support zone to watch on a pullback.
The Consumer Staples SPDR (XLP) surged in May and then fell back the last three weeks. The resistance zone around 55 turns into the first support zone to watch. Notice that RSI(10) moved into the oversold zone (below 40).
The Utilities SPDR (XLU) surged along with the 20+ YR T-Bond ETF (TLT) from mid May to early June. The green lines mark the rate-of-ascent for the current uptrend. The broken resistance zone around 52 marks the first support area to watch on a pullback.
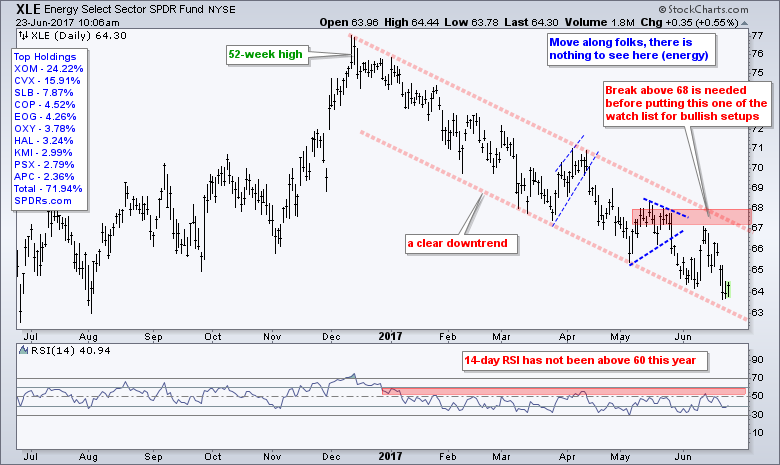
Energy - Enough Said
The Energy SPDR (XLE) fell sharply again this week and hit a new low for the move. There is no sense bottom picking in the energy sector because the Oil & Gas Equip & Services SPDR (XES) and September Crude (^CLU17) hit new lows this week as well. This entire sector remains off my radar for now. I am waiting for some sort of based to evolve or a convincing breakout. Until this happens, I will not consider long positions and simply ignore the entire sector. This goes for retail as well.
Tech ETF Bounce from Oversold Levels
The five technology ETFs all bounced after becoming oversold in mid June. As with XLK and QQQ, I am watching the current bounce and the gap on June 19th. XLK, the Internet ETF (FDN) and the Networking iShares (IGN) formed small rising wedges that define the short-term uptrend. The green zones to the far right mark first support. Closes below these support zones would reverse the short-term upswings and argue for another drop (deeper correction). Elsewhere, I used the gap zone to mark first support for the Software iShares (IGV) and Cloud Computing ETF (SKYY). I used week's low to mark first support for the Semiconductor SPDR (XSD) and Cyber Security ETF (HACK). Support breaks by 3 or more would be bearish for the technology sector as a whole.

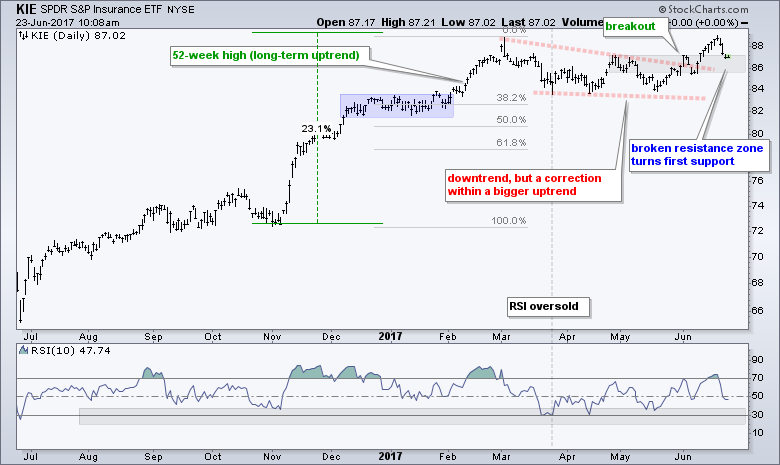
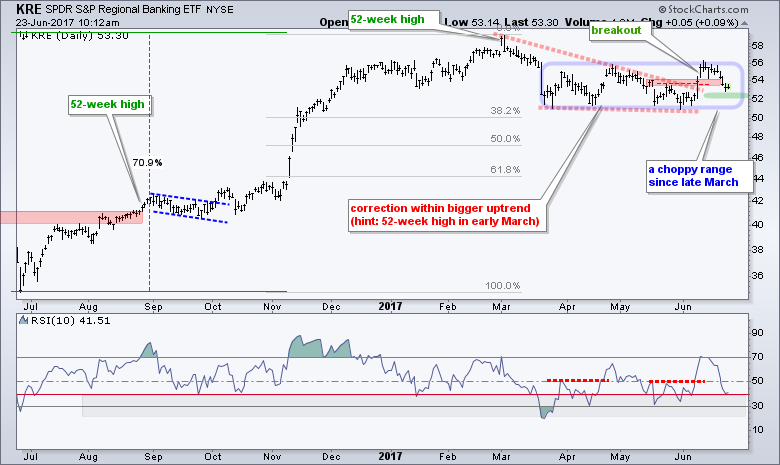
Insurance and Regional Banks Fall Back
The Insurance SPDR (KIE) broke out with a nice move from mid May to mid June, and then fell back the last three days. The decline was a little steeper than I expected, but KIE is entering its first support zone, which is marked by the breakout zone and prior resistance. This 86 area is the first zone to watch for support.
The Regional Bank SPDR (KRE) cannot seem to hold a breakout. The ETF surged on June 8th and broke out on June 9th, but fell back with a close below 54. I noted the 8-June surge in XLF and believe this move holds the key for KRE. A close below 52 would negate the surge and point to a failed breakout. Overall, notice that KRE has gone nowhere since mid December, kind of like IJR and IWM. It seems frustrating, but I still view the falling wedge as a correction and the breakout as a bullish continuation signal.
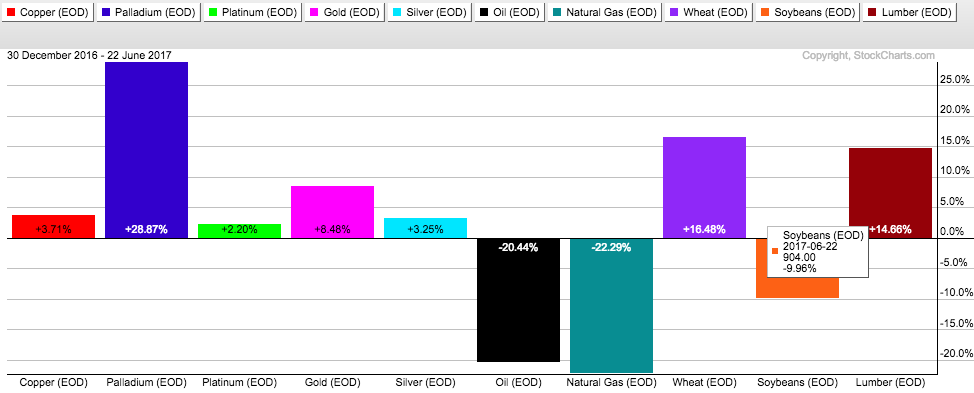
Not all Commodities are Down This Year
I think it is important to keep in mind that the Commodity Tracking ETF (DBC) does NOT represent all commodities (neither does the CRB Index $CRB)). A look at the components shows that the energy complex accounts for over 50% of the ETF (see invesco.com). Basically, this means over 50% is tied to oil and oil is in a long-term downtrend. The PerfChart below shows the continuous futures prices for ten different commodities over the past year. Oil and Natural Gaps are down over 20%, and soybeans are down around 15%. The other seven commodities are up with palladium, wheat and lumber leading.
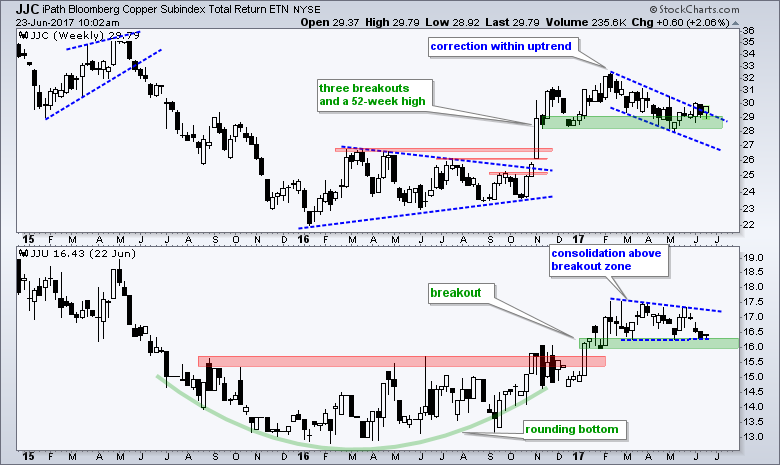
Copper Challenges Channel Line
Once again, I will highlight the Copper ETN (JJC) and the Aluminum ETN (JJU) because both appear to be correcting within long-term uptrends. JJC surged from October to February and then corrected with a falling channel back to the January low (support zone). The ETF has been rising the last six weeks and edging above the channel trend line. A breakout would signal a continuation higher and target a move to the mid 30s. JJU broke out with a surge in January and then fell back to the breakout zone, which turns support. A surge off this support zone would provide the first sign that the bigger uptrend is resuming.
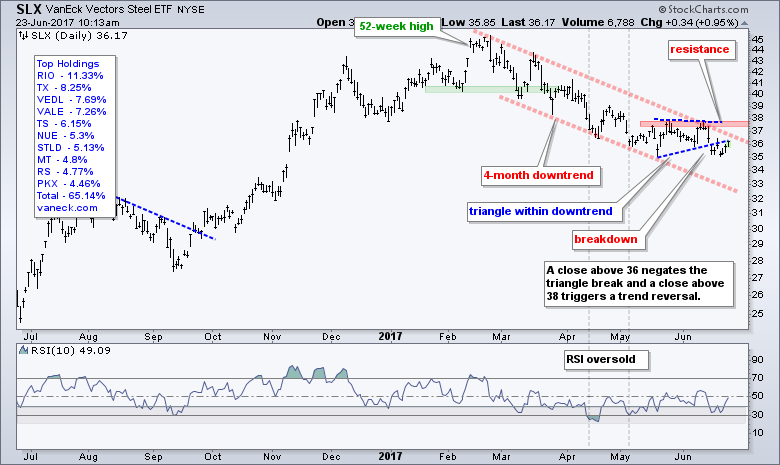
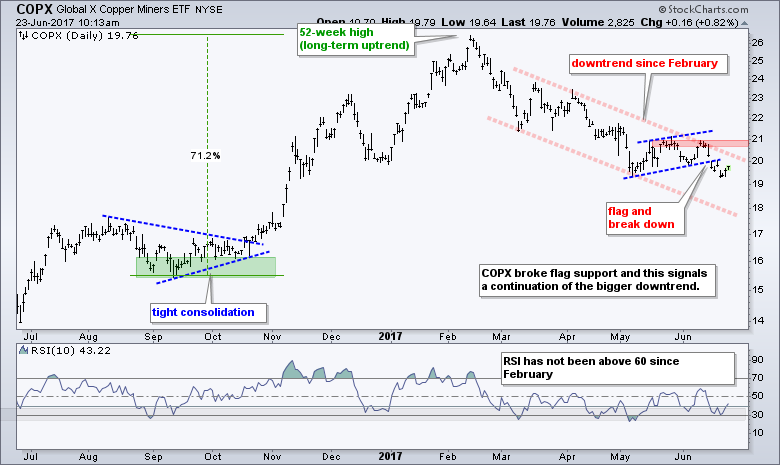
Metals & Mining, Steel and Copper Trend Lower
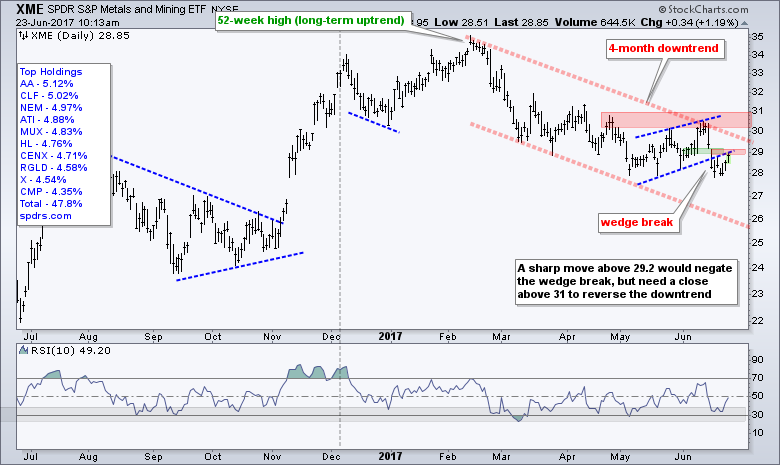
The Metals & Mining SPDR (XME) has struggled most of the year with a decline since February and a seven month low last week. As noted in last weekend's ChartWatchers, we never know how far a correction will extend. Some are short and sweet, some are long and drawn out, and some evolve into bigger downtrends. Timing the end of a correction is also a challenge, but we do it for the love of the trading game. I try not to time bottoms when 52-week lows are within site, but I will keep watching downtrends that I think are corrections within a bigger uptrend.
XME hit a 52-week high with a massive advance from mid October to mid February (four months). The ETF declined the next four months, but remains well above the September-October lows, which means this could be a big correction. The red trend line mark a falling channel to define the downtrend with resistance set in the 30-31 area. A rising wedge formed within the falling channel and XME broke the wedge line last week. This is bearish and the break zone around 29 turns first resistance. A sharp move back above 29.2 would negate this breakout and provide the first sign that we need to reassess the bearish situation.
How Smart is the Bond Market?
Before moving to Treasury bonds, I have three links to an interview with David Rosenberg, chief economist and strategist at Gluskin Sheff. Rosenberg notes that the bond market is sending a message and the bond market is usually smarter than the stock market. However, as Lord John Maynard Keynes noted, the markets can remain irrational a lot longer than we can remain solvent. In addition, I would watch the stock market for clues on the stock market, and the stock market is doing just fine for the moment. Interview One (Economic Denial), Interview Two (StockValuations), Interview Three (Najarian Rebuttal).
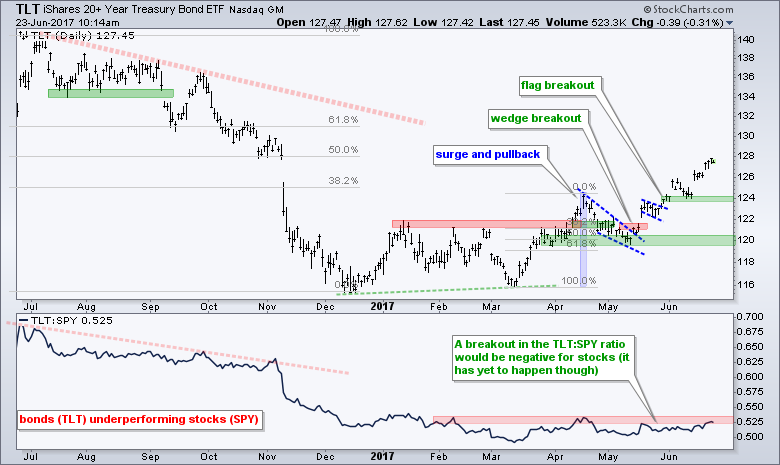
20+ YR T-Bond ETF Hits New High for 2017
The 20+ YR T-Bond ETF (TLT) surged to a new high for the year with a big move on Tuesday and further gains on Wednesday-Thursday. John Murphy noted that falling energy prices are helping bonds, while David Rosenberg thinks that economic weakness is helping bonds. Whatever the reason, Treasury bonds are strong and getting stronger. The wedge breakout and flag breakout were the last two signals. This week's new high (for 2017) is bullish and affirms the overall uptrend, but it is just an observation. Despite strength in TLT, the TLT:SPY ratio has yet to break out. This ratio is above its mid March low, which means TLT is up more than SPY since mid March. A breakout and serious upturn is needed to show a convincing preference for bonds, which are alternatives to risky assets (like stocks).
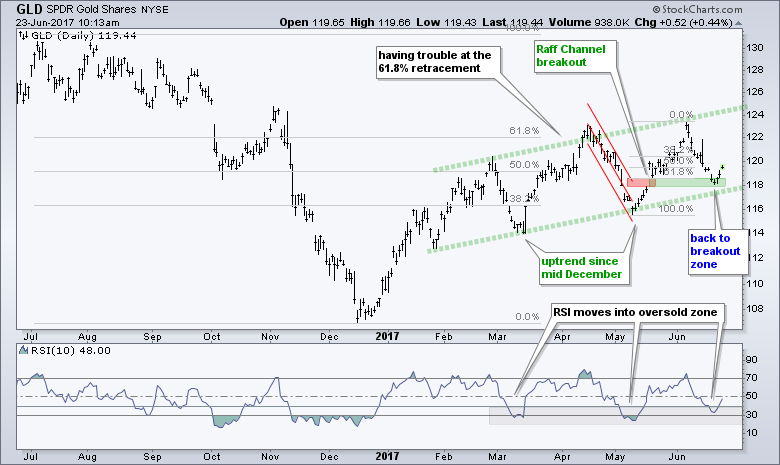
Gold Finds Support at Prior Breakout
The Gold SPDR (GLD) hit its breakout zone and turned up over the last three days. Gold is still tied to the 20+ YR T-Bond ETF (positive correlation) and the US Dollar ETF (negative correlation) so keep an eye on these two. On the price chart, the overall trend is up with higher lows all year. GLD fell back to the breakout zone last week and bounced over the last three days. This bounce is forming another higher low and keeping the bigger uptrend alive. Also notice that RSI moved into the oversold zone last week.
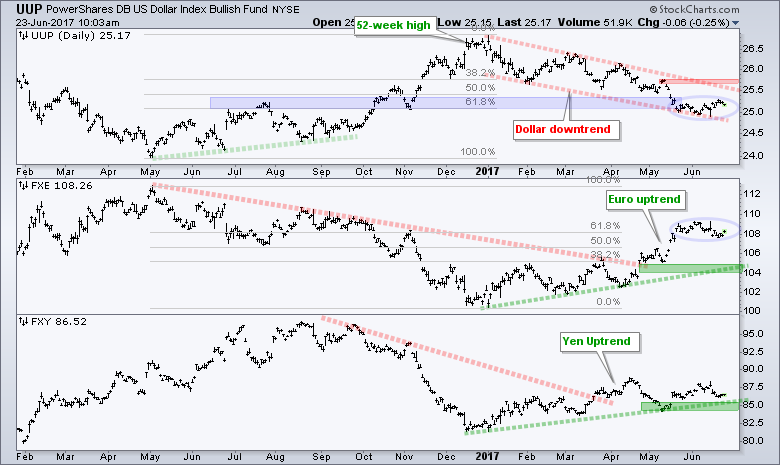
Dollar Firms, but Remains in Downtrend
The US Dollar ETF (UUP) firmed over the last five weeks (blue oval) and the Euro ETF (FXE) softened, but the overall trends remain in place. UUP is trending lower and FXE is trending higher. The red trend lines mark a falling channel for the Dollar this year and a breakout at 25.8 is needed to reverse this decline.
******************************************************
ETF Master ChartPack - 300+ ETFs organized in a Master ChartList and in individual groups.
Follow me on Twitter @arthurhill - Keep up with my 140 character commentaries.
****************************************
Thanks for tuning in and have a good day!
--Arthur Hill CMT
Plan your Trade and Trade your Plan
*****************************************


