.... QQQ Suffers Biggest Loss since early November
.... EW Industrials Sector Nears New High
.... Cummins and JetBlue Lead Industrials
.... New Highs for EW Materials ETF and Cemex
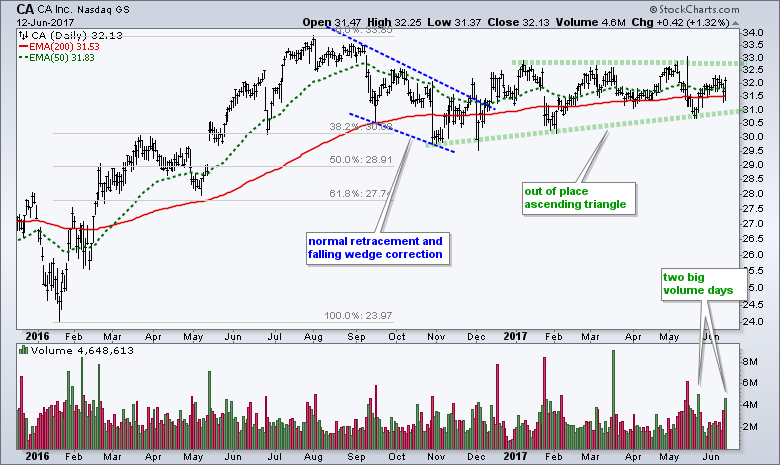
.... CA Forms Out-of-Place Ascending Triangle
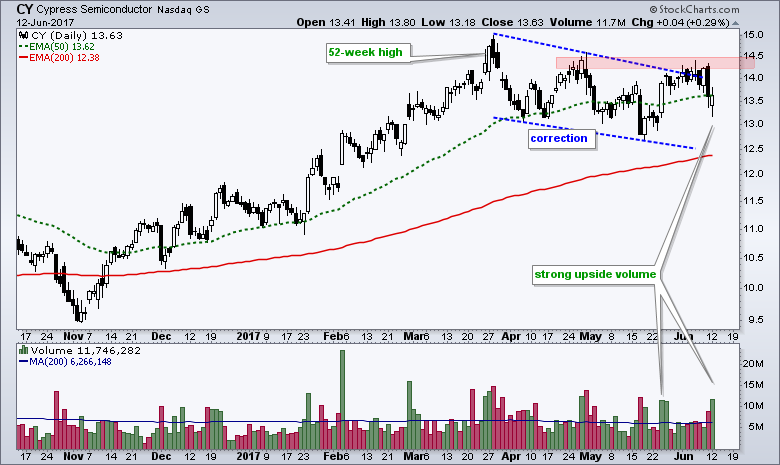
.... Cypress Semi Falls Back into Correction
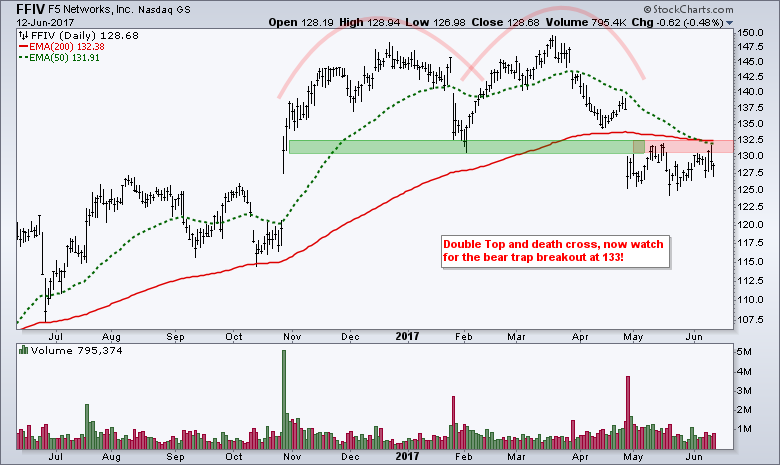
.... Double Top and Death Cross for F5, but
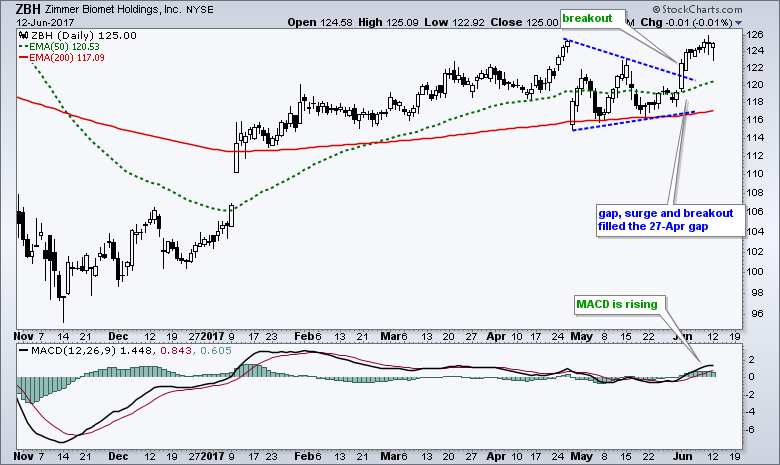
.... Zimmer Biomet Fills Gap with Breakout
.... Finding Oversold Stocks within an Uptrend ....
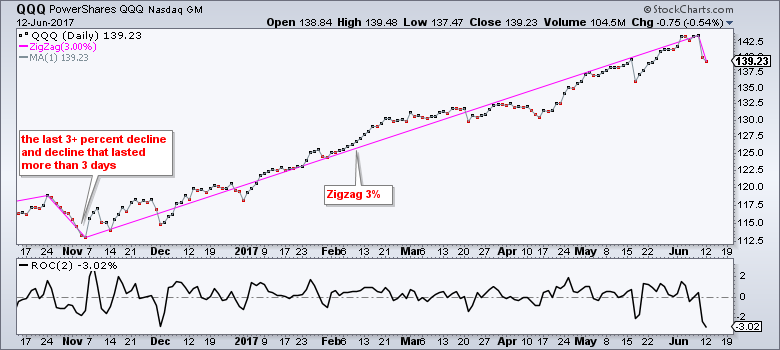
QQQ Suffers Biggest Loss since early November
QQQ suffered its biggest two-day loss of the year and its first decline of more than 3% since the November advance started. On a closing basis, QQQ is down 3.02% over the last two days. The chart below shows the Zigzag (3%) in the main window and the 2-day Rate-of-Change in the indicator window. The Zigzag filters out price moves that are less than 3% and the last decline the Zigzag (3%) was early November.
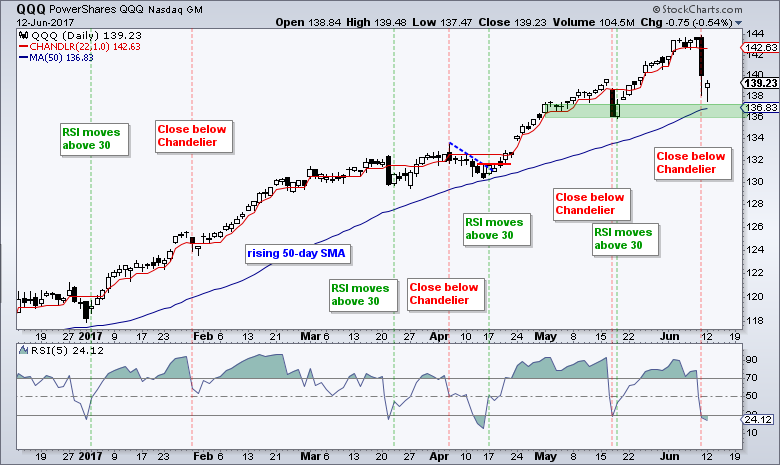
The second chart shows candlesticks with the rising 50-day SMA. Notice that the ETF almost hit this moving average on December 30th and April 13th, and it is very close again. In addition, RSI(5) moved below 30 to become oversold and set up a mean-reversion trade. The last entry signal was on May 18th and Friday's close below the Chandelier Exit triggered an exit on Monday's open. Sometimes it happens like this, like on May 17th. You can read more about the RSI-Chandelier Mean-Reversion system in this System Trader article.
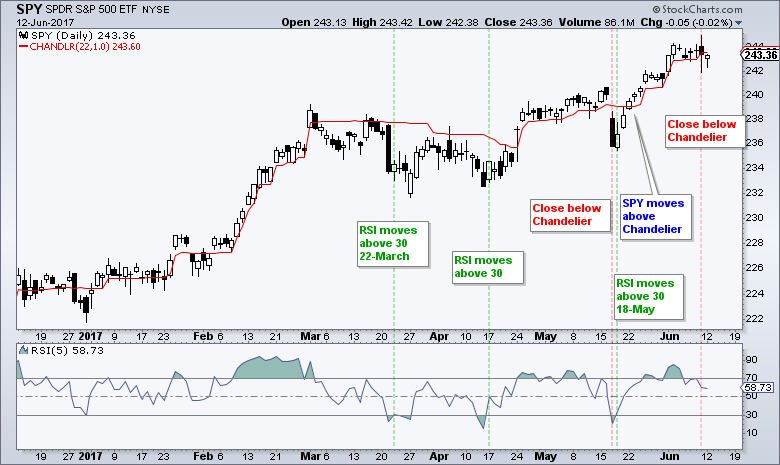
 The next chart shows SPY with the same system at work. RSI(5) moved above 30 for a bullish signal on May 18th and the ETF closed below the Chandelier Exit on Friday. It is now wait-and-see for SPY and this mean-reversion system.
From a bigger picture standpoint, the selling pressure in techs could foreshadow a period of weakness for the broader market. Even though the selling pressure was only for two days, stocks are up significantly this year and ripe for a corrective period as we head into the weakest four month stretch of the year (June, July, August and September). As John Murphy and others have noted, this could be some sort of rotational correction where money moves out of the strong groups and into some of the weaker groups. This means the broad market ETFs, such as SPY, MDY and IJR, could churn and trade sideways.
EW Industrials Sector Nears New High
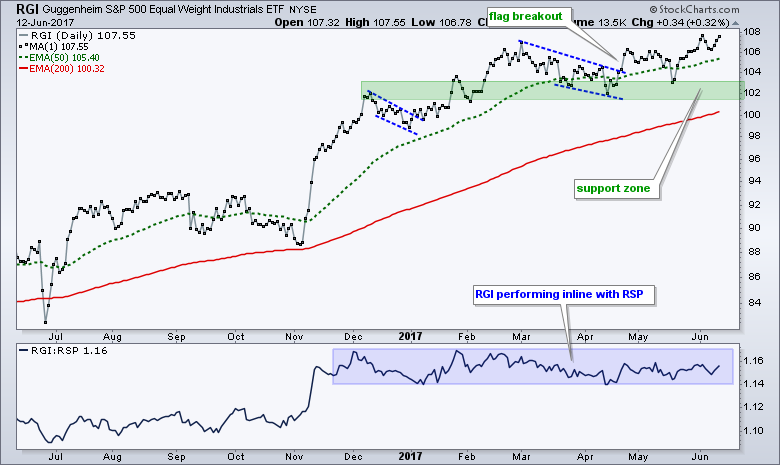
Chartists looking to measure the performance for the average stock in a sector can use the equal-weight sector ETFs. These include the RCD, RYF, RYT, RGI, RTM, RYE, RYH, RHS and RYU. Volume levels may sometimes be light, but we can still chart these for analysis purposes. The chart below shows the EW Industrials ETF (RGI) hitting a new closing high on June 2nd and nearing this high with a bounce the last three days. The big trend here is clearly up and RGI is a leader because it is close to a new high. The indicator window shows the price relative to compare RGI to the EW S&P 500 ETF (RSP). This ratio plot is flat, which means RGI is performing in-line with RSP. Note that industrials account for 13.52% of the equal-weight S&P 500.
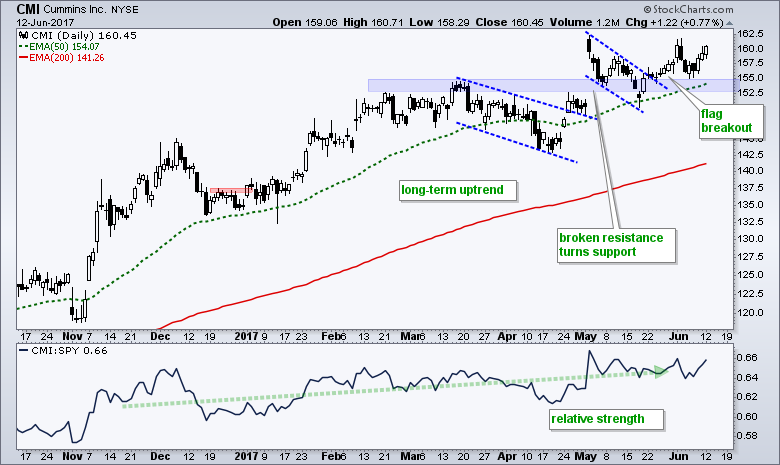
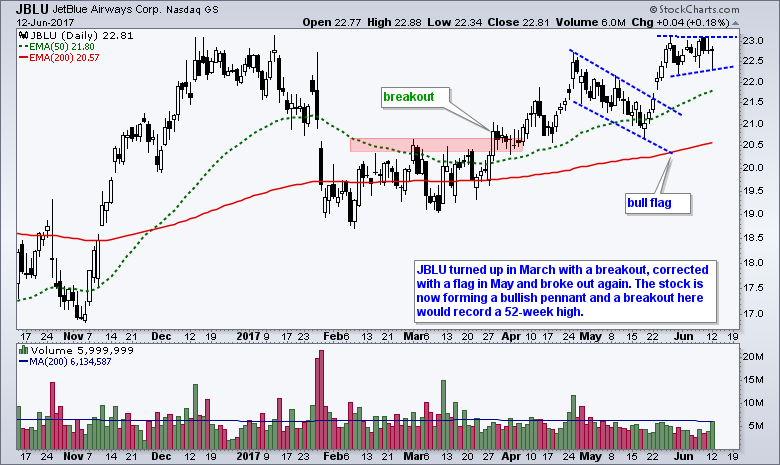
Cummins and JetBlue Lead Industrials
Cummins Engine (CMI) and JetBlue (JBLU) are part of the industrials sector and both sport long-term uptrends. Shorter-term, CMI broke flag resistance in late May and bounced off the support zone the last five days. JBLU was featured on May 23rd as the bull flag took shape. The stock broke out with a surge to 23 and then formed a pennant, which is a bullish continuation pattern.
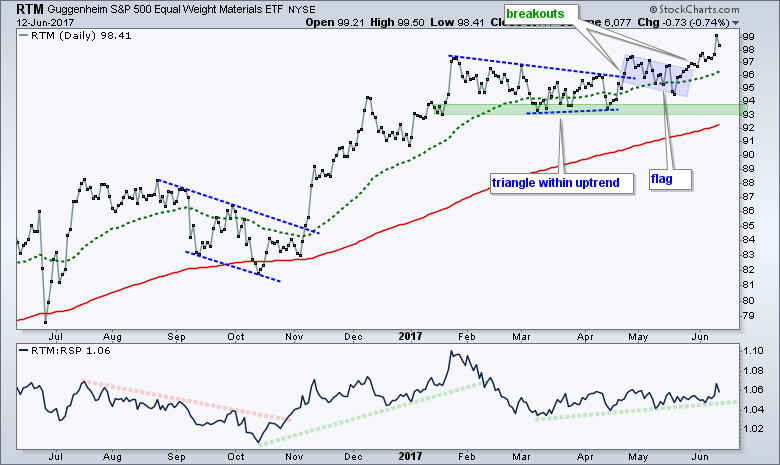
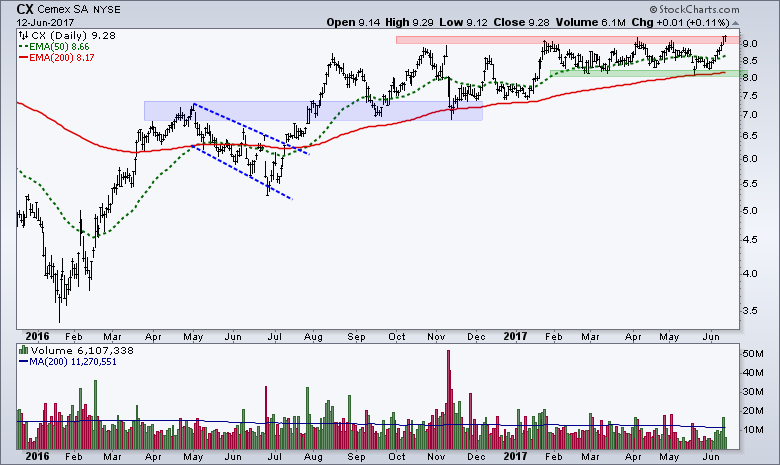
New Highs for EW Materials ETF and Cemex
The EW Materials ETF (RTM) is also showing leadership because it broke out in late April and mid May, and hit a 52-week high on Friday. This means there is broad strength within the material sector, at least broad enough to push this equal-weight ETF to new highs.
The chart below shows Cemex (CX) edging above its April high and hitting a new high on Monday. The long-term trend is up and the stock consolidated from February to June. A consolidation within an uptrend is typically a bullish continuation pattern and this breakout signals a continuation of this uptrend.
CA Forms Out-of-Place Ascending Triangle
CA Inc. (CA) is part of the technology sector because it provides information technology management and software solutions. CA has clearly lagged the Nasdaq and QQQ this year because it is flat year-to-date. However, I noticed two big volume days over the last few weeks and an out-of-place ascending triangle. I say out-of-place because these are usually bullish continuation patterns that form within an uptrend. The higher lows reflect buying pressure coming in at higher price levels (increasing demand). The equal highs reflect overhead supply at the same price levels. An upside breakout would confirm the pattern and open the door to new highs.
Cypress Semi Falls Back into Correction
The high-flying tech stocks were hit hard on Friday and Monday, but this does not change the overall picture for most. The two day declines created short-term oversold conditions within bigger uptrends. With the bigger uptrends, these oversold conditions represent more of an opportunity than a threat. Cypress Semiconductor (CY) remains on my radar because the big trend is up and a correction formed over the last few months. The stock was on the verge of a breakout last Thursday, but got hit on Friday. CY manage to firm on Monday with the highest volume of the month and a breakout at 14.5 would be quite bullish.
Double Top and Death Cross for F5, but
The chart for F5 Networks (FFIV) is being used to channel the inner cynic in me. There is a clear double top and a death cross as the 50-day EMA moved below the 200-day EMA. The broken support zone and May-June highs turn into a resistance zone. Watch for a breakout at 133 to throw cold water on the double top and spring a bear trap. Why would I suggest such a thing? It is a bull market right now. Tech stocks, although slammed the last two days, are leading. And, the Networking ETF (IGN) broke out two weeks ago. Thus, the bigger picture items still favor the bulls and this means we may not see a bearish resolution to the double top and death cross in this networking stock.
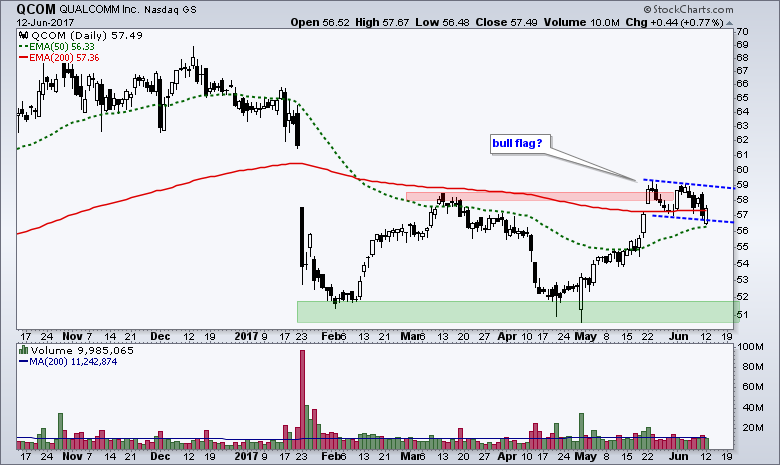
The chart for Qualcom shows two troughs in the 51 area and a surge to resistance in the 58 area. The stock caught my eye because a bull flag is now forming and a breakout at 59 would signal a continuation of the May advance.
Zimmer Biomet Fills Gap with Breakout
Zimmer Biomet (ZBH) is part of the medical devices group, which is one of the strongest groups in the market right now. The stock gapped down on April 27th, but immediately firmed and then gapped up in early June. This gap-surge led to a breakout that filled the prior gap and led to a new high.
Finding Oversold Stocks within an Uptrend
The scan presented in last week's article on trend direction and trend strength produced 39 candidates. These are stocks in strong uptrends with RSI(10) below 40, which is in the oversold zone. Unsurprisingly, it is full of high-flying tech names that were hit hard over the last two days. I edited this scan and article because the 21-day EMA will always be above the 126-day EMA when the 21-day EMA is above the 63-day EMA and the 63-day EMA is above the 126-day EMA. Thanks JW!
// set stock universe
[[group is SP500] or [group is SP400] or [group is SP600]]// insure daily Dollar Volume is greater than $5 million
AND [SMA(20,close) * SMA(250,volume) > 5000000 ]// EMA ribbon is positive for an uptrend
AND [EMA(21,close) > EMA(63,close)]
AND [EMA(63,close) > EMA(126,close)]// 126-day Stoch is above 70 for a strong uptrend
AND [Full Stoch %D(126,5,1) > 70.0]// RSI is near oversold
AND [RSI(10) < 40]
******************************************************
ETF Master ChartPack - 300+ ETFs organized in a Master ChartList and in individual groups.
Follow me on Twitter @arthurhill - Keep up with my 140 character commentaries.
****************************************
Thanks for tuning in and have a good day!
--Arthur Hill CMT
Plan your Trade and Trade your Plan
*****************************************


