 |
.... Bullish until it Ain't (seasonality) |
----- Art's Charts ChartList (updated 9-June) -----
Bullish Until it Ain't
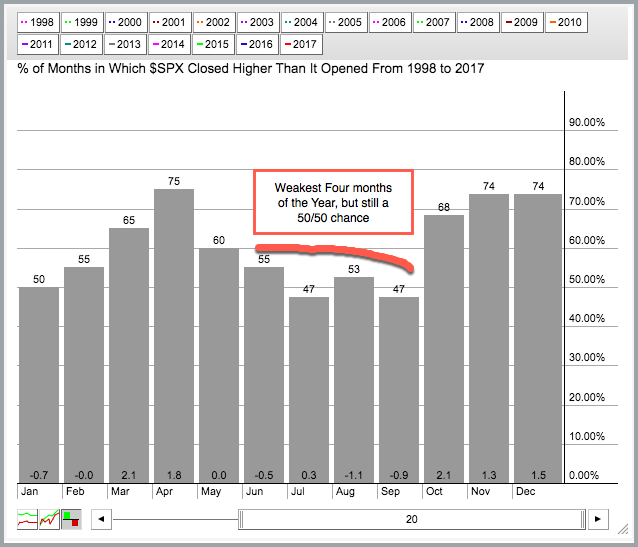
The stock market just entered its weakest four month period, but the trends and indicators are still pointing bullish. Who are we to believe? The trends and indicators, of course. I provided a different take on seasonality in May and suggested that the June to September period is indeed the weakest part of the year for the stock market. This is based on historical testing and the Seasonality Tool at StockCharts. With the S&P 500 up some 16% from its November low, the stock market is certainly entitled to a correction or a consolidation. That does not mean we will get it and it could be one of these rotational corrections. In other words, money could just rotate from some of the stronger groups to some of the weaker groups. We saw some of the weaker groups attracting money this week with the Finance SPDR (XLF), Regional Bank SPDR (KRE) Metals & Mining SPDR (XME) and Copper Miners ETF (COPX) getting bounces. These four have similar patterns and setups on the charts. Namely, they are correcting within bigger uptrends. I will focus on these groups in today's commentary. I will add a video by noon ET on Friday.
SPY Extends on Breakout
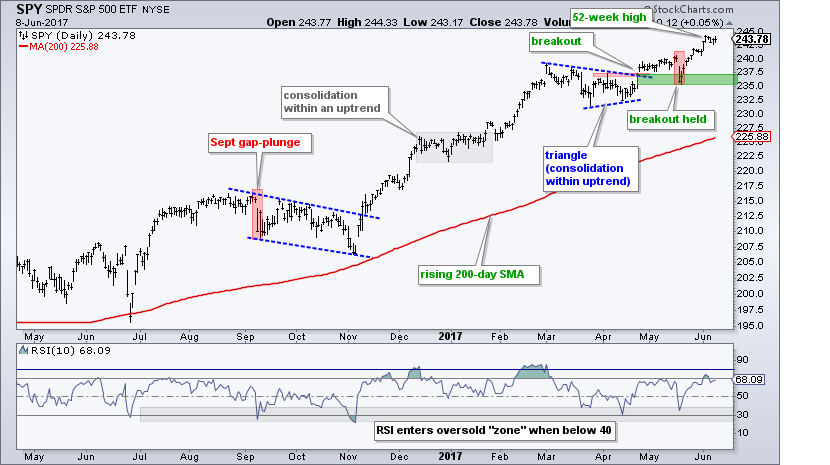
The broad market environment remains bullish with large-caps and large-techs leading the way. The S&P 500 SPDR (SPY) broke triangle resistance with a surge in late April and this ended the most recent corrective period. Remember, a consolidation within an uptrend is a bullish continuation pattern. Thus, SPY had its rest and is now continuing higher, which is bullish. The breakout zone turned into support and held in mid May. The most recent surge to new highs reinforces support in the 235-237 area and this is the first level to watch for signs of a correction.
QQQ Extends its Leadership Run
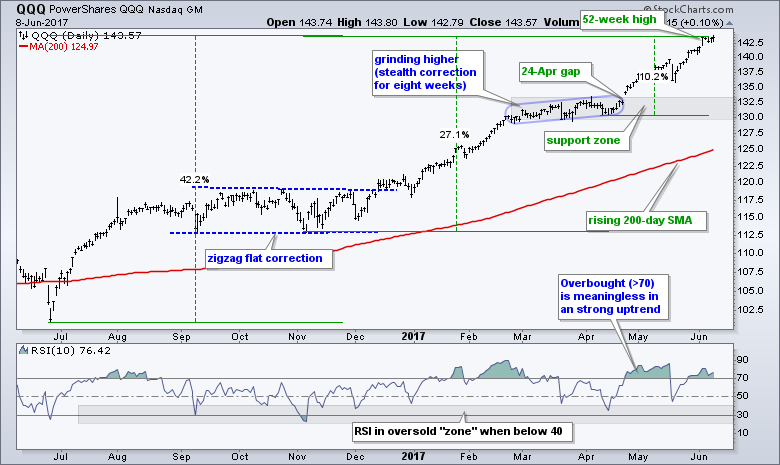
QQQ hit a new high last Friday and then stalled this week. ETF hit another intraday high on Thursday and remains in the strongest of uptrends. QQQ is up around 10% from the April low, 27% from the early November low and 42% from the June low (Brexit). On a closing basis, the ETF has not declined more than 3% and not experienced a decline that lasted more than three days.
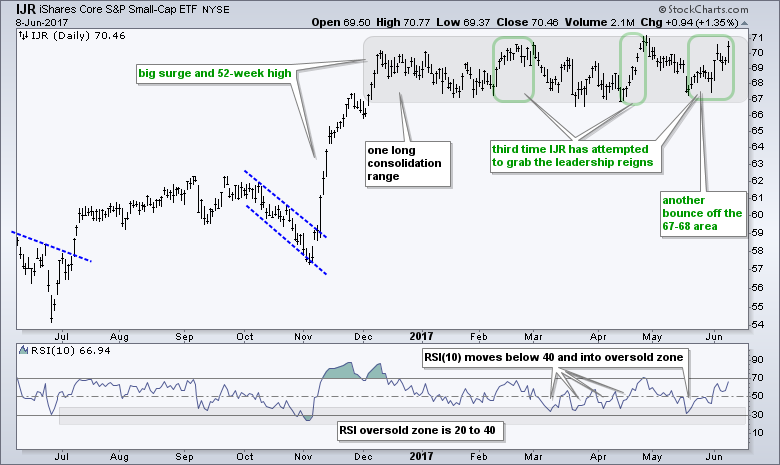
Small-caps Challenge for Leadership
For the second time in three months, small-caps are surging and outperforming large-caps. The chart shows IJR surging off the 67-68 area and nearing the upper boundary of its six month trading range. Note that this is the third time IJR has surged off this level and the third time the ETF has outperformed SPY on a 2-3 week timeframe. Will this third time be the charm? Even though IJR is not as strong as SPY, it is by no means weak because it is around 1% from a 52-week high.
Finance Sector Bids to End Correction
I will start with the Finance SPDR (XLF) because it surged on Thursday and broke the wedge line. Note that John Murphy also covered the surge in financial stocks on Thursday. First and foremost, XLF is in a long-term uptrend because it hit a new high in early March. Second, the decline from early March to mid April was viewed as a correction within this uptrend. Notice that this decline pretty much ended in mid April. Third, XLF bounced of the green support zone three times. The most recent bounce broke the wedge line and it looks like a breakout is in the making. A close below 23.20 would call for a re-evaluation.
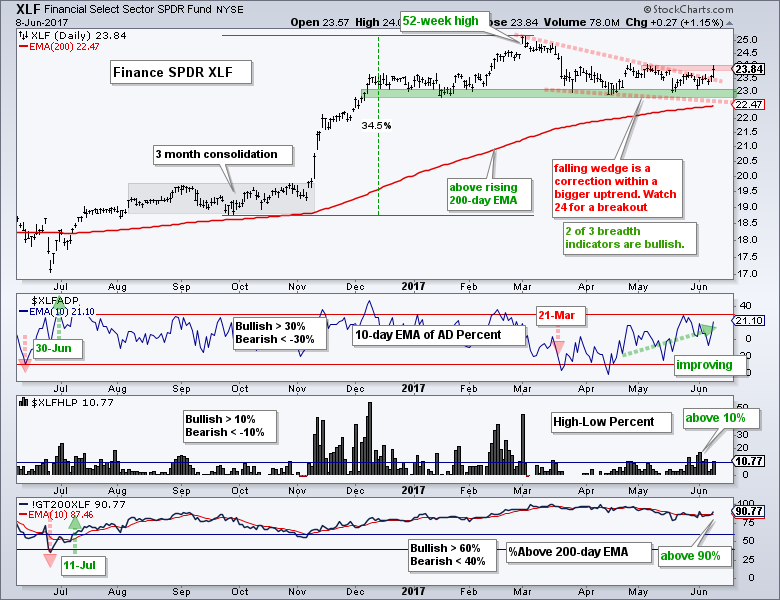
The indicator windows show the breadth indicators for XLF. Notice that the 10-day EMA of XLF AD Percent ($XLFADP) has been working its way higher since mid April. Also notice that XLF High-Low% ($XLFHLP) moved above +10% several times over the last three weeks. This shows improvement within the sector. Last, but not least, the Finance %Above 200-day EMA (!GT200XLF) is back above 90% and this is the second highest reading among the nine sectors (XLU is top, XLK is third). Understanding the AD Percent Indicators, High Low Indicators and %Above 200-day EMA Indicators.
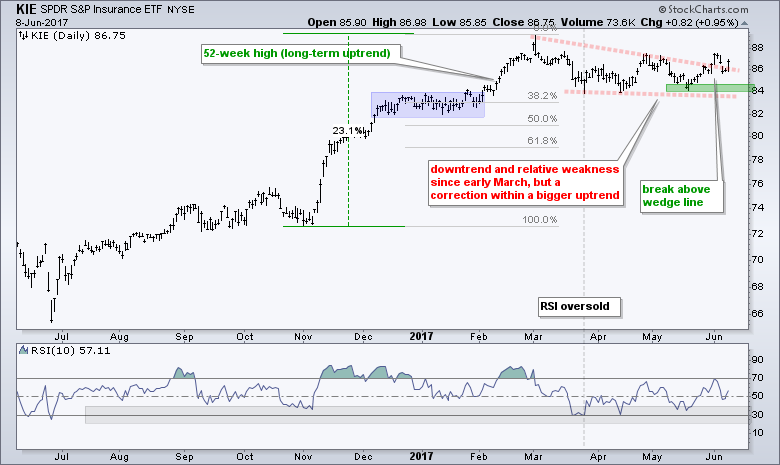
Insurance Leads and Regional Banks Play Catch Up
The Insurance SPDR (KIE) led the finance sector with a break above the wedge line last week. KIE fell back early this week, but rebounded on Thursday to keep the wedge breakout alive.
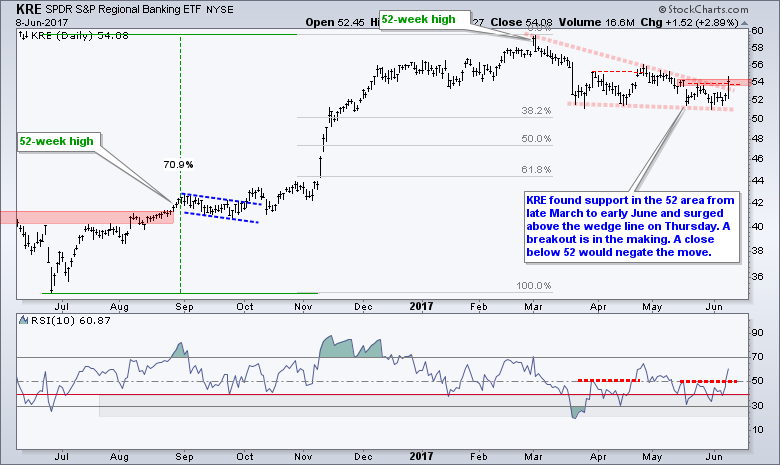
The Regional Bank SPDR (KRE) has been lagging the broader market since March because of the correction. Notice that KRE fell from 60 to 52 in March and then held support in the 52 area with three bounces. The most recent bounce broke the wedge line and exceeded the late May high. Also notice that RSI broke above its late May high for a momentum breakout. This breakout looks valid as long as 52 holds. A close below 52 would call for a re-evaluation.
Materials Sector hits New High
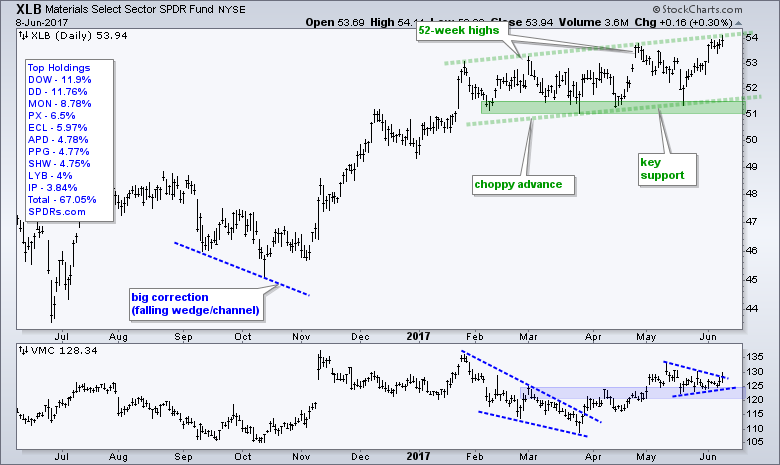
The Materials SPDR (XLB) can be considered one of the leading sectors because it hit a new high on Thursday. Overall, the chart shows XLB surging from October to January and then working its way higher with a rising channel the last four months. It is a choppy advance, but it is clearly an advance and uptrend. The indicator window shows Vulcan Materials (VMC) bouncing off a support zone the last two days and challenging the triangle line.
XME Makes a Bid to End Correction (watch steel)
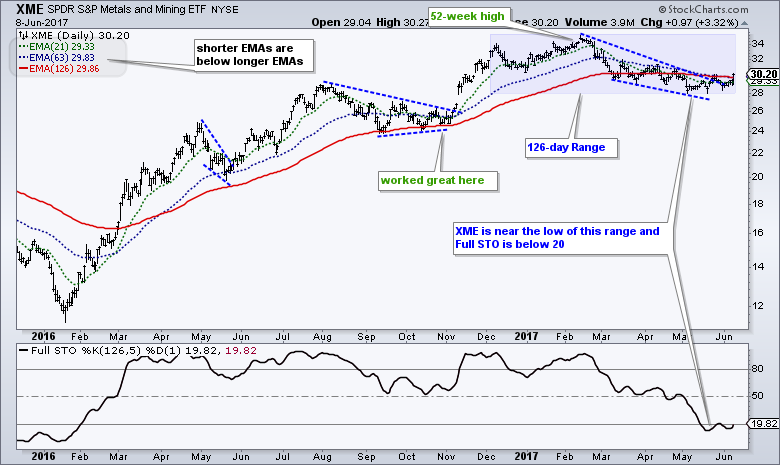
I am also seeing some interesting activity within the materials sector. Namely, the Copper Miners ETF (COPX), Metals & Mining SPDR (XME) and Steel ETF (SLX) are making bids to end their corrections. I wrote an article about trend direction and trend strength this week. This article shows ho to use the 21-day EMA, 63-day EMA and 126-day EMA to determine the trend and the 126-day Full Stochastics (126,5,1) to determine trend strength. The problem with indicators is you must pick a timeframe or lookback period. This is a problem (aka challenge) because the indicator may not reflect the bigger picture (outside its timeframe). For example, the indicators suggest that XME is in a downtrend because the shorter EMAs are below the longer EMAs and Full STO (126,5,1) is below 20. XME is indeed in a downtrend since mid February, but we must put this downtrend in context. Is it a correction or something more?
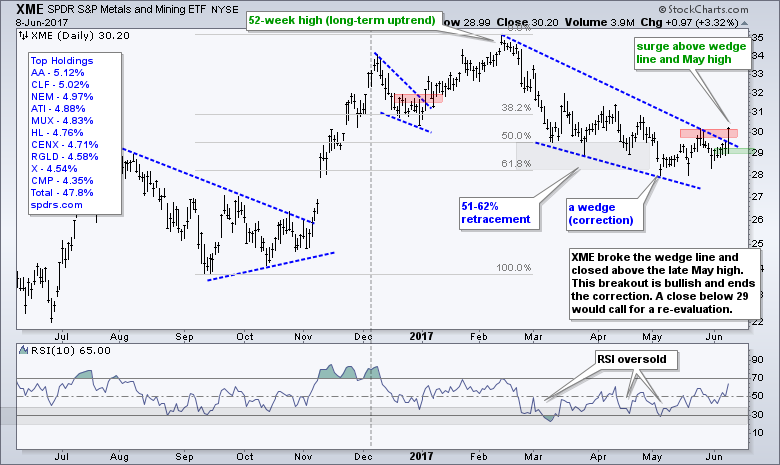
Indicators are good for system development and scans, but the price chart should not be ignored. Even though XME is in a four month downtrend, this still looks like a correction and it could be ending. First, the long-term trend is up because XME hit a 52-week high in February and remains well above the September-October lows. Second, the falling wedge and ~61.8% retracement are typical for corrections within a bigger uptrend. A breakout is in the making with XME surging above the wedge line and late May high. A close below 29 would call for a re-evaluation.
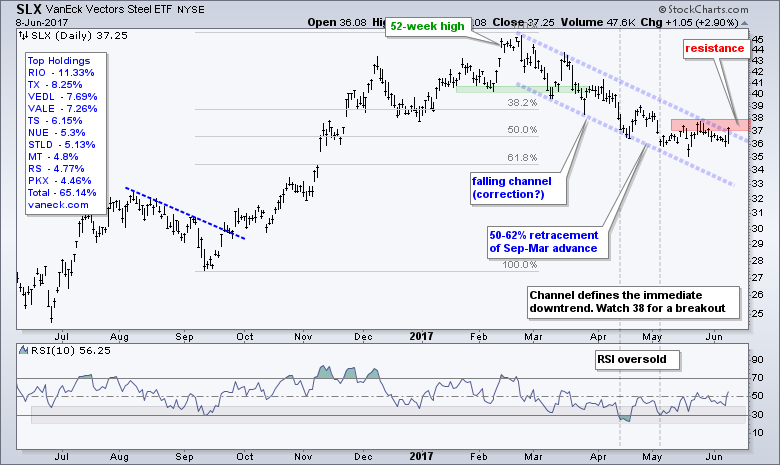
Steel holds the key to XME because steel stocks account for 44% of the ETF. The chart below shows the Steel ETF (SLX) bouncing on Thursday and breaking the channel line, but still short of a clean breakout with a close above the mid May high. A follow through close above 38 is needed to fully reverse this correction.
Copper and Aluminum Bid to End Corrections
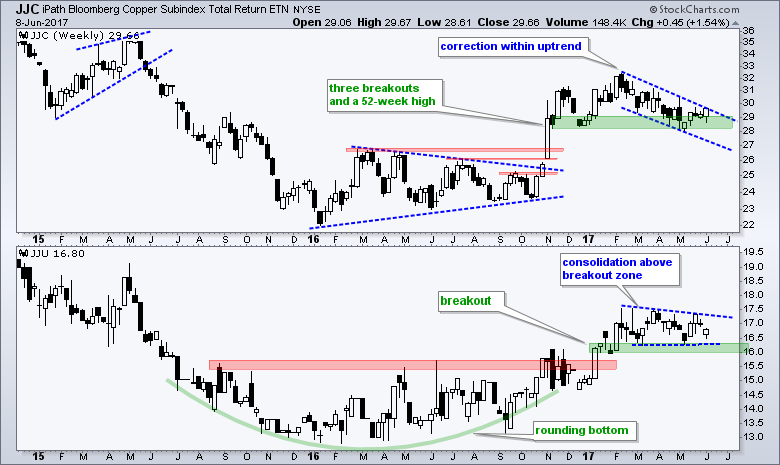
The Copper ETN (JJC) and the Aluminum ETN (JJU) may not be suited for trading because of low volume, but we can use them for analysis because they track the underlying commodity quite well. The first chart shows JJC surging and breaking out from October to February and then correcting with a falling channel of sorts. JJC is finding support in the 28-29 area with a bounce the last four weeks. A breakout at 29.5 would signal an end to this correction and a resumption of the bigger uptrend. The lower window shows JJU breaking out and consolidating above the breakout zone. In a separate, but possibly related note, the China iShares (FXI) and CSI 300 China A-Shares ETF (ASHR) hit new highs this week.
Four Aluminum Stocks to Watch
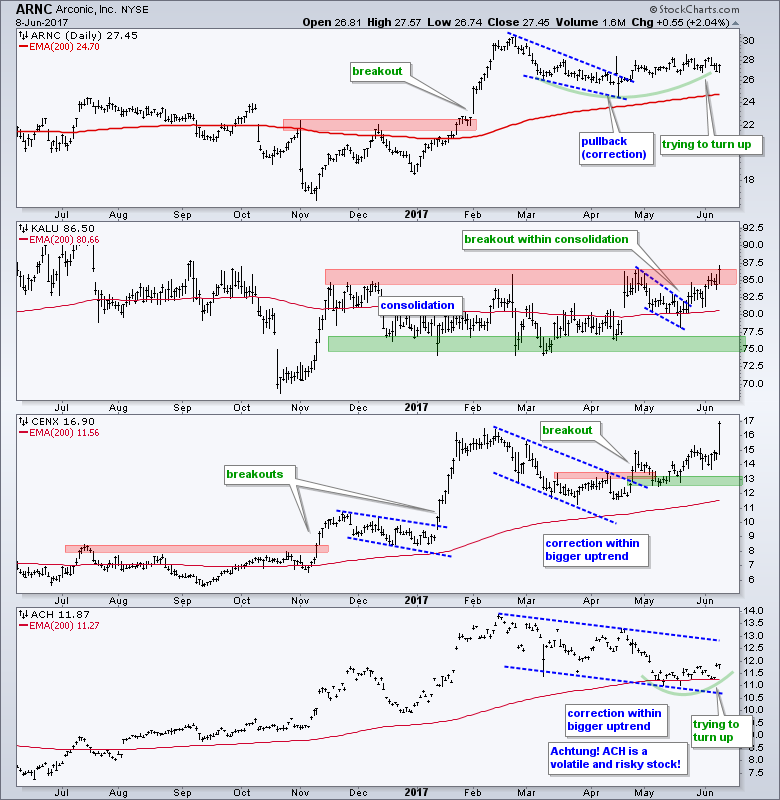
I featured Arconic (AA), Kaiser Aluminum (KLU), Century Aluminum (CENX) and Aluminum Corp of China (ACH) in Art's Charts on May 30th. CENX is leading with a break above the February high and KLU is challenging resistance. AA broke out in late April and worked its way higher the last few weeks. ACH is trying to turn up near the 200-day EMA.
Copper Miners Bid to End Correction
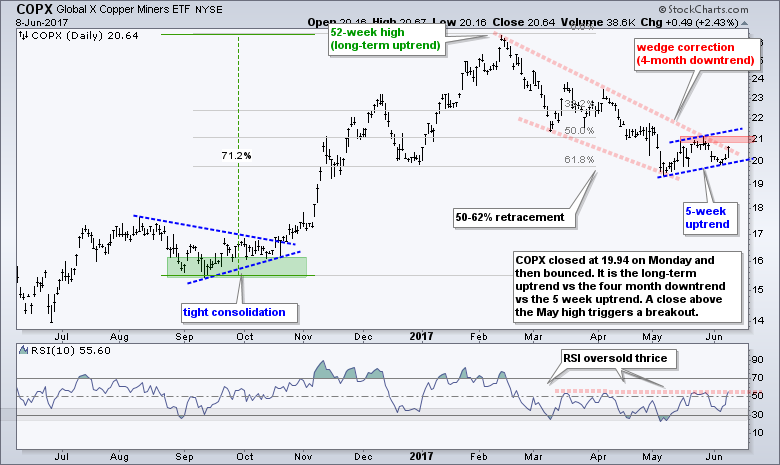
The Copper Miners ETF (COPX) advanced some 70% from September to February and hit a new high. The stock fell over 20% from this high, but remains well above the September low. A correction after such an advance is normal and the correction also looks normal as a falling wedge retraced 61.8%. COPX moved higher the last five weeks and a close above the May high would signal an end to the correction.
Healthcare Leads with New High
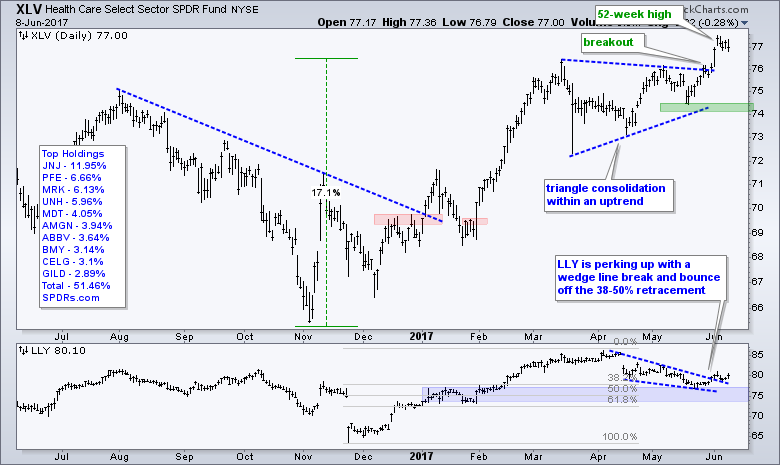
The HealthCare SPDR (XLV) is also a leading sector because it hit a 52-week high last Friday. The ETF stalled the last four days, but this does not detract from the overall uptrend. Overall, XLV surged in February, consolidated with a triangle and broke out with the surge above 77. I will leave key support at 74 for now.
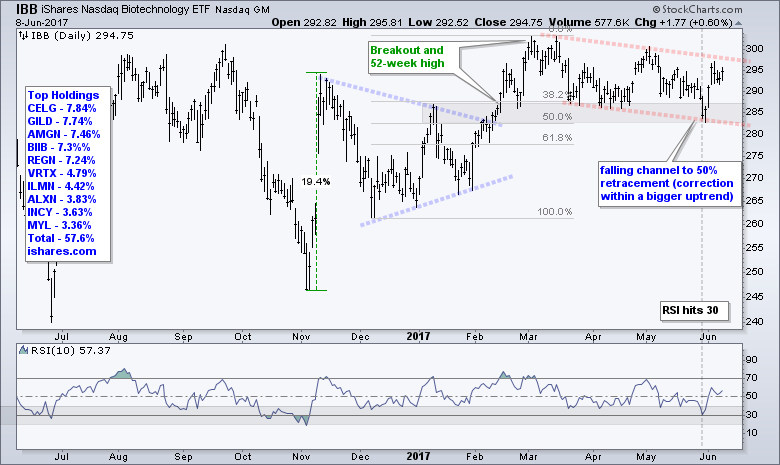
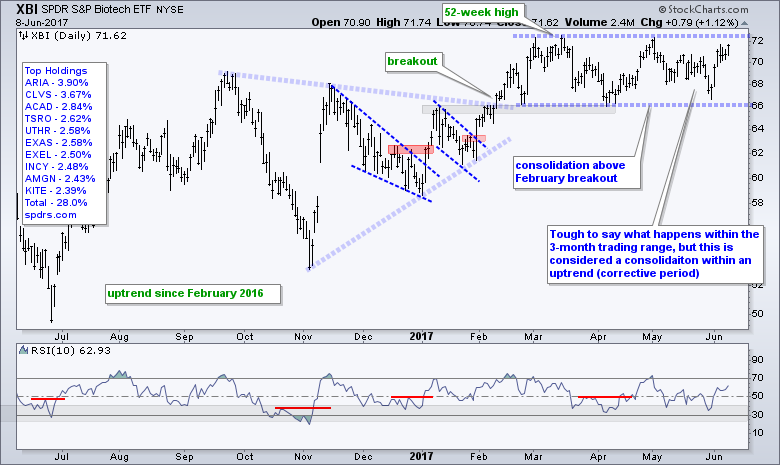
The biotech ETFs broke out in February and then consolidated above these breakout zones (gray area). With new highs just a few months ago, these consolidations are considered corrections within a bigger uptrend and breakouts are expected. IBB corrected with a falling channel and surged above 290. A breakout at 300 is needed to fully end the correction and resume the bigger uptrend. The Biotech SPDR (XBI) surged of trading range support and a break above the March-May highs would end this correction.
Techs Continue to Reign Supreme
The tech sector again led the market as the Technology SPDR hit a new high this week. The chart below shows XLK and five tech ETFs. XLK, Internet ETF (FDN), Software iShares (IGV) and Cloud Computing ETF (SKYY) consolidated in March-April (blue zones) and then broke out to continue their uptrends in late April. All four hit new highs over the last five trading days.
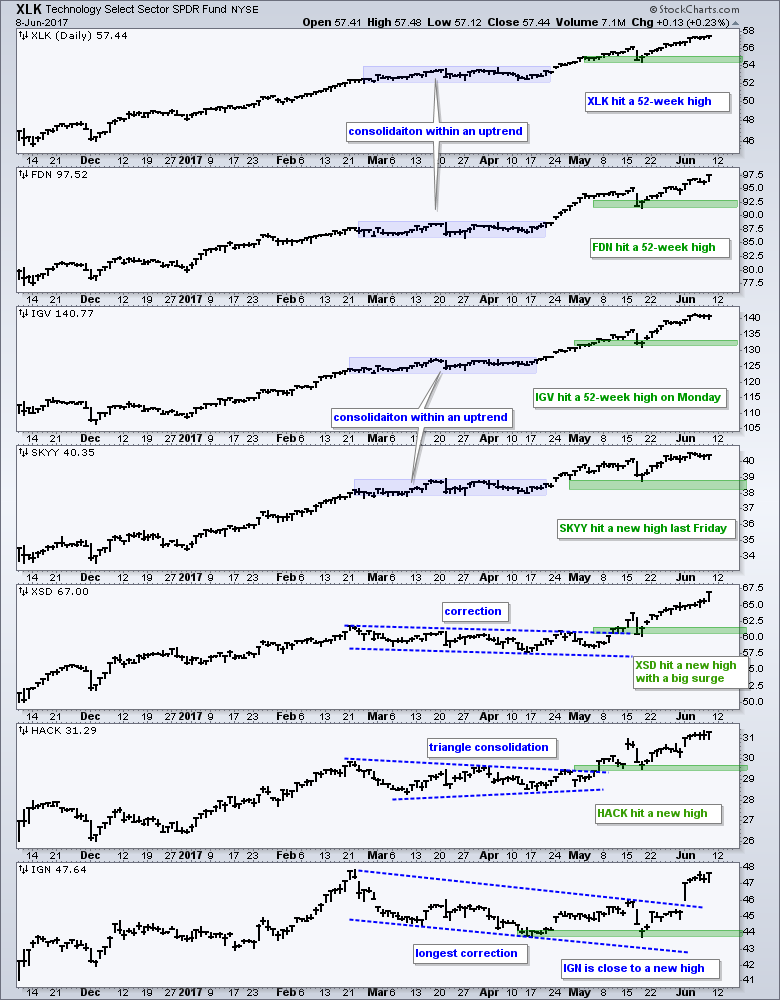
The Semiconductor SPDR (XSD) was lagging the others in mid May, but finally broke out and surged to a new high this week. Similarly, the Cyber Security ETF (HACK) formed a triangle, broke out in early May and hit a new high this week. The Networking iShares (IGN) is still the least strong of the group, but it also broke out on June 1st and is close to a 52-week high. Overall, there is nothing negative to say about the tech groups right now. Seemingly bverbought and ripe for a correction is not negative! The green zones mark key support levels and technology is the place to be until we start seeing some support breaks.
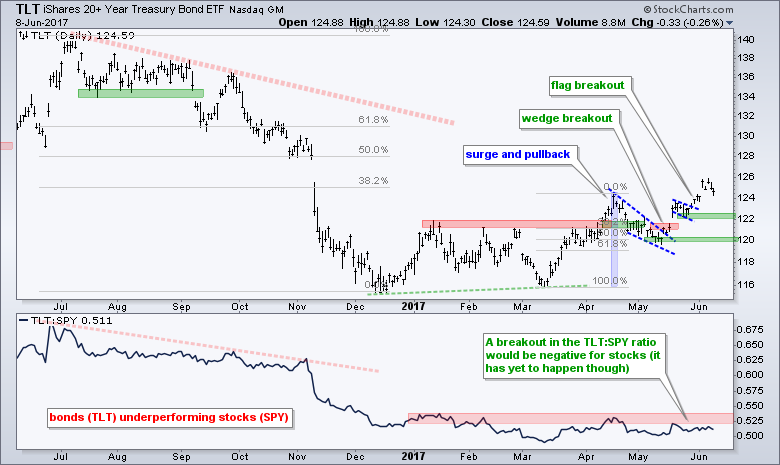
T-bond ETF Hold Flag Breakouts
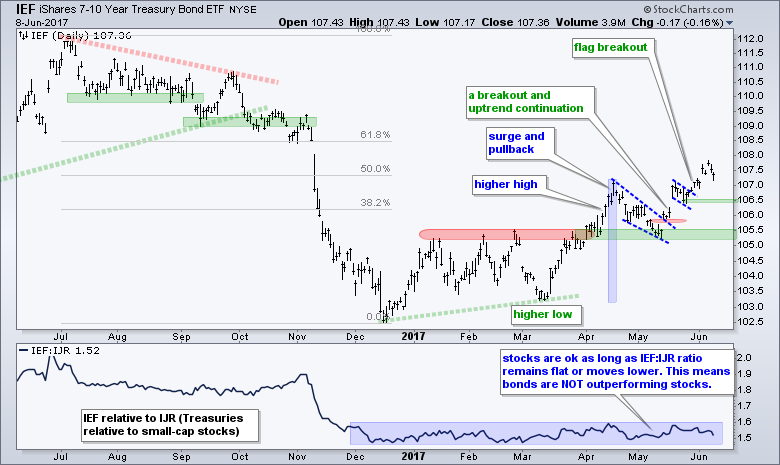
The 7-10 YR T-Bond ETF (IEF) and the 20+ YR T-Bond ETF (TLT) remain in uptrends, but are not outperforming stocks. IEF broke the red resistance zone in April, broke out of a falling wedge in May and broke flag resistance two weeks ago. The flag lows mark first support at 106.5 and key support is set with the May low. Notice that the IEF:IJR ratio remains flat and this means bonds are NOT outperforming small-caps. The rise in bonds is not a concern as long as this ratio remains flat or in a downtrend.
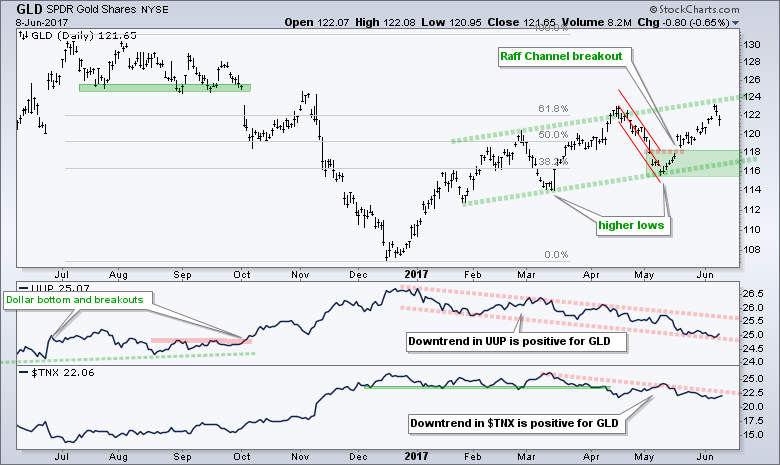
Gold Channels Higher
The Gold SPDR (GLD) took a small hit as the 10-yr T-Yield ($TNX) and US Dollar ETF (UUP) ticked up the last two days. Overall, GLD is in a clear uptrend, while $TNX and UUP are in clear downtrends. The green lines mark a rising channel to define the advance. I would not call the upper trend line resistance though. The lower trend line and the May low combine to mark support in the 116-118 area.
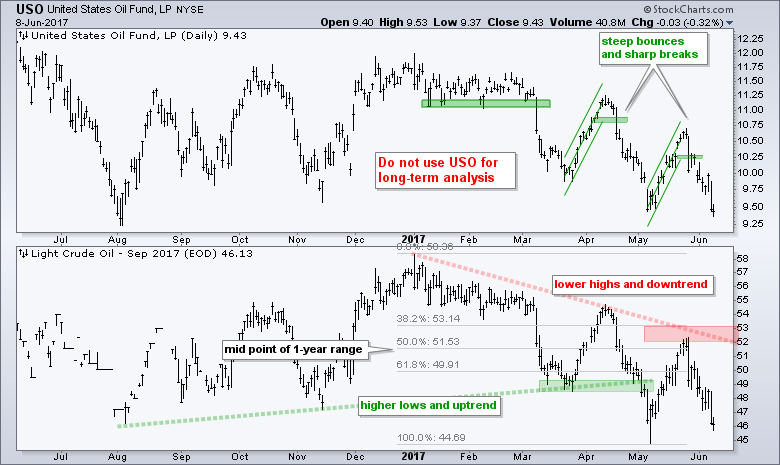
Oil Tests May Low, but Not Support
September Crude (^CLU17) took another hit this week and is testing the May low. I would not call this support because the trend is down and support levels are not expected to hold in a downtrend. Lower lows and lower highs are expected in downtrends. As a general guideline, I try not to mark support in downtrends and resistance in uptrends. The downtrend in 2017 is clear with resistance marked in the 52-53 area. With oil in a downtrend and near a 52-week low, energy-related stocks and ETFs are off my radar.
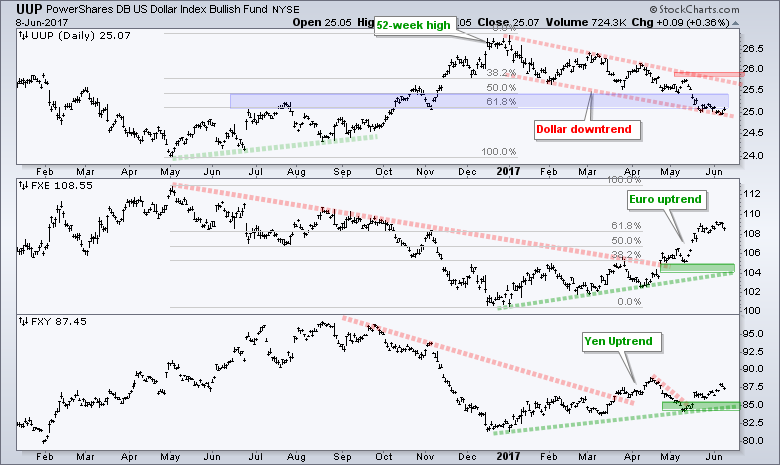
UUP Stalls Near Key Fibonacci Level
The US Dollar ETF (UUP) is in a clear downtrend this year, while the Euro ETF (FXE) and the Yen ETF (FXY) are in clear uptrends. However, as noted last week, UUP hit a potential reversal zone three weeks ago and stalled around 25. The reversal zone stems from broken resistance and the 61.8% retracement. If the big trend is up and this is a correction, then I would expect a reversal in the 25 area. Look for surge off this level for the first sign. A follow through breakout at resistance (26) would reverse the overall downtrend.
******************************************************
ETF Master ChartPack - 300+ ETFs organized in a Master ChartList and in individual groups.
Follow me on Twitter @arthurhill - Keep up with my 140 character commentaries.
****************************************
Thanks for tuning in and have a good day!
--Arthur Hill CMT
Plan your Trade and Trade your Plan
*****************************************


