.... Finding Strong and Persistent Uptrends
.... Understanding Your Indicators
.... A Simple Trend Following
.... Measuring Trend Strength
.... Focus on a Failure
.... Strong Uptrend Scan Code
.... Current State of the Market ....
Finding Strong and Persistent Uptrends
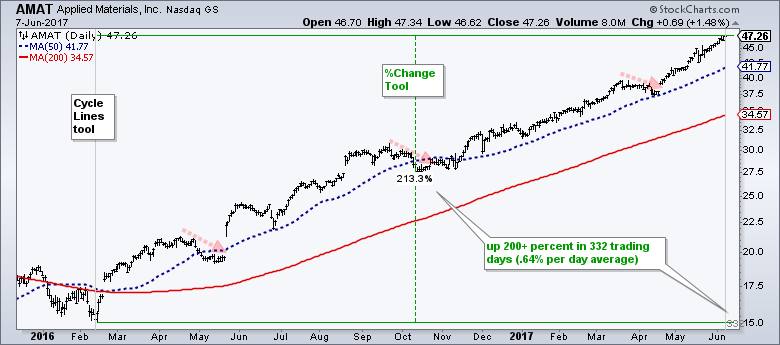
There are some incredibly strong and persistent uptrends in the market right now and I would like to be able to find such trends. I am talking about advances with low volatility that simply extent a few cents at a time - for a long time. The chart below shows Applied Materials (AMAT) advancing over 200% in 332 trading days, which averages .64% per day. The trend is as steady-eddy as it gets with only three mild pullbacks in the past 18 months. Wow!
It is important that we have a few charts like this in our portfolio so I set out to define this strong trend using some simple indicators. These indicators could form the basis for a trading system in the future and can be used now to scan for strong stocks. This article will simply explain the indicators and highlight some interesting charts.
Understanding Your Indicators
It is vitally important to fully understand the indicator you are using and exactly what it is telling you. There are literally hundreds of indicators ranging from the very simple to the very complex. Complexity does not necessarily make an indicator better. In fact, I have found that the simple indicators are often just as good as the complex. At the very least, it is much easier to fully understand the simple indicators and learn how they work. Detailed articles for every SharpChart indicator can be found in the ChartSchool here at StockCharts. I would suggest studying the article and the formula before using an indicator. Less really is more!
A Simple Trend Following
I am choosing two very simple indicators to measure the direction and the strength of the trend: three exponential moving averages and the Stochastic Oscillator. Personally, I prefer exponential moving averages to simple moving averages because EMAs put more weight on recent price data. This does not make them better or worse, it is just a personal preference.
I chose 21, 63 and 126 days because these are equivalent to one month, three months and six months. Note that there are around 252 trading days in a year. There is nothing magical in these numbers, they just sound logical for capturing a decent trend. 30 days, 80 days and 150 days would probably work just as well. I could add more EMAs or adjust the timeframe, but I think this would be counter-productive.
I am using the EMA crossovers and EMA relationships to gauge the overall trend. Note that I am not considering the price bars at all, and I certainly am not using these EMAs to mark support or resistance. The trend is up when the 21-day EMA is above both the 63-day EMA and the 63-day EMA is above the 126-day EMA. An uptrend starts when the two shorter EMAs move above their longer EMAs. A downtrend starts when the two shorter EMAs move below their longer EMAs.
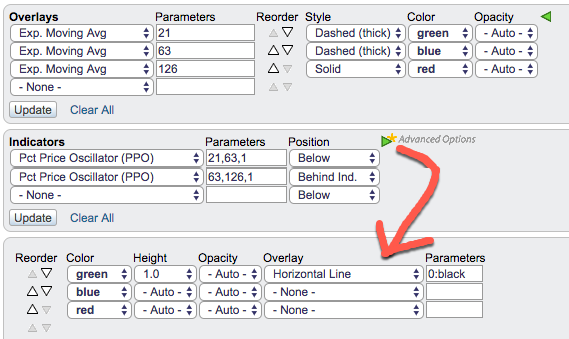
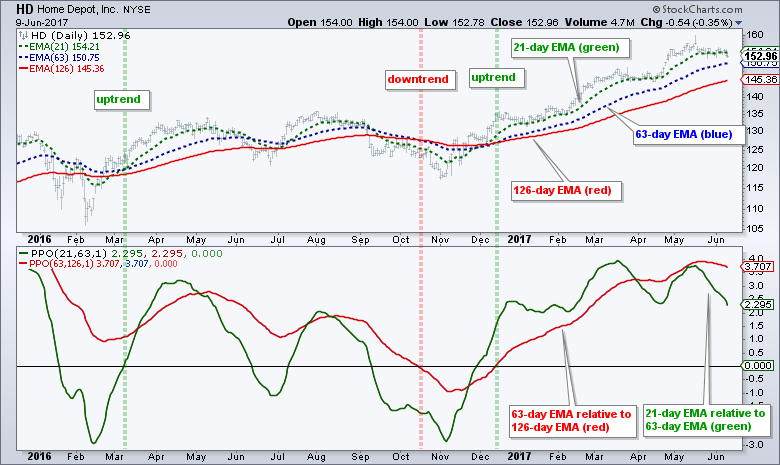 The chart above shows Home Depot (HD) with these three EMAs and three Percentage Price Oscillators (PPO) representing the EMA relationships. The PPO(21,63,1) is positive when the 21-day EMA is above the 63-day EMA and negative otherwise. The PPO(63,126,1) is positive when the 63-day EMA is above the 126-day EMA. I am not concerned with divergences or direction. I am only focused on the zero line to determine when these PPOs are positive and negative. The image below shows the SharpCharts settings. You can read more about the PPO in our ChartSchool article.
Measuring Trend Strength
The Stochastic Oscillator is not your typical trend indicator, but it works quite well when using a long lookback period. As such, I expanded the timeframe to measure the six-month range (126 days). The Fast Stochastic Oscillator measures the closing price relative to the high-low range over a lookback period. Thus, the full Stochastic Oscillator (126,5,1), which is smoothed, would be a 5-period SMA of the 126-day Fast Stochastic Oscillator. There is more about the Stochastic Oscillator in our ChartSchool.
Chartists can measure the strength of the trend by analyzing the Full Stochastic Oscillator (126,5,1) because this indicator holds above 70 during strong and steady uptrends. Put another way, the stock is in the top 30% of its range when the Stochastic Oscillator is above 70. In general, the cup is half full when the Stochastic Oscillator is above 50, which means the current price is in the top half of its six month range. Thus, the cup is half empty when the Stochastic Oscillator is below 50, and a strong downtrend would exist when the Stochastic Oscillator is below 30.
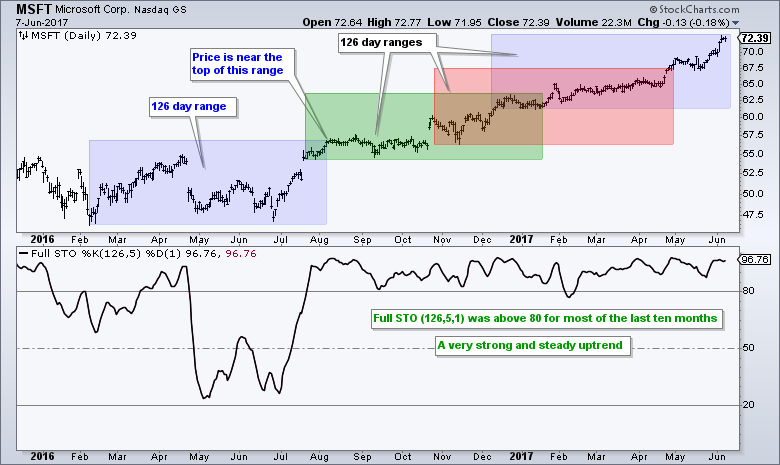
The chart above shows Microsoft (MSFT) with a strong uptrend from August to June because the Full STO (126,5,1) was above 80 almost the entire time. The shaded areas show the high-low range for four different 126-day periods. Notice that prices finished near the top of their range in each period.
Focus on a Failure
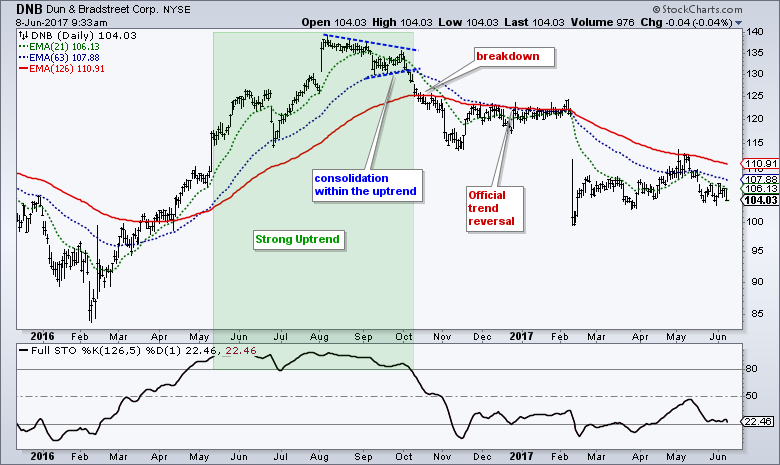
The indicator pairing is designed to measure trend direction with the EMA relationships and trend strength with the Stochastic Oscillator. It seems logical enough and there are plenty of good examples. However, there are also plenty of failures and examples that did not work out well. The trend is your friend until it ends. The chart below shows Dun & Bradstreet (DNB) with a strong uptrend from mid May to early October and a bullish consolidation (triangle). Instead of breaking out to the upside and continuing higher, DNB broke to the downside and the trend reversed in December.
Strong Uptrend Scan Code
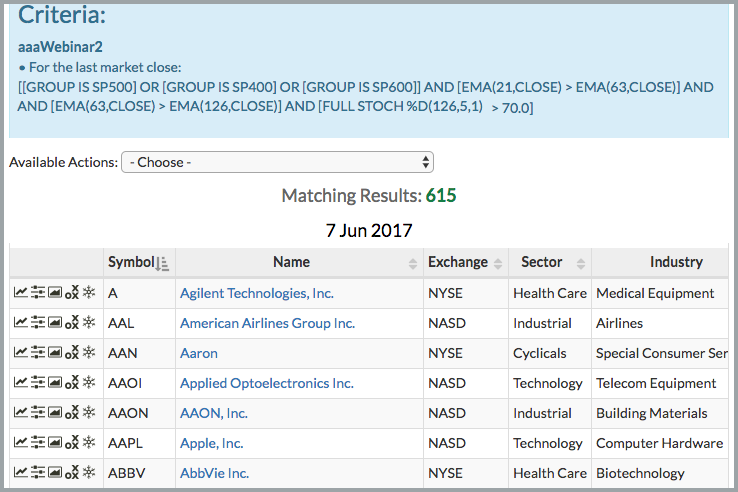
Chartists can find stocks in uptrends by scanning the S&P 1500 for stocks that have clear uptrends and a Stochastic Oscillator above 70. The settings for these indicators and the scan are your choice. Chartists looking for stronger trends can set the Stochastic level to 80, while chartists looking for a broad trend bias can set it at 50. I also added a volume requirement to filter out stocks with low Dollar volume. Chartists can also consider adding a short-term oversold requirement to find stocks with 10-day RSI below 40.
// set stock universe
[[group is SP500] or [group is SP400] or [group is SP600]]// insure daily Dollar Volume is greater than $5 million
AND [SMA(20,close) * SMA(250,volume) > 5000000 ]// EMA ribbon is positive for an uptrend
AND [EMA(21,close) > EMA(63,close)]
AND [EMA(63,close) > EMA(126,close)]// 126-day Stoch is above 70 for a strong uptrend
AND [Full Stoch %D(126,5,1) > 70.0]// RSI is near oversold
AND [RSI(10) < 40]
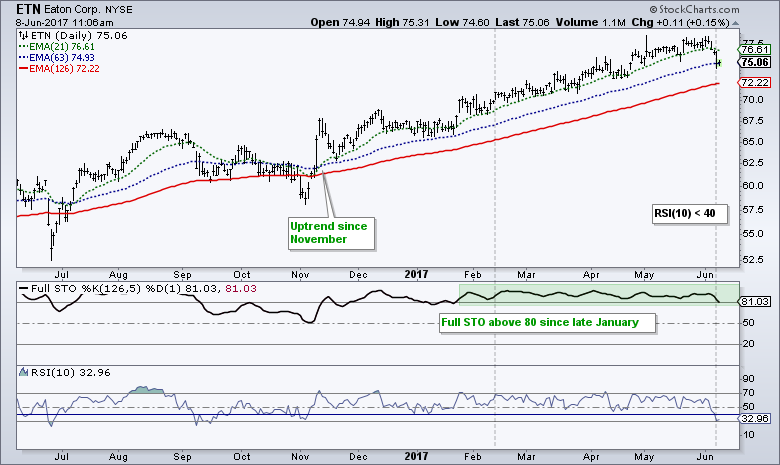
The chart below shows one of the stocks that made the scan cut. ETN is short-term oversold after a pullback to 75 and still in a strong uptrend.
Current State of the Market
At present, there are more stocks in strong uptrends than strong downtrends. I ran the scan above without the minimum Dollar volume requirement. 615 (41%) are in strong uptrends and 378 (25.2%) are in strong downtrends. There are clearly more stocks in uptrends and this favors the current bull market environment.
 I went through some charts in the S&P 500 and found at least 20 stocks with strong uptrends. These include: AMAT, AME, CSX, GD, GLW, HD, ITW, KLAC, LRCX, LUV, MA, MCHP, MPC, MSFT, MU, PCLN, ROK, RSG , RTN, SYMC, TXN, UNH, V, and WDC. This list packed with semiconductor stocks (six).
On the bearish side, we have EMR, ADM, IBM and KR.
******************************************************
Thanks for tuning in and have a good day!
--Arthur Hill CMT
Plan your Trade and Trade your Plan
******************************************************
Other Articles in the SystemTrader Series:
- Introduction to Key Performance Metrics - Quantifying the Golden Cross for the S&P 500
- Golden Cross and 5 Major Indexes - EMAs versus SMAs - Do Short Positions Add Value?
- Setting up Momentum Scans, Creating ChartLists and Exporting Lists. - Differences in Major Indexes - Do Trend Filters Work?
- MACD Crosses - Rules to Reduce Drawdowns and Increase Gains - Testing PPO Strategy
Follow me on Twitter @arthurhill - Keep up with my 140 character commentaries.


