.... Another Mean-Reversion Setup for IJR and MDY
.... Crude and XES Get a Divorce
.... XES Tests June-July Lows
.... Interview with Tobias Levkovich
.... Lazard Hits Support after Pullback
.... Watts Water Technologies Turns Up
.... Analog Devices Consolidates within Uptrend
.... Qorvo Reveres Near Rising EMA
.... Two For the Road (CPSI and HLT) ....
Another Mean-Reversion Setup for IJR and MDY
Small-caps and mid-caps continue to lag large-caps. Before looking at the S&P SmallCap iShares (IJR), note that the S&P 500 SPDR (SPY) hit another 52-week high on Monday and we are still in a bull market. IJR, in contrast, pulled back over the last two weeks, but triggered a short-term bullish signal using the RSI(5) mean-reversion strategy. You can read all the details in this System Trader article. In bull market environments, the system goes long when RSI(5) moves above 30 and exits when the ETF closes below the Chandelier Exit (22,1).
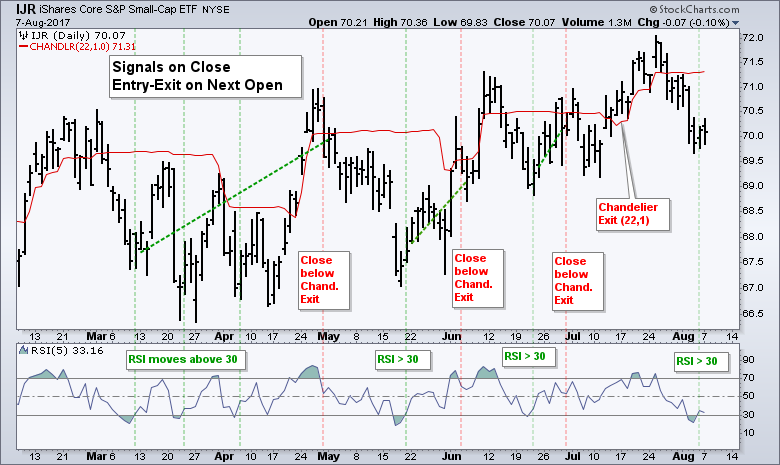
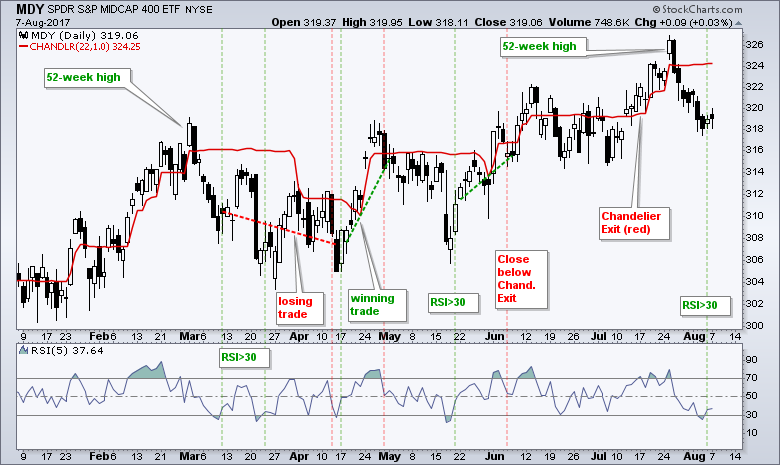
IJR triggered bullish on Friday, August 4th, when RSI moved above 30. The ETF is still below the Chandelier Exit and this means an exit signal has yet to materialize. The system will simply wait until IJR closes above the Chandelier Exit and an exit signal will trigger when IJR closes back below the Chandelier Exit. Note that signals are based on closing prices and actual trades take place on the next open. MDY also has a mean-reversion setup working. Note that these systems do not care about earnings, valuations, extended trends or even the Fed!
Crude and XES Get a Divorce
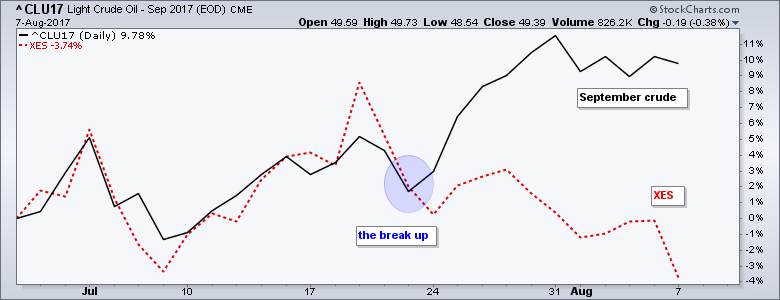
The Oil & Gas Equip & Services SPDR (XES) is "interesting" because it has moved counter to oil since July 24. The chart shows the performance lines for September Crude (black) and XES (red). Crude is up sharply over the last two weeks and XES is down. I am not sure what is causing this, but I would not expect it to last much longer. Either crude comes back down to validate XES or XES rebounds to validate crude.
XES Tests June-July Lows
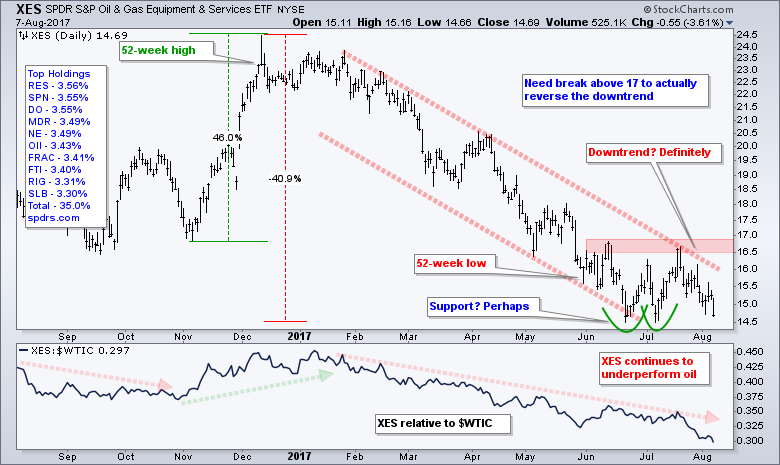
There is not much to like about the XES chart as the ETF fell over 3% on Monday to test the June-July lows in the 14.5 area. The overall trend is clearly down with resistance marked in the 16.5-17 area. Perhaps the 14.5 area will mark support. Chartist looking for a bottom might watch for some sort of hammer to form in this area and then a gap up. The indicator window shows XES relative to Light Crude Continuous Contract ($WTIC). This ratio hit a new low as XES continues to underperform its lifeblood.
Interview with Tobias Levkovich
This link (here) is to a short interview on Trading Nation with Tobias Levkovich of Citigroup. He covers the energy sector, rig counts and historical valuations.
And for those interested, here is a link to Rotary Rig Counts. This site is maintained from London ....... Arkansas, that is. Never knew about London, Arkansas, but I am familiar with Paris, Texas.
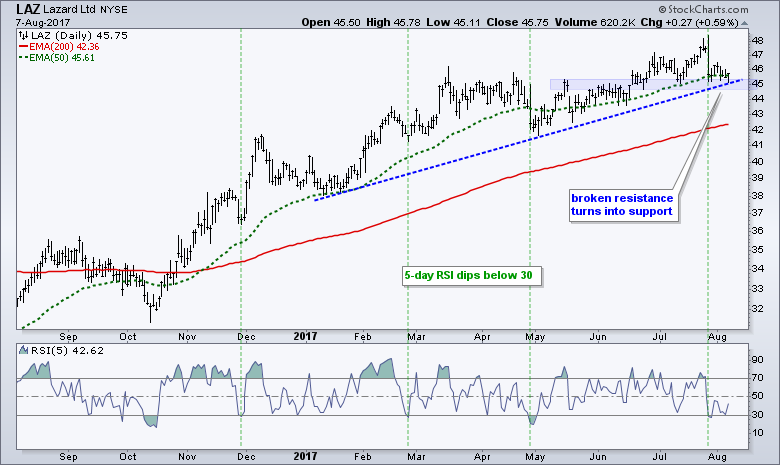
Lazard Hits Support after Pullback
The Finance SPDR (XLF) is leading the market with a new high on Friday and the Technology SPDR (XLK) is not far behind because it is around .50% from a 52-week high. It is hard to be negative on stocks with finance and technology so close to new highs. The chart below shows Lazard (LZ) within a steady uptrend since December. The stock was hit hard on July 27th and this pushed RSI(5) below 30 for the fourth time since the 50-day EMA crossed above the 200-day EMA. In addition to a short-term oversold condition, the stock is trading near support from broken resistance and the July lows.
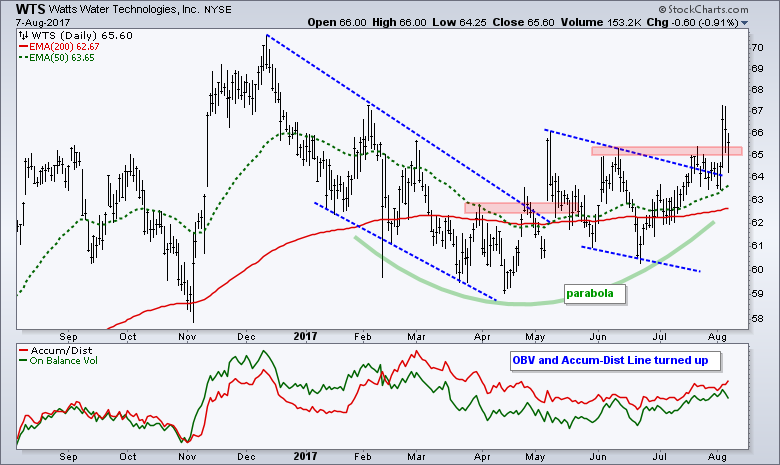
Watts Water Technologies Turns Up
WTS looks like it has ended its correction with a pair of wedge breakouts and resistance breaks. The stock corrected pretty hard in March-April as the 50-day EMA dipped below the 200-day EMA for two weeks. Instead of a meltdown, the stock found support in the 60 area and turned up from April to June. The most recent breakout occurred near 65.
Analog Devices Consolidates within Uptrend
ADI is in a clear uptrend with a 52-week high in May and the 50-day EMA above the 200-day EMA. I took the liberty of drawing a trend line that cuts through the spike high in late May. Technically, this is called an "internal" trend line. I don't have a problem with it because I think the pattern since March is a consolidation of some sort. There is a clear resistance level in the 82.5 area and a breakout here would be bullish.
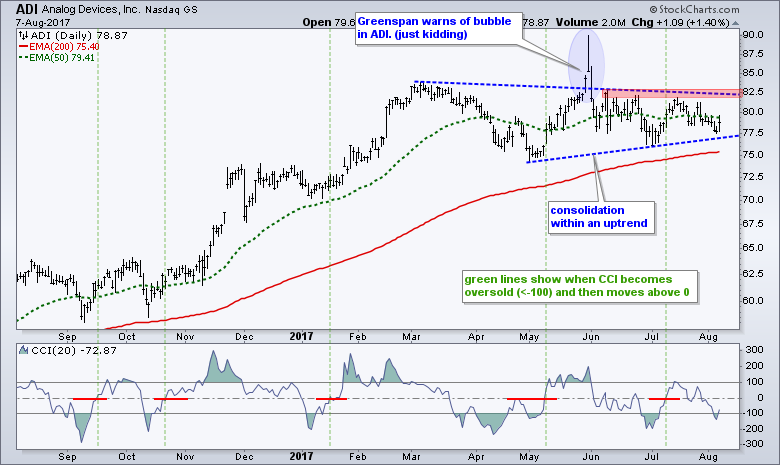
The indicator window shows the 20-day Commodity Channel Index (CCI), which works similar to RSI. The indicator becomes oversold with a move below -100 and turns up with a move above the zero line. I marked the last five occurrences with green lines. Look for a CCI move above zero to signal an upturn in prices.
Qorvo Reveres Near Rising EMA
QRVO highlights a challenge with technical analysis. It appeared as if the stock broke support in late June with a high volume decline. This certainly seemed bearish, but the support break did not hold. Instead, the stock reversed at the 61.8% retracement and moved back above the 200-day EMA. Lessons here: there are no absolutes in technical analysis and high volume declines are not always bearish. Keep the bigger picture and bigger trend in mind.
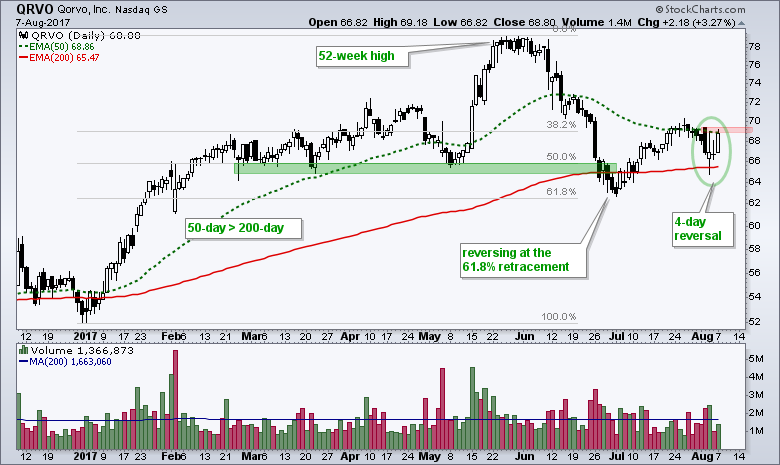
The stock fell back last week, but forged a four day reversal with a long black candlestick, a spinning top, a doji and a long white candlestick. The spinning top and the doji represent indecision after the long black candlestick, which shows strong selling pressure. The long white candlestick represents a reversal after indecision. Look for follow through above the high of the long black candlestick to complete the reversal.
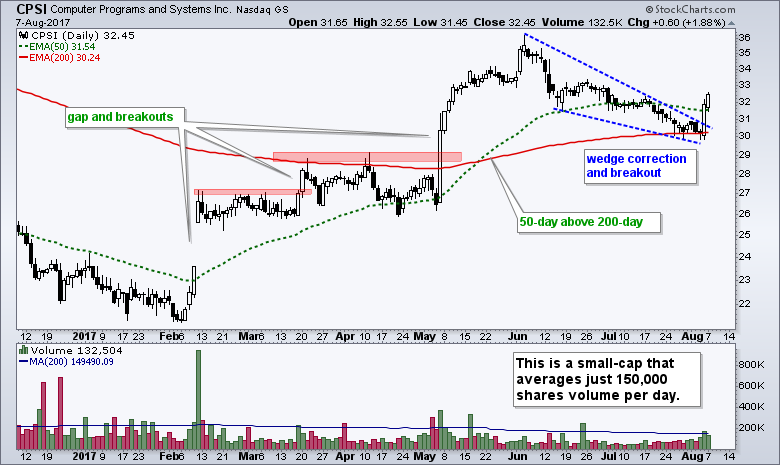
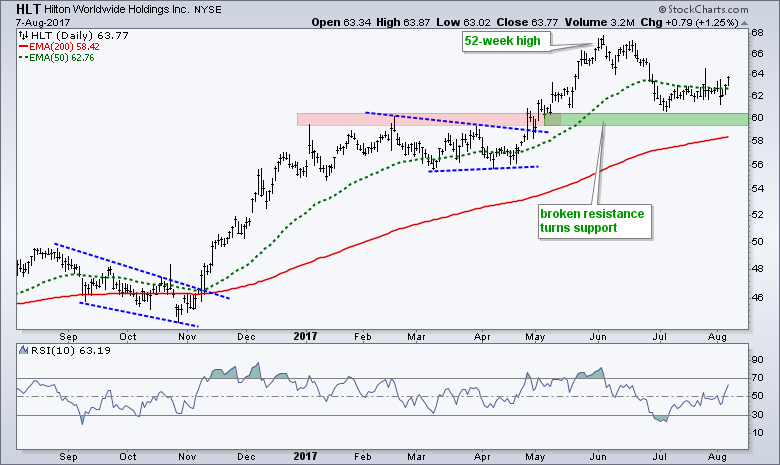
Two For the Road (CPSI and HLT)
******************************************************
ETF Master ChartPack - 300+ ETFs organized in a Master ChartList and in individual groups.
Follow me on Twitter @arthurhill - Keep up with my 140 character commentaries.
****************************************
Thanks for tuning in and have a good day!
--Arthur Hill CMT
Plan your Trade and Trade your Plan
*****************************************


