.... Small-caps Lead Five Day Bounce
.... Stocks are Underperforming Bonds in August
.... Four Inside Days and No Follow Thru
.... Chandelier Exit Falls for IJR
.... 10 Stocks and A Mixed Bag over the Past Week
.... Amazon and Google Tests Support as Facebook Corrects
.... Intel Lags in 2017
.... Discover Financial Breaks Wedge Line
.... Dr. Pepper Snapple Tests Triangle Support ....
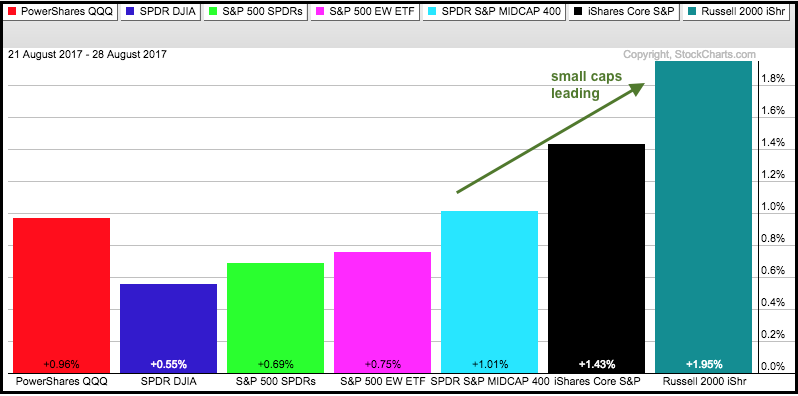
Small-caps Lead Five Day Bounce
Stocks got a nice bounce the last five days with small-caps leading the way. The PerfChart below shows five-day performance for seven major index ETFs (from last Tuesday's surge to yesterday's close). The S&P 500 SPDR (SPY) is up around .70%, but the S&P SmallCap iShares (IJR) is up 1.43% and the Russell 2000 iShares (IWM) is up almost 2%. One week, however, is not enough to reverse eight months of underperformance. Small-caps fared the worst during the decline from 25-Jul to 18-Aug and they have the most to recover. Perhaps the bigger story here is relative weakness in SPY because it did not follow through on last Tuesday's surge.
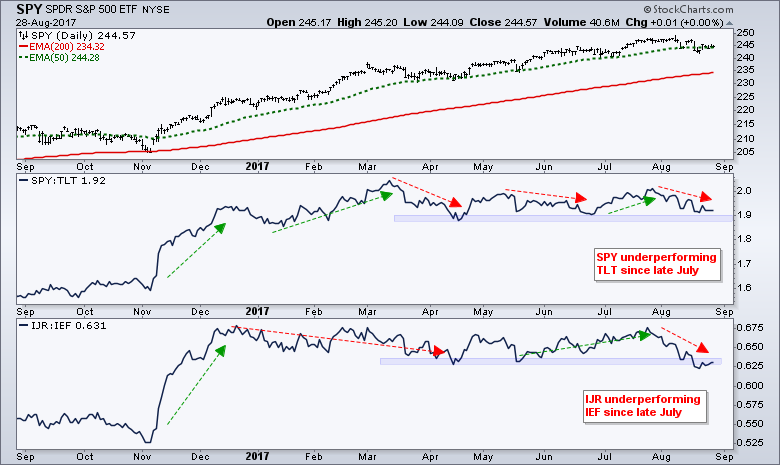
Stocks are Underperforming Bonds in August
From a risk on/off point of view, I would be concerned with relative weakness in the stock bond ratios. The chart below shows SPY, the SPY:TLT ratio and the IJR:IEF ratio. I matched SPY with the 20+ YR T-Bond ETF (TLT) and IJR with the 7-10 YR T-Bond ETF (IEF). The SPY:TLT ratio has been flat since March with small swings up and down (green/red arrows). The current swing is down as SPY underperforms TLT. This shows a preference for safety because TLT is outperforming SPY. I am seeing the same thing with the IJR:IEF ratio. A sustainable bounce in stocks is unlikely as long as they are underperforming bonds.
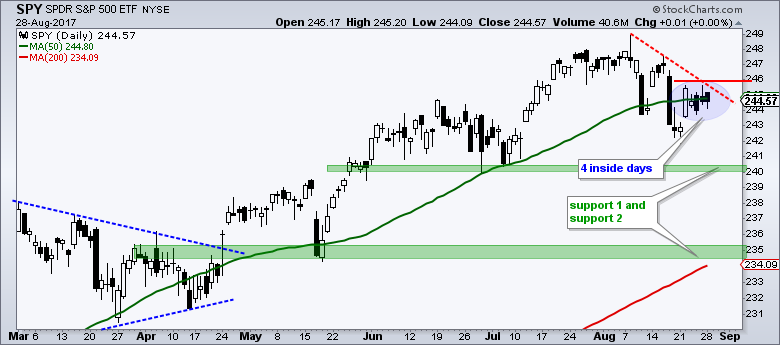
Four Inside Days and No Follow Thru
SPY surged last Tuesday and formed a morning star reversal (long black candlestick, two indecisive days in the star position and a long white candlestick). SPY closed back above the 50-day EMA with the surge last Tuesday, but immediately fell back below the 50-day and stalled for four days. We now have four inside days that show indecision and lack of follow through. A breakout at 246 is needed to fully reverse the short-term downtrend. A move below 243.5 would start filling the gap and argue for a deeper pullback. First support is set in the 240 area and second support is set in the 235 area.
Chandelier Exit Falls for IJR
I will follow up on the IJR mean-reversion trade to show how the Chandelier Exit works on a failing trade. As this System Trader article explains, the system buys when RSI(5) moves above 30 and sells when price closes below the Chandelier Exit. IJR also forged a four candle morning star and then followed thru with further gains the last three days. RSI(5) moved above 30 for the third time and even exceeded 50 for a short-term momentum breakout.
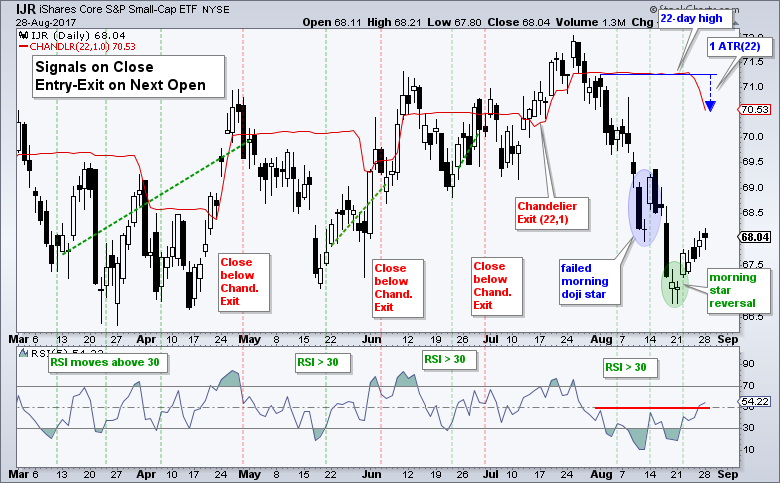
The red line shows the Chandelier Exit falling over the last few days because the 22-day high is now lower and the Chandelier Exit is one ATR(22) value below this high. The exit will fall further when the 22-day high falls, which happens in a downtrend. According to the system, an exit signal will not trigger until IJR moves above the Chandelier Exit and then closes back below it.
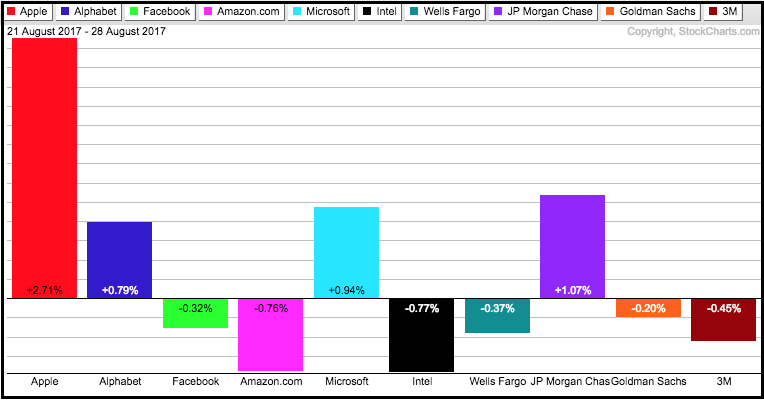
A Mixed Bag over the Past Week
The PerfChart below shows the performance for ten large-cap stocks over the last five trading days. Apple is clearly leading QQQ with a 2.71% gain. Alphabet (GOOGL) and Microsoft (MSFT) are helping with modest gains, but Facebook (FB), Amazon (AMZN) and Intel (INTC) are down (lagging). Among the non-tech stocks, Wells Fargo (WFC), Goldman Sachs (GS) and 3M (MMM) are lagging with losses. JP Morgan (JPM) is up around 1% and showing relative strength.
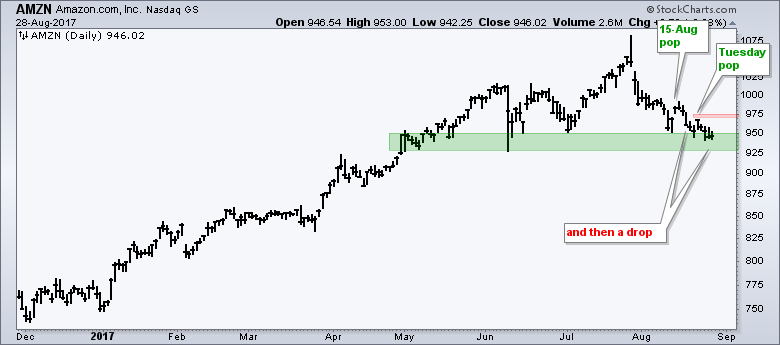
Amazon and Google Tests Support as Facebook Corrects
The first chart shows AMZN with two pops and two drops. The long-term trend is up and this is still viewed as a correction, but two failed bounces suggest that the correction has yet to run its course. AMZN is currently at a support level and chartists should watch 975 for an upside breakout.
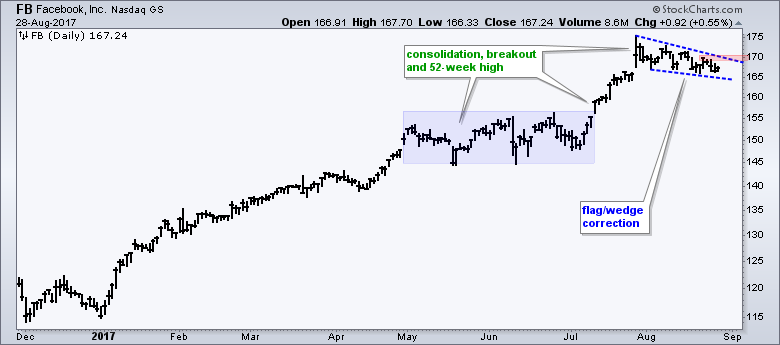
Facebook surged in July and then corrected with a falling wedge the last four weeks. This is a pretty mild correction, but the pullback in Facebook jibes with the current pullback in the broader market. Look for a break above 170 to end the correction and signal a continuation higher.
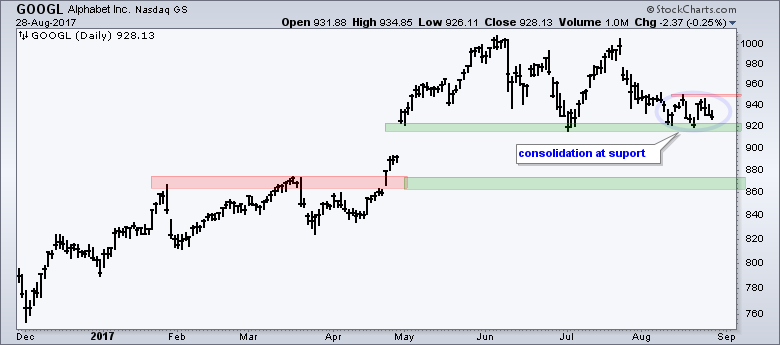
Alphabet (GOOGL) looks a bit like Amazon with the gap down in late July and sharp pullback. GOOGL is finding support near 920 with a consolidation the last two week (blue oval). A break low the consolidation lows would signal a continuation lower and target a move to the 860-870 area. As long as support holds, watch for a break above 950 for a bullish signal.
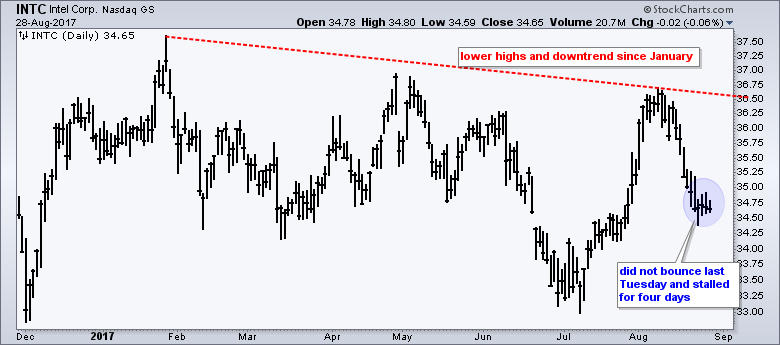
Intel Lags in 2017
Intel (INTC) surged from mid July to early August, but did not take out the April-May highs and turned south the last few weeks. The trend sine January is down with a serious of lower highs and lower lows. Note that Intel did not surge with the rest of the market last Tuesday and stalled the last four days. A break below 34.50 would signal a continuation lower.
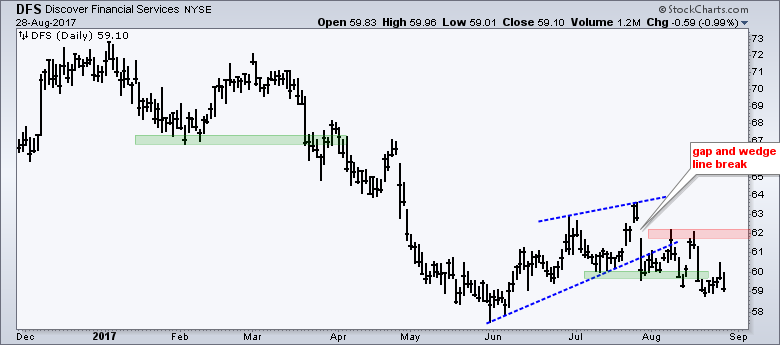
Discover Breaks Wedge Line
Discover Financial (DFS) is one of the weakest stocks in the finance sector this year with a 16.6% year-to-date loss. It looks like the stock is headed even lower after the gap and wedge line break. Also notice that the stock broke the July lows in August.
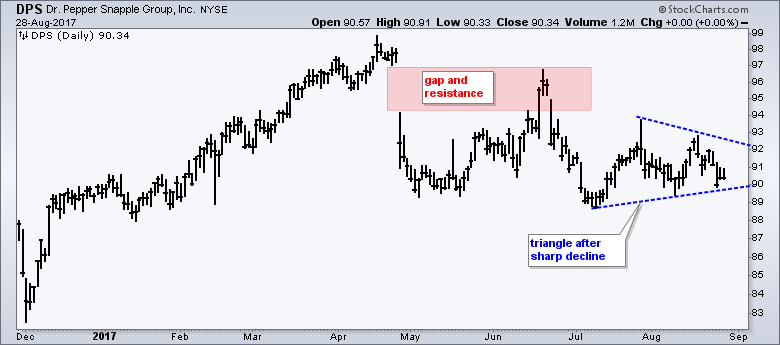
Dr. Pepper Snapple Tests Triangle Support
The next chart shows DPS with a gap and sharp decline in April, a rebound to the gap highs in June and then a plunge back to the 90s. The stock has since formed a triangle consolidation and this looks like a bearish continuation pattern. A breakdown would signal a continuation lower and target a move to the mid 80s.
******************************************************
ETF Master ChartPack - 300+ ETFs organized in a Master ChartList and in individual groups.
Follow me on Twitter @arthurhill - Keep up with my 140 character commentaries.
****************************************
Thanks for tuning in and have a good day!
--Arthur Hill CMT
Plan your Trade and Trade your Plan
*****************************************


