 |
.... Volatile, but not that Volatile .... When Does Volatility Become a Problem? .... SPY and QQQ Correct with Flag Patterns .... IJR Hits Prior Reversal Zone .... Bull Flags working in XLI, XLV, XLF and XLB .... XLY Toys with Double Top Support .... EW Consumer Discretionary ETF Breaks Down .... Consumer Staples Break Down .... Bottom Fishing in Energy .... Chevron Holds up the Best .... XES Tests 2016 Lows .... Oil Breaks Rising Channel .... Keep Calm and Trade Long (two vids) .... TLT Extends on Triangle Breakout .... Gold Stalls near Prior Peaks .... Dollar Stalls within Downtrend .... |
----- Art's Charts ChartList (updated 25-August) -----
Volatile, but not that Volatile
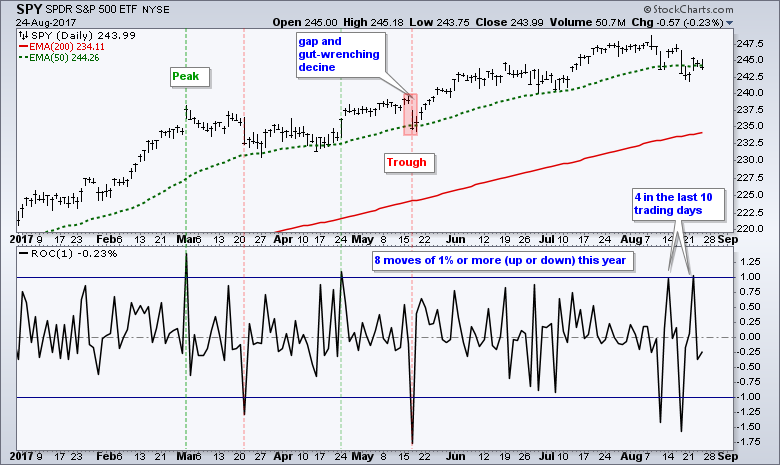
The S&P 500 has moved 1% or more eight times this year and four of those moves occurred in August (counting the .99% gain on August 14th). Actually, these four moves occurred over the last ten trading days. Thus, August is proving to be the most volatile month of the year so far. SPY was hit with two outsized declines on August 9th and August 17th, but the ETF rebounded each time and is still around 2% from an all time high and above its July low. An outsized decline is just a decline that is larger than recent declines.
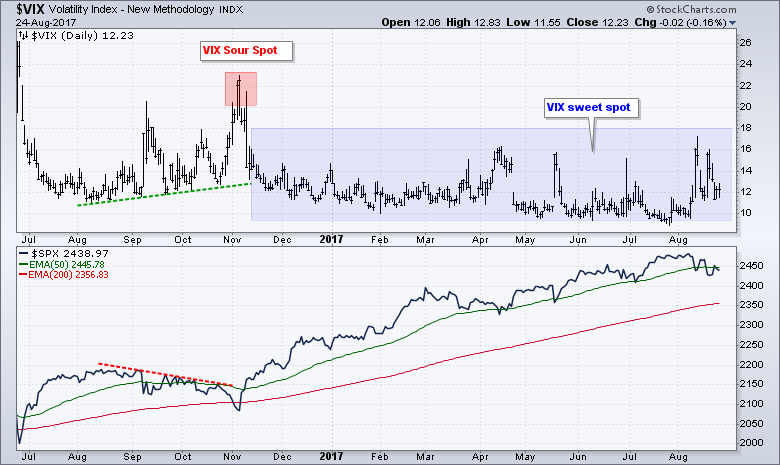
The next chart shows the S&P 500 Volatility Index ($VIX) ranging from 9 to 18 since 9-November-2016. This is a volatility sweet spot of sorts and shows that volatility in August remains largely in line with what has been tolerated during this uptrend. This sweet zone sours when the VIX exceeds 20 (red zone) and stays above 20.
When Does Volatility Become a Problem?
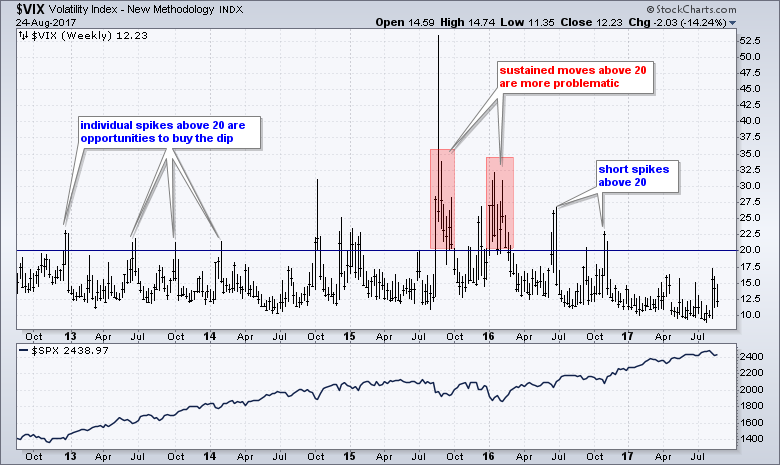
Frankly speaking, the S&P 500 Volatility Index ($VIX) is a coincident indicator that is best used for trading the spikes (buy the dip in SPY). A short spike above 20 shows extreme fear in the market and this occurs during a sharp dip in the S&P 500. The trouble starts when and if the VIX moves above 20 and stays above 20. This occurred from mid August to late September 2015 and from January to mid February 2016 (red zones).
Bottom Line: Current volatility is not volatile enough to be problematic for the S&P 500, which is my proxy for "the stock market". Volatility becomes a problem when the VIX surges above 20 and remains above 20. For whatever reason, volatility tends to pick up in August and the seasonal patterns are weak from mid August to September. Throw in a debt ceiling debate and the combination could lead to some choppy price action in the coming weeks. Nevertheless, the long-term trend for the S&P 500 is clearly up and I still view pullbacks as mere corrections within that uptrend.
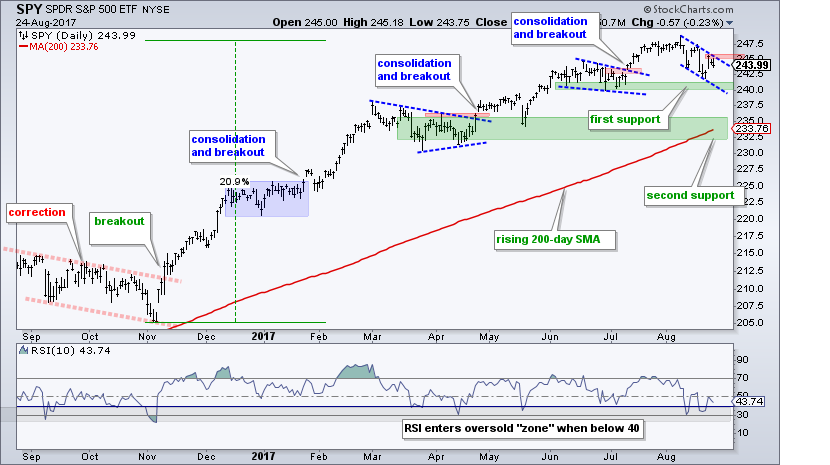
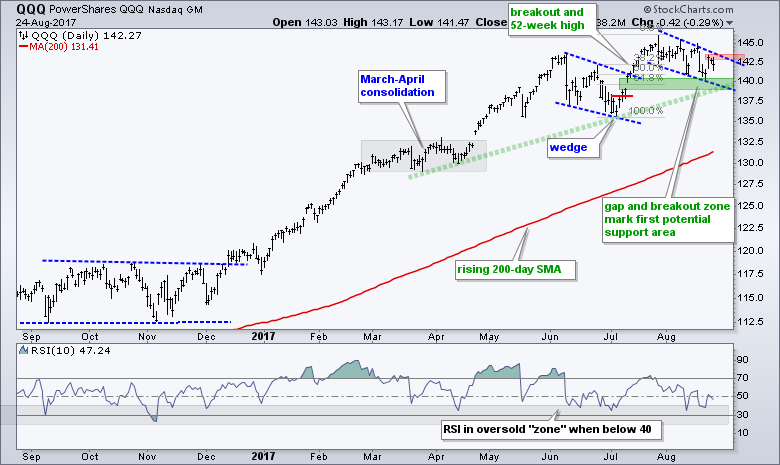
SPY and QQQ Correct with Flag Patterns
QQQ hit a 52-week high in late July and SPY hit a 52-week high in early August. Both have since corrected with zigzags lower and the overall patterns looks like falling flags, which are short-term bullish continuation patterns. These flags represent MILD corrections and they reverse with an upside breakout. QQQ and SPY gapped up on Tuesday and surged over 1%. Both fell back on Wednesday-Thursday, but the gaps are holding for the most part. Look for a move above Tuesday's highs to break flag resistance and reverse the short-term downtrends.
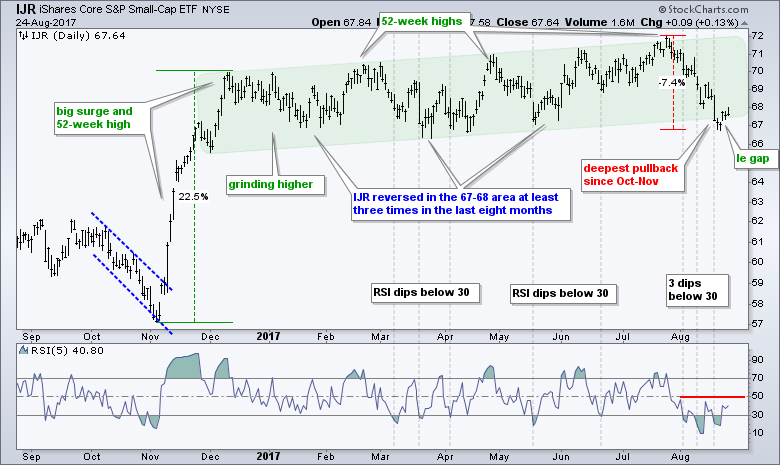
IJR Hits Prior Reversal Zone
The S&P SmallCap iShares (IJR) suffered its deepest pullback since last year (Sep-Nov) with a 7.4% decline to the 67-68 area. I still think the overall trend is up because IJR recorded a string of 52-week highs from December to July. There is also a case to be made for support in the 67-68 area because the ETF bounced off this zone in January-February, March-April and May-June. The first attempt at a bounce can be seen with Tuesday's gap, for which I am using a French term (Le Gap). Sorry, just had a Pulp Fiction flashback. Chartists can watch this gap to see if it holds. As far as a little follow through is concerned, RSI dipped below 30 three times and has been below 50 the entire month. Look for a move above 50 to trigger a short-term momentum breakout.
Bull Flags working in XLI, XLV, XLF and XLB
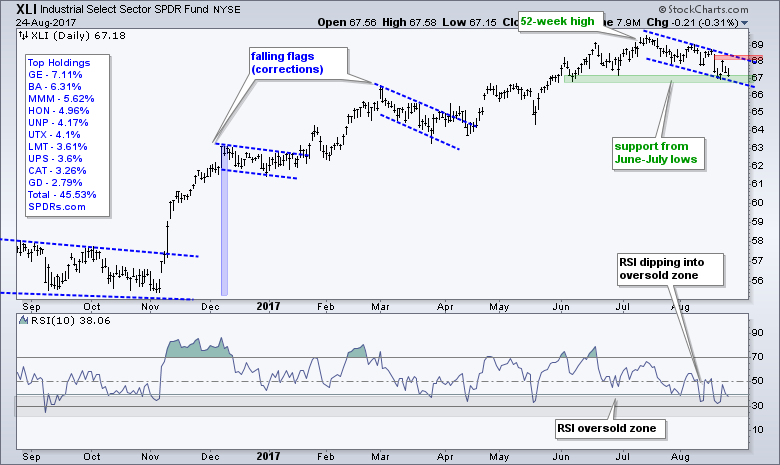
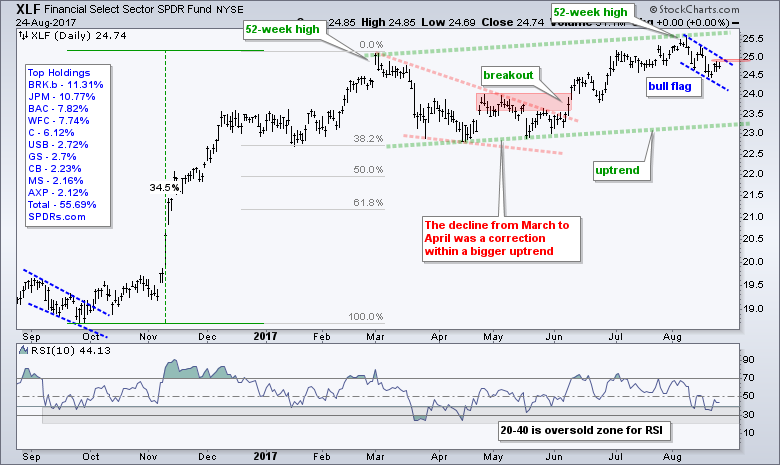
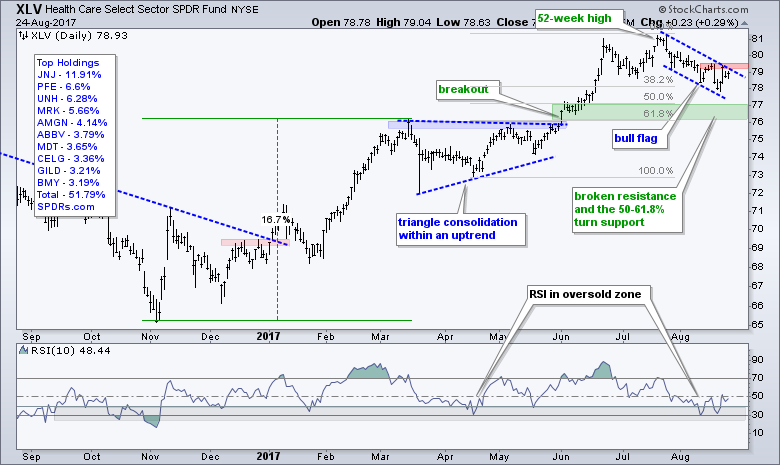
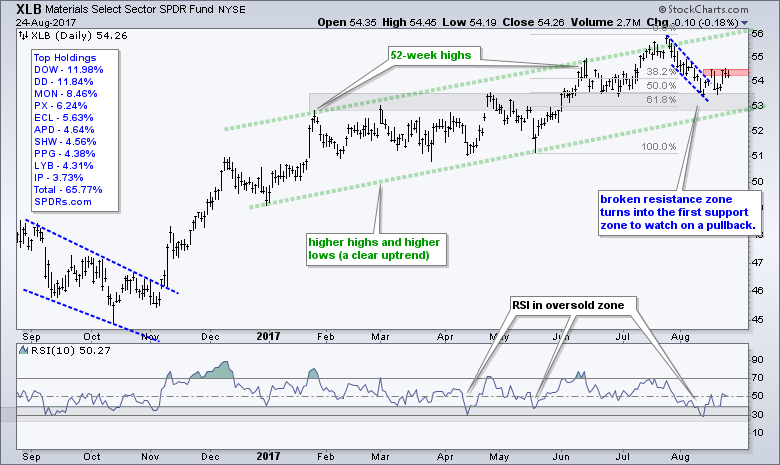
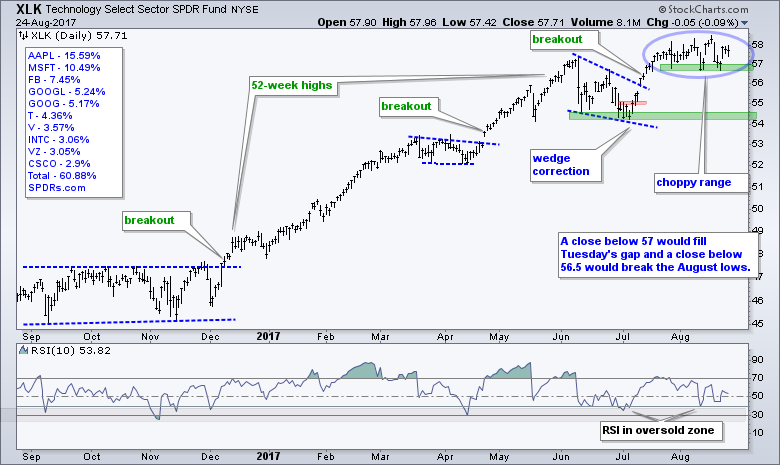
There are bull flag patterns taking shape in the Finance SPDR (XLF), the Industrials SPDR (XLI) and HealthCare SPDR (XLV). Meanwhile, the Materials SPDR (XLB) is trying to make good on its flag breakout and the Technology SPDR (XLK) is stalling with a flat consolidation. Keep in mind that all five of these sector SPDRs hit 52-week highs within the last six weeks. XLI recorded a 52-week high on July 14th (six weeks ago) and XLK recorded a 52-week high on August 16th (six days ago). Thus, industrials have been correcting the longest and technology is one of the leaders. Nevertheless, the patterns are all similar because they are consolidations or pullbacks within bigger uptrends. The path of least resistance is up when the bigger trend is up and this means I am focused on short-term bullish setups. The red zones on the far right of the charts mark short-term resistance levels to watch for upside breakouts.
The first three charts show falling flags in XLI, XLF and XLV. These three sectors account for around 39% of the S&P 500 and all three are in short-term downtrends (flags). Breakouts in two of the three would be bullish for the broader market.
XLB broke out of its flag with a surge last week, fell back and then bounced again on Tuesday. Look for a follow through move above 54.6 to keep this breakout alive.
The next chart shows XLK with a choppy consolidation that is moving sideways. Tuesday's gap is holding and the key levels to watch are shown on the chart.
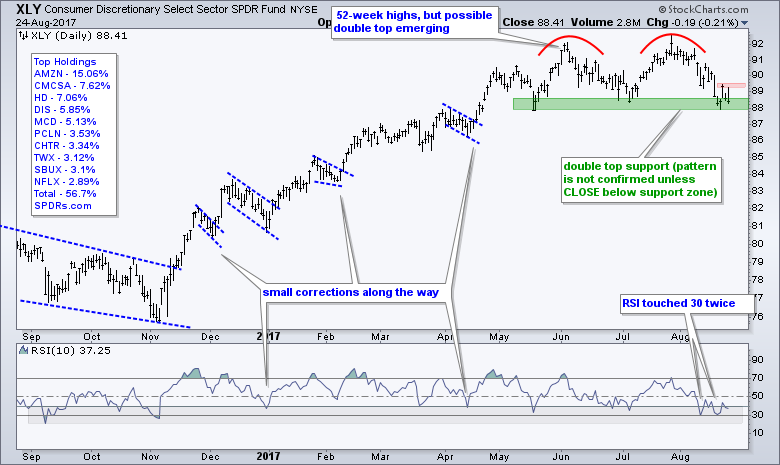
XLY Toys with Double Top Support
The Consumer Discretionary SPDR (XLY) remains with a potential double top and is currently trading right at support. A close below 88 would confirm the double top and weigh on the market. Conversely, a break above Tuesday's high would signal a successful support test and keep the uptrend alive. AMZN, the largest component, is trading at support and a break above 970 would be bullish.
Note that I covered several industry group ETFs in Thursday's commentary. These include the Cloud Computing ETF (SKYY), Internet ETF (FDN), Cyber Security ETF (HACK), Semiconductor iShares (SOXX), Biotech iShares (IBB), Biotech SPDR (XBI), Metals & Mining SPDR (XME), Steel ETF (SLX) and Silver ETF (SLV). I also highlighted six charts (AVGO, KLAC, GOOGL, NFLX, SYMC, BMY).
EW Consumer Discretionary ETF Break Down
The sector ETFs come in three flavors: large-cap, equal-weight and small-cap. Sometimes these three are on the same page, like utilities now, and sometimes they are not. The chart below shows the EW Consumer Discretionary ETF (RCD), the SmallCap Consumer Discretionary ETF (PSCD) and the Consumer Discretionary SPDR (XLY). Notice that the EW ETF (RCD) broke its spring and summer lows with the August decline. This shows relative chart weakness (blame retail).
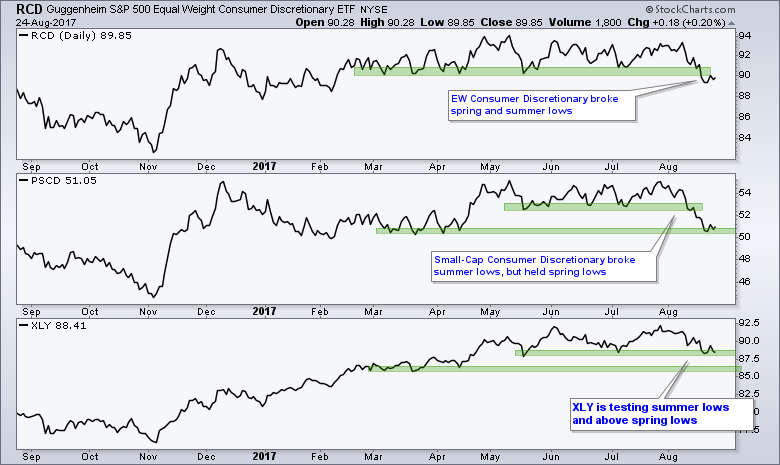
The small-cap ETF (PSCD) broke the summer lows, but held the spring lows with a small bounce the last few days. The large-cap ETF (XLY) is testing its summer lows and remains well above the spring lows. XLY is clearly holding the best and RCD is fairing the worst. It is negative to see the equal-weight version of the most economically sensitive sector breaking two support zones. Note that the consumer discretionary sector accounts for 12% of SPY and 15.6% of the EW S&P 500 ETF (RSP). In fact, it is the biggest sector in RSP and this helps explain relative weakness in RSP (versus SPY). Weakness in Regional Banks is also to blame.
EW Consumer Staples ETF Break Down
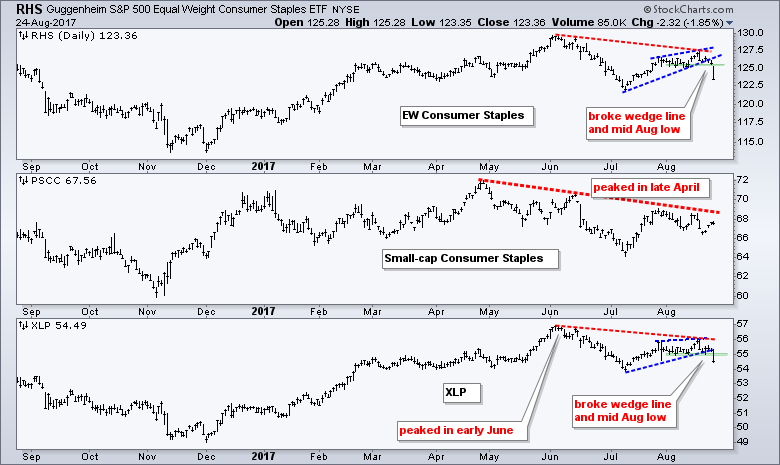
The next chart shows three versions for the consumer staples sector. The EW Consumer Staples ETF (RHS) peaked in early June, bounced with a rising wedge and broke wedge support with a sharp decline the last six days. This also means a lower high formed from June to August. The SmallCap Consumer Staples ETF (PSCC) peaked back in late April and has been lagging for months. The Consumer Staples SPDR (XLP) broke the wedge line and support with a sharp decline on Thursday. I noted weakness in the Staples %Above 200-day EMA (!GT200XLP) over the last two weeks and this is playing out on the price charts now.
Bottom Fishing in XLE
The Energy SPDR (XLE) sank to a 52-week low last week and then firmed with a small indecisive candlestick (so far this week). I am strained to find anything bullish on this chart, but I must admit that the urge to bottom pick is growing. The only reason I am considering this is because crude is trading in the upper 40s and there is still some demand out there for oil. Even though XLE fell around 20% from its December high to its August low, it remains well above the lows from January-February 2016. In fact, the current decline has retraced 50-61.8% of the prior advance. This 50-61.8% retracement zone represents a possible reversal zone for XLE.
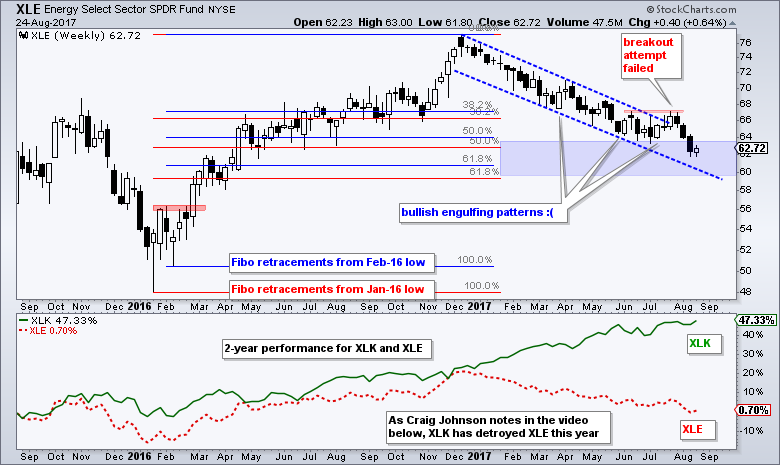
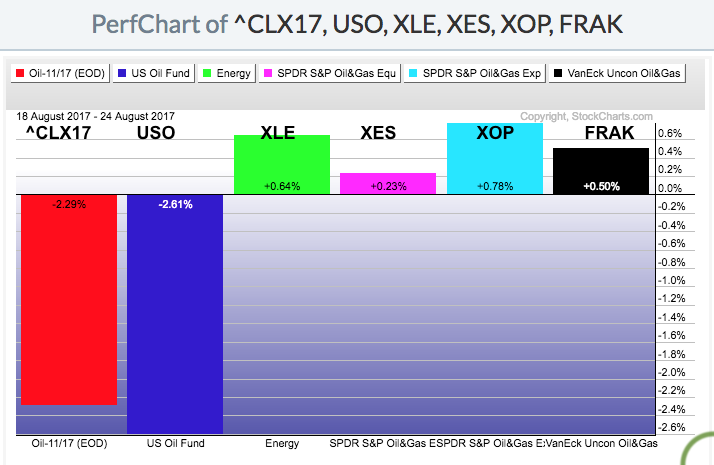
Keep in mind that the Fibonacci retracements and these reversal zones are not science. Charles Dow assumed that corrections within uptrends would typically retrace 1/3 to 2/3 of the prior advance with 50% representing the base case. Elliott Wave suggests that retracements can extend 38.2% to 61.8% because these are based on Fibonacci numbers. Truth be told, the reversal can happen anywhere between the 30% and 70% retracements. I just start looking for signs of a reversal when retracements near the 1/3 mark. Before leaving this chart, notice that XLE formed three weekly bullish engulfing patterns during this year's downtrend. None of them triggered a reversal. And finally, notice that USO and oil are down sharply this week, but four energy-related ETFs are up.
Chevron Holds up the Best
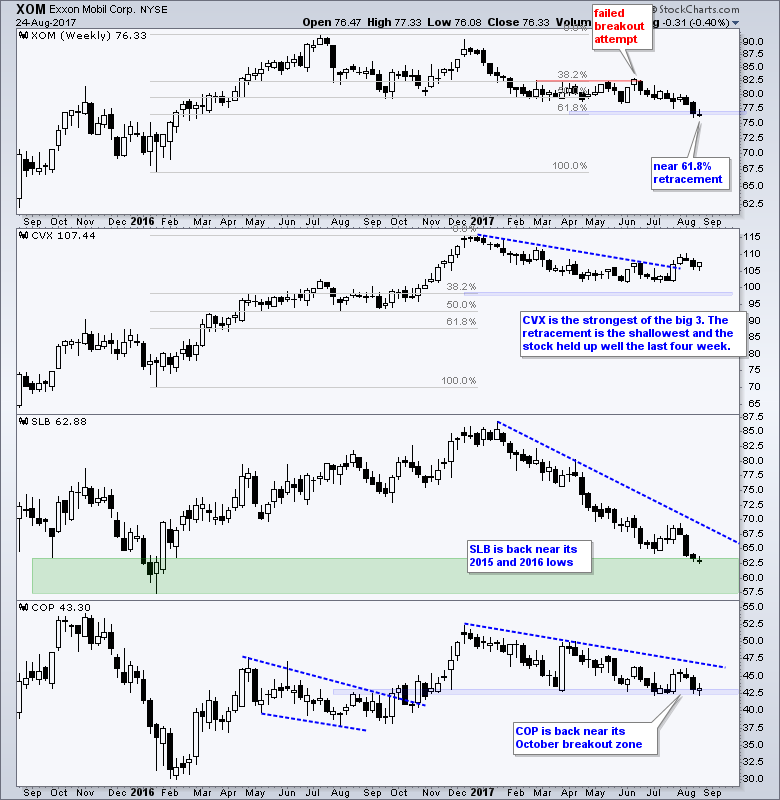
An ETF is only as good as its components and the sector SPDRs are only as good as their top components. Notice that ExxonMobil, Chevron and Schlumberger account for almost 50% of XLE. Throw in COP and the top four account for just over 50%. The next chart shows these four with some annotations for analysis.
XES Tests 2016 Lows
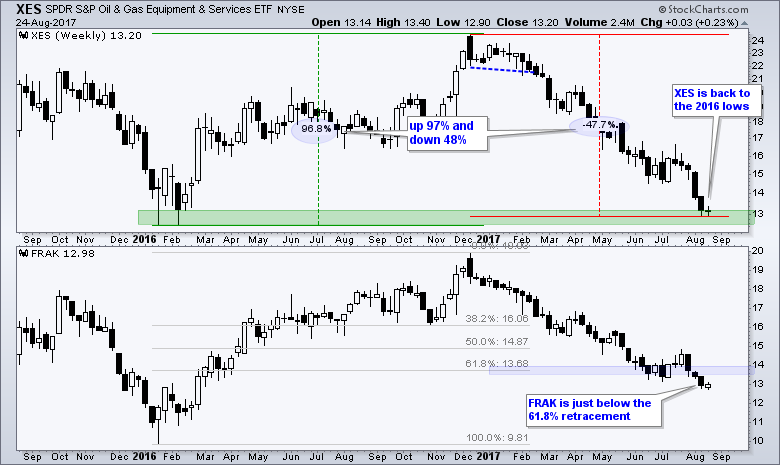
And finally, the Oil & Gas Equip & Services SPDR (XES) did a round trip from 13 to 24 and back to 13. Notice that the ETF advanced around 97% and then fell around 48% during the trip. There may be support here for bottom pickers. Be careful because these lows are unlikely to hold if oil moves to the low 40s.
Oil Breaks Rising Channel
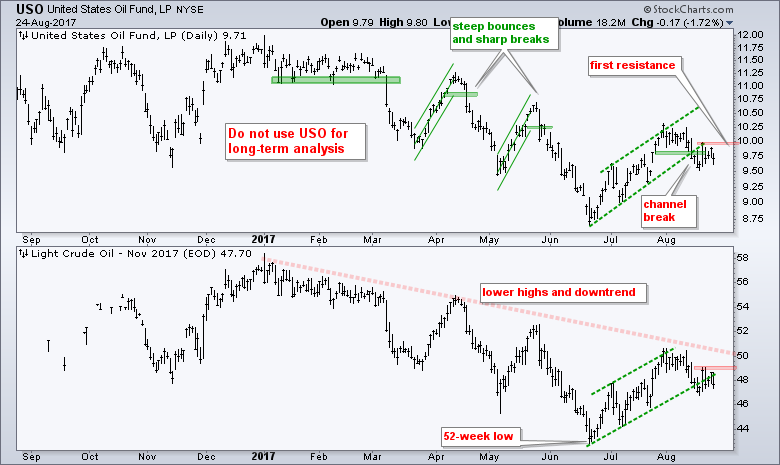
Note that I am moving to November Crude (^CLX17) for oil analysis. You can find all the symbols for crude futures by searching for ^CL. There is no change in the long-term trend, which is clearly down with lower highs since January and a 52-week low in June. The bounce into early August reversed as USO broke below 9.75 and crude crossed below 48. These are the current signals in play and the red zones mark first resistance (USO at 10 and ^CLX17 at 49). Breakouts here would be positive for oil and could lift energy related stocks.
Keep Calm and Trade Long
Craig Johnson of Piper Jaffray discusses the fact that stocks have gone more than a year without a 5% pullback. Key Takeaway: Don't try to "overthink" the market at this point in time - around the 1:50 mark. Johnson also talks about the spread between XLK and XLE).
Gina Sanchez of Chantico Global and Phillip Streible of RJO Futures discuss the EEM ETF hitting a multi-year high on Thursday. My take: This clip is more fundamental than I like, but the long-term trend is clearly up for EEM and the weak Dollar is helping.
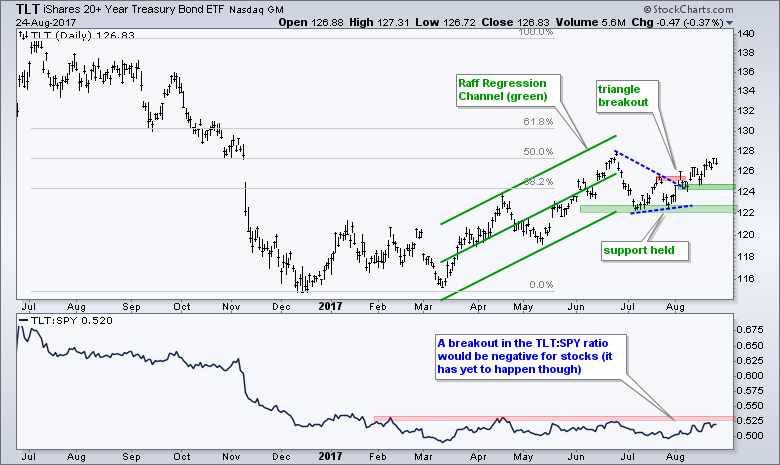
TLT Extends on Triangle Breakout
Yep, that is the same headline as last week. TLT broke out in early August and moved to another high for the month. The ETF is still below the June high, but the overall trend is clearly up for this bond benchmark. The breakout zone and the early-mid August lows mark first support at 124. While a break below this level would be negative, the full uptrend would not reverse unless TLT breaks 122.
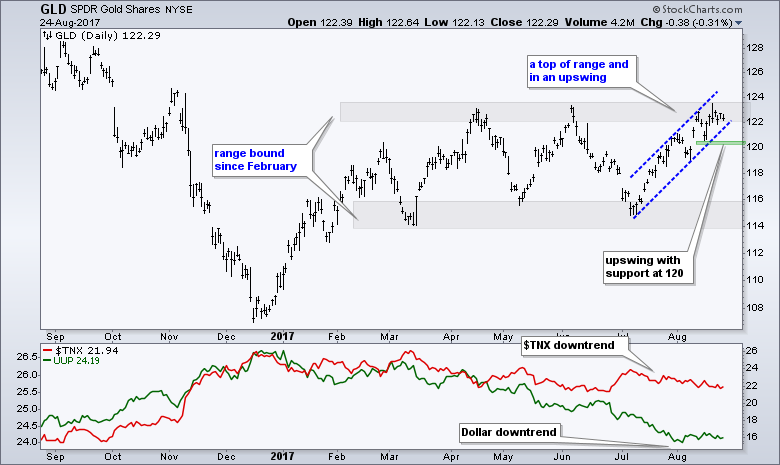
Gold Stalls near Prior Peaks
The Gold SPDR (GLD) surged from early July to mid August and then stalled around the 122-124 area. The ETF peaked in this area in April and June so we can consider this a resistance zone. Overall, the gray zones show that GLD remains in a trading range since February. The blue trend lines define the upswing within this range and the green zone mark upswing support at 120. A break here would affirm resistance and reverse the upswing.
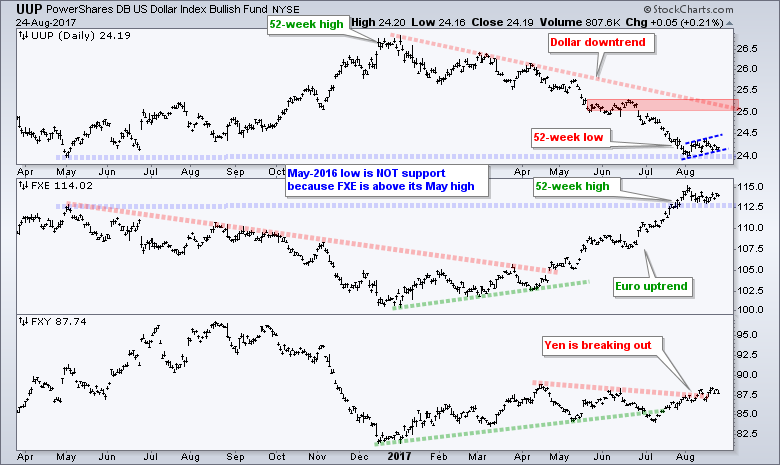
Dollar Stalls within Downtrend
The US Dollar ETF (UUP) fell sharply from late June to early August and then stalled the last three weeks. At this point, I consider this is a consolidation within a bigger downtrend. I could mark support at 24 from the May 2016 lows, but this does not make sense to me when the Euro ETF (FXE) is above a corresponding resistance level (May highs). The Euro still accounts for 57% of the Dollar ETF and FXE is the one to watch for clues. A break below 112.5 in FXE would signal a downturn in the Euro and this could lead to an upturn in UUP.
******************************************************
ETF Master ChartPack - 300+ ETFs organized in a Master ChartList and in individual groups.
Follow me on Twitter @arthurhill - Keep up with my 140 character commentaries.
****************************************
Thanks for tuning in and have a good day!
--Arthur Hill CMT
Plan your Trade and Trade your Plan
*****************************************


