.... Minding the Gaps (SPY, MDY, IJR)
.... QQQ and XLK are Still Leading
.... Cloud Computer and Internet ETFs Form Flags
.... HACK Hits Potential Reversal Zone
.... SOXX Coils after New High
.... Biotech ETFs Firm in Potential Reversal Zones
.... XME Turns after Small Correction (plus SLX)
.... International Steel versus US Steel
.... Silver Goes for a Break Out
.... Charts to Watch (AVGO, KLAC, GOOGL, NFLX, SYMC, BMY) ....
Minding the Gaps (SPY, MDY, IJR)
The first chart shows the S&P 500 SPDR (SPY), the S&P SmallCap iShares (IJR) and the S&P MidCap SPDR (MDY). All three hit 52-week highs in late July and then fell back over the last four weeks. SPY lost ~2.6%, IJR fell ~7.4% and MDY declined ~6%. Notice that SPY held the July low and this low acts as a benchmark low. ETFs and stocks holding above this show relative chart strength. ETFs and stocks breaking this low show relative chart weakness. IJR and MDY clearly broke their July lows.
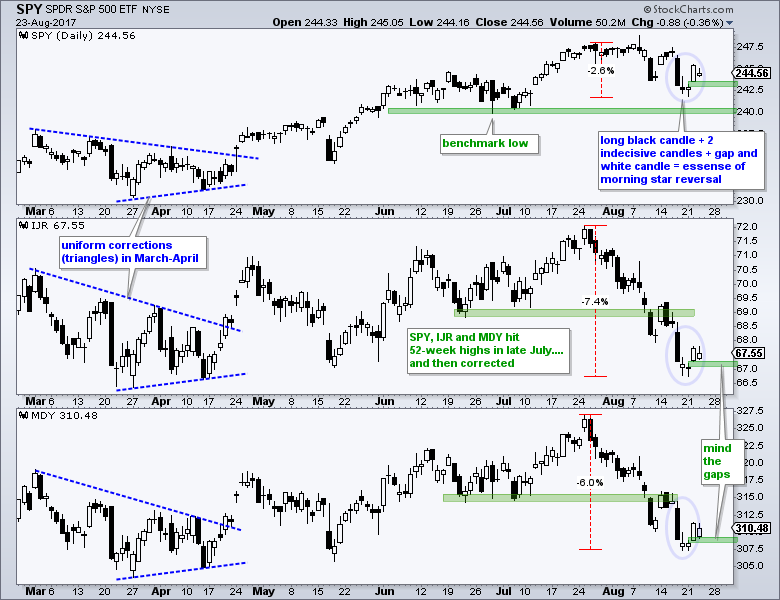
Despite relative weakness in small and mid caps, I am working under the brazen assumption that the long-term trends are up and the four-week declines are corrections within these uptrends and expect bullish resolutions to these corrections, but it could be tough sledding for the next few weeks (seasonal patterns, DC etc...). Returning to the charts, these three ETFs gapped up in an attempt to end of correction (second gap in ten days). The blue ovals show the essence of a morning star reversal over the last four days. As far as I am concerned, a long black candlestick, two indecisive candlesticks and a gap-white candlestick form the essence of the morning star. Short-term, traders should watch these gaps for signs of failure. A close below Monday's close would fill the gaps and negate the morning star reversals.
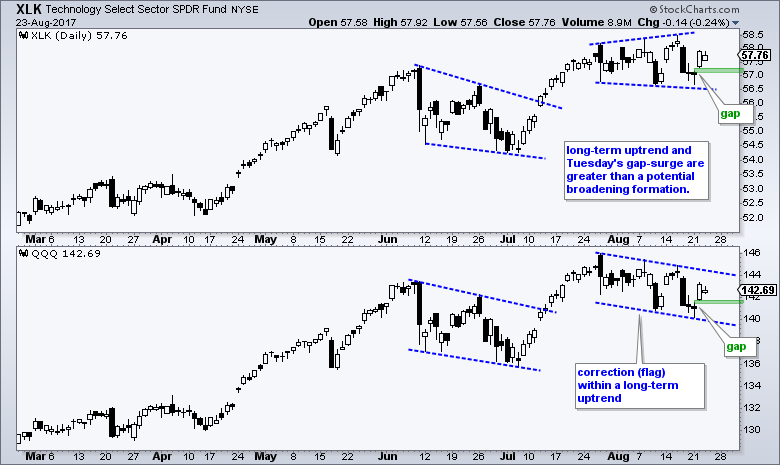
QQQ and XLK are Still Leading
The Nasdaq 100 ETF (QQQ) and Technology SPDR (XLK) represent large-cap techs. QQQ hit a new high in late July and XLK hit a new high just last week. The long-term trends are clearly up and this means my bias is for short-term bullish patterns because the path of least resistance is up. QQQ formed a falling flag over the last four weeks and gapped up on Tuesday. XLK is currently in a sideways consolidation that some may view as a broadening formation. Both gapped up on Tuesday and surged with long white candlesticks. These are bullish until proven otherwise (hint: mind the gaps).
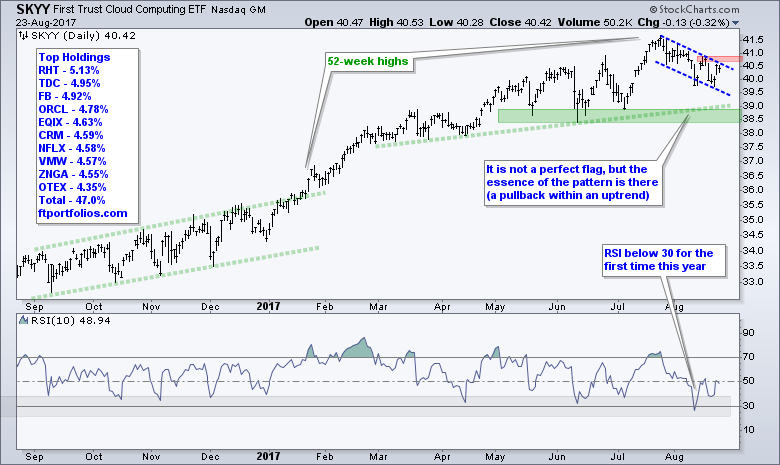
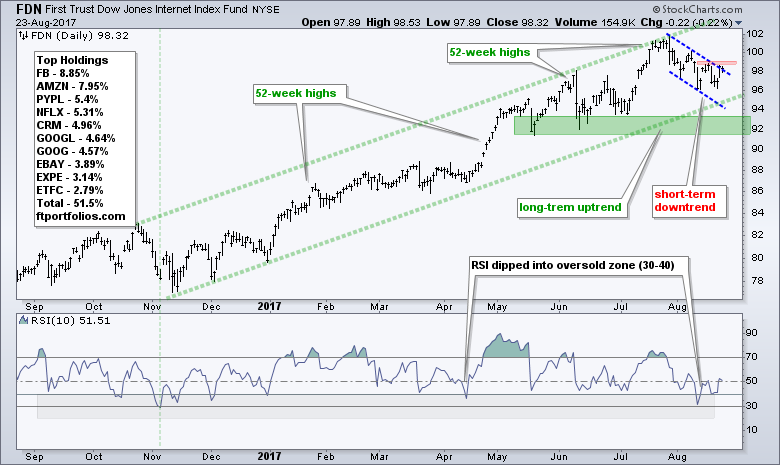
Cloud Computer and Internet ETFs Form Flags
The Cloud Computing ETF (SKYY) hit a 52-week high in late July and corrected with a falling flag the last four weeks. A break above last week's high would end the correction and signal a continuation higher. Notice that RSI became oversold (<30) last week for the first time this year. Oversold within an uptrend presents an opportunity, not a threat. The Internet ETF (FDN) chart shows similar characteristics.
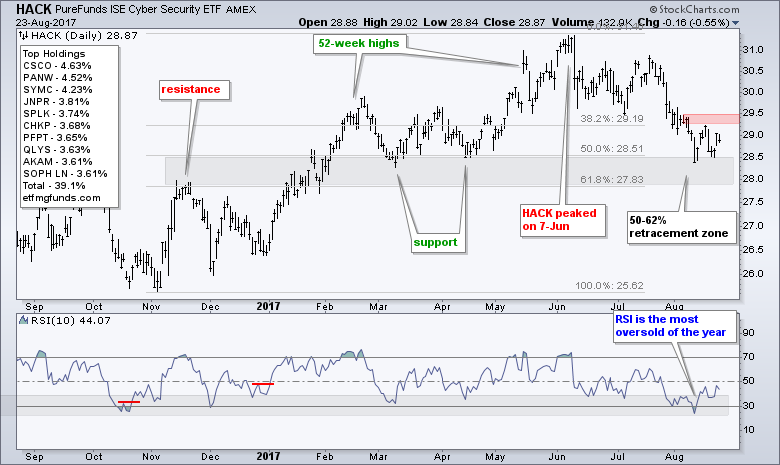
HACK Hits Potential Reversal Zone
The Cyber Security ETF (HACK) is underperforming the broader market and trending lower since early June, but the ETF has reached a potential reversal zone. HACK peaked on June 7th and fell around 10% from high to low, breaking the July benchmark low in the process. I see a potential reversal zone because the decline retraced 50-62% of the Nov-Jun advance and broken resistance turns support in this area (28-28.5). Look for a break above 29.5 for the first bullish sign.
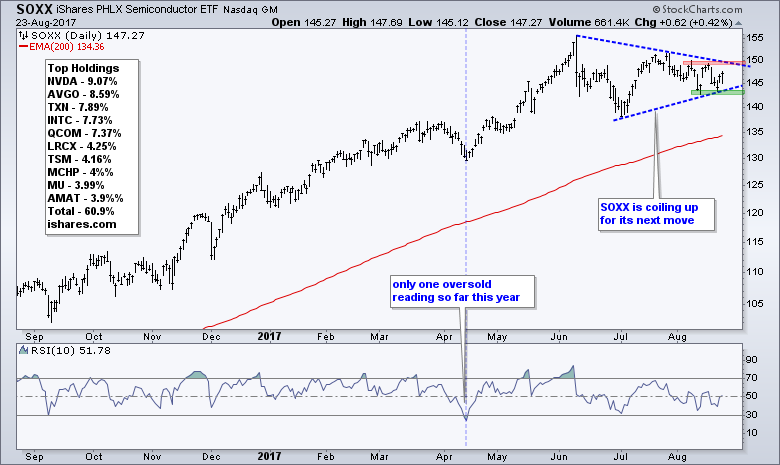
SOXX Coils after New High
I showed the Semiconductor SPDR (XSD) in ChartWatchers this past weekend, but today I will show the Semiconductor iShares (SOXX). Note that First Solar (4.21%) and SunPower (3.69%) are the top holdings in XSD, while Nvdia (9.07%) and Avago (8.59%) are the top holdings in SOXX. I think SOXX has a little more octane. The chart shows SOXX hitting a 52-week high in early June and then consolidating the last 2+ months with a symmetrical triangle (coil). Look for a breakout at 150 to end this consolidation.
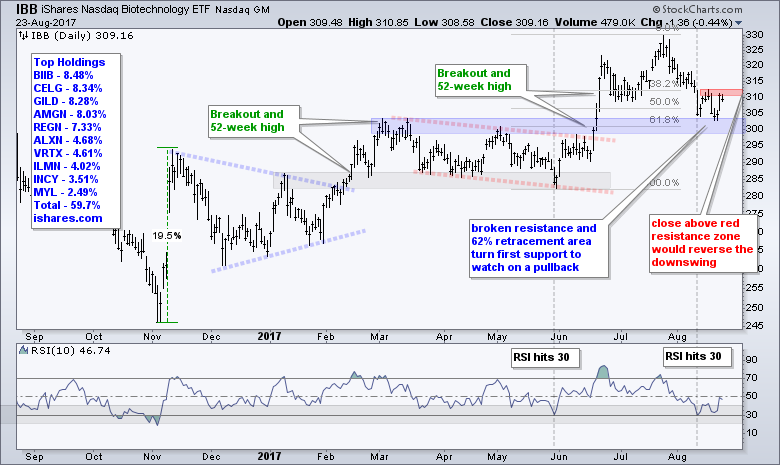
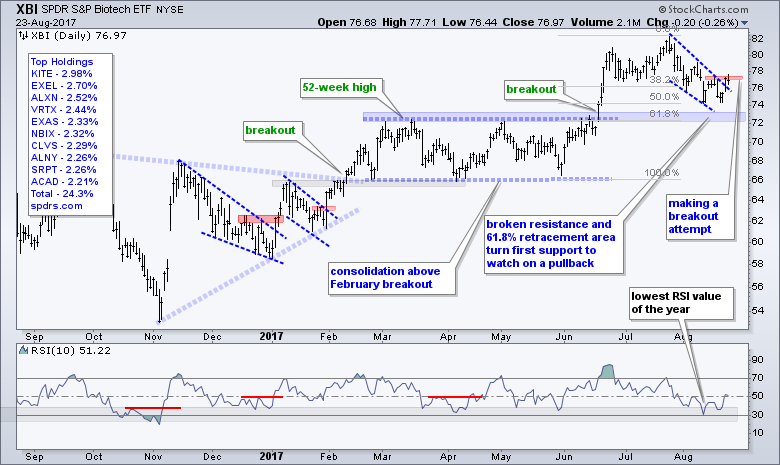
Biotech ETFs Firm in Potential Reversal Zones
The Biotech iShares (IBB) and the Biotech SPDR (XBI) show similar patterns (corrections within uptrends). This is hardly surprising because biotechs tend to be a highly correlated group. Both broke out in mid June and surged to new highs in July (clear uptrend). They then fell back towards their breakout zones and retraced 50-62% of the prior advance. RSI also moved to its lowest level of the year, but did not become technically oversold (<30). Both are starting to firm and breakouts would suggest that the corrections are ending and the bigger uptrends are resuming. Before leaving these two, take a look at the top ten holdings and notice the difference between the two ETFs. XBI is a broader ETF with equally weighted holdings, while IBB is a market cap weighted ETF that favors large-caps.
XME Turns after Small Correction (plus SLX)
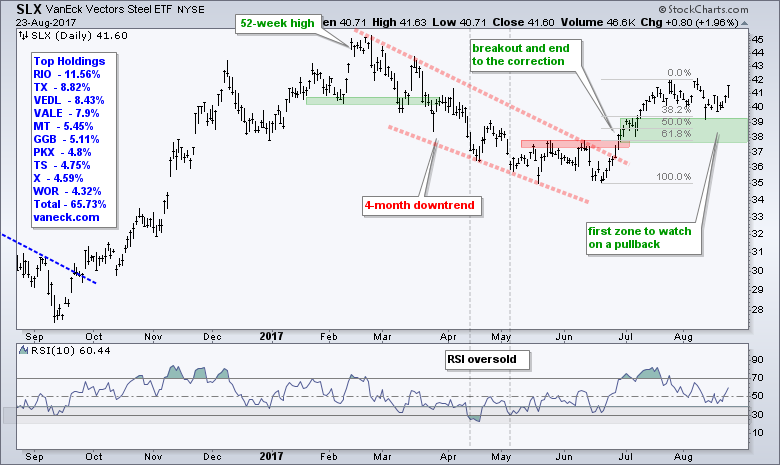
I noted the bullish patterns in the Base Metals ETF (DBB) and Copper ETN (JJC) in the Weekly Review & Outlook on June 30th. This commentary also showed at breakout in the Steel ETF (SLX), as well as corrective patterns in the Metals & Mining SPDR (XME) and Copper Miners ETF (COPX). Copper, Palladium and Aluminum are at 52-week highs and industrial metals remain strong overall. XME fell back to its breakout zone and appears to be turning up again.
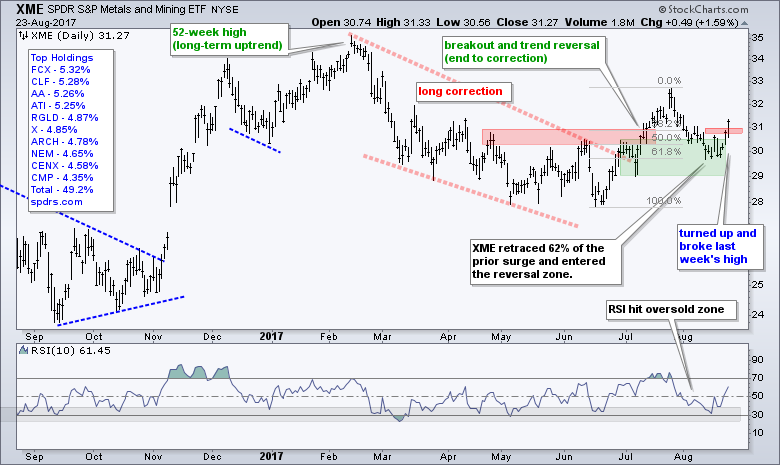
The XME chart also highlights the agony of a loooonnnnnggggg correction, which is shown with the red lines. RSI dipped into the oversold zone in late February and became oversold in March (and again in May). XME went through a bottoming process and finally broke out in July. Not all oversold readings result in significant upturns and the bottoming process can be painful. RSI again moved into the oversold zone (20-40) and XME turned up.
International Steel versus US Steel
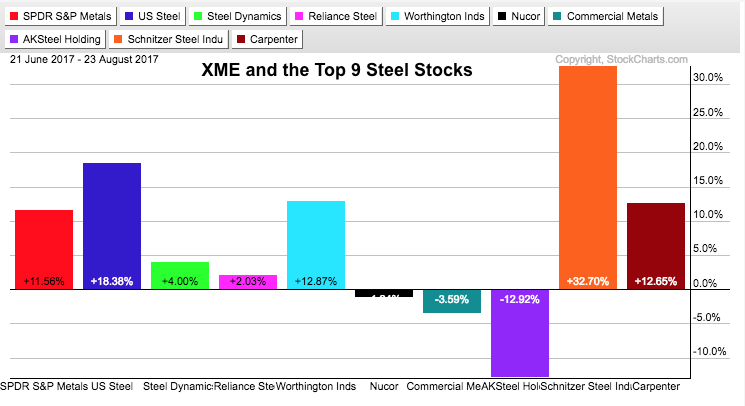
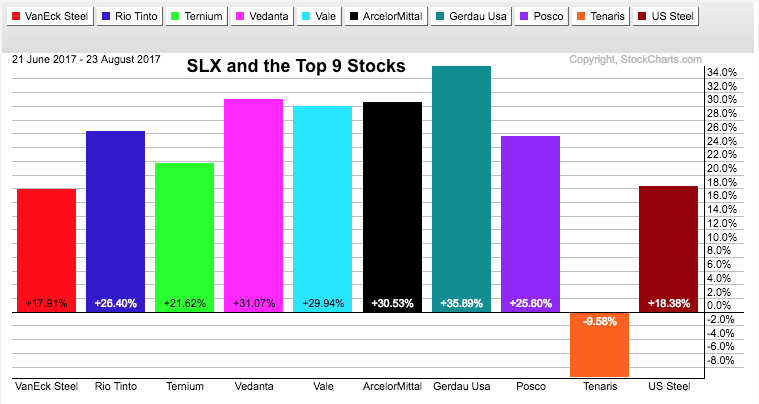
XME is dominated by steel stocks because they account for 48% of the ETF. However, these stocks are not the same as those dominating the Steel ETF (SLX). XME is dominated by US-based steel stocks, while SLX is dominated by foreign steel stocks. Among other things, the weak Dollar is helping the performance of foreign stocks. The first PerfChart shows XME with the top nine steel stocks: 6 up and 3 down with NUE lagging. The second PerfChart shows SLX with its top nine steel stocks: 8 are up 18% or more and 1 is down around 10%.
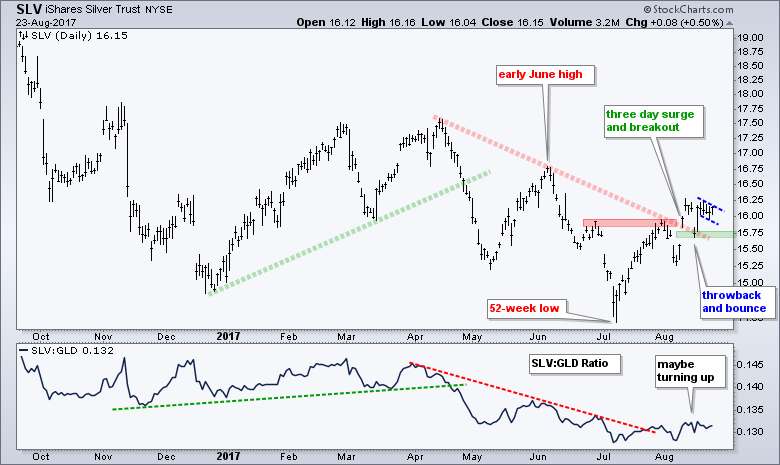
Silver Goes for a Break Out
Technically speaking, the Silver ETF (SLV) is still in a long-term downtrend because it hit a 52-week low in early July and has yet to clear the early June high, which is the last significant peak. There are, however, signs of strong buying pressure with the July-August surge and breakout near 16. Notice that SLV fell back hard last week, but immediately recovered with a surge back above 16. The ETF then formed a small falling flag the last four days and a breakout at 16.25 would signal a continuation higher. I would mark support at last week's low (15.68) and re-evaluate on a close below this level.
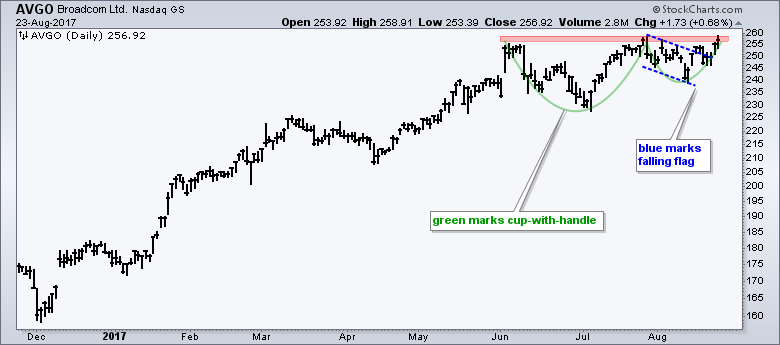
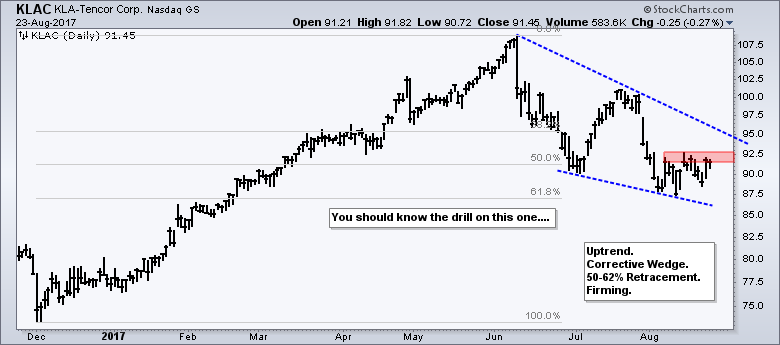
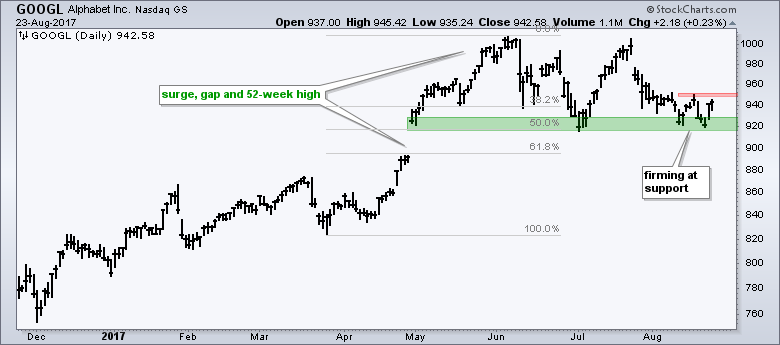
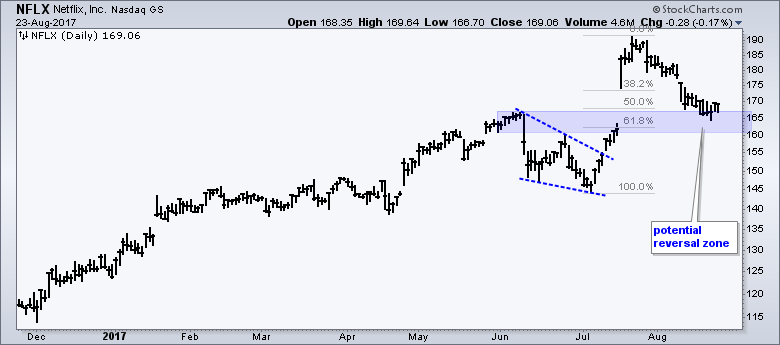
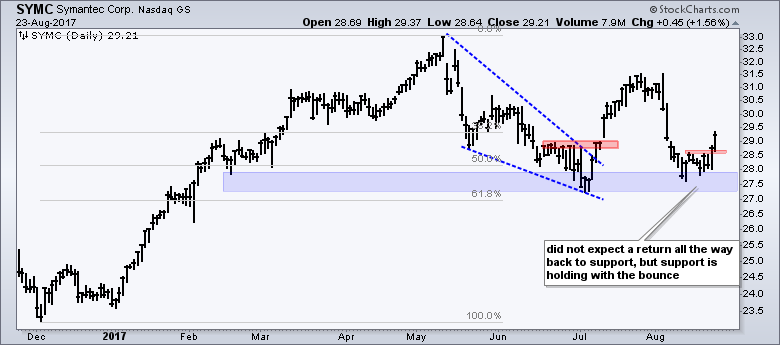
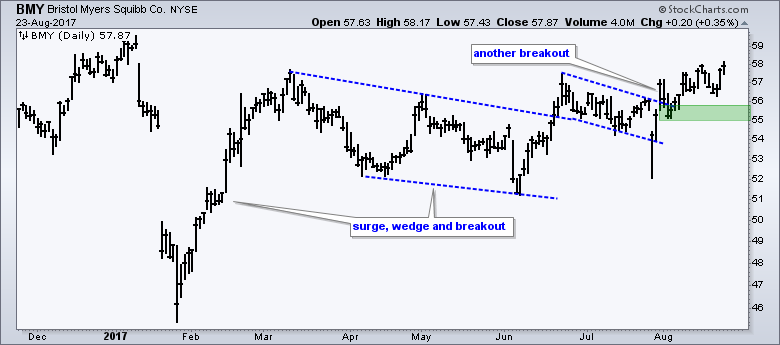
Charts to Watch (AVGO, KLAC, GOOGL, NFLX, SYMC, BMY)
******************************************************
ETF Master ChartPack - 300+ ETFs organized in a Master ChartList and in individual groups.
Follow me on Twitter @arthurhill - Keep up with my 140 character commentaries.
****************************************
Thanks for tuning in and have a good day!
--Arthur Hill CMT
Plan your Trade and Trade your Plan
*****************************************


