.... EW S&P 500 ETF Stalls in Potential Reversal Zone
.... Checking the Chandelier Exit on IJR
.... S&P 500, Five Percent and the 200-day
.... Scanning for Short-term Relative Strength
.... Scanning within a Sector
.... Bottom Fishing for the Long-term
.... PKI Firms at a Key Retracement
.... Small-cap Breadth, Large-cap Leadership, Economy and DC ....
I am going to start with the EW S&P 500 ETF (RSP) to establish my base case for the stock market. First, the long-term trend is up because RSP hit a 52-week high on July 25th, the 50-day EMA is above the 200-day EMA and RSP is above the rising 200-day EMA. The EMAs are not shown to keep the chart clean. If I assume that the long-term trend is up, then I also assume that declines are just corrections within this uptrend. While one decline will ultimately reverse this long-term uptrend, I do not think a ~3% decline in four weeks is enough to reverse the long-term uptrend.
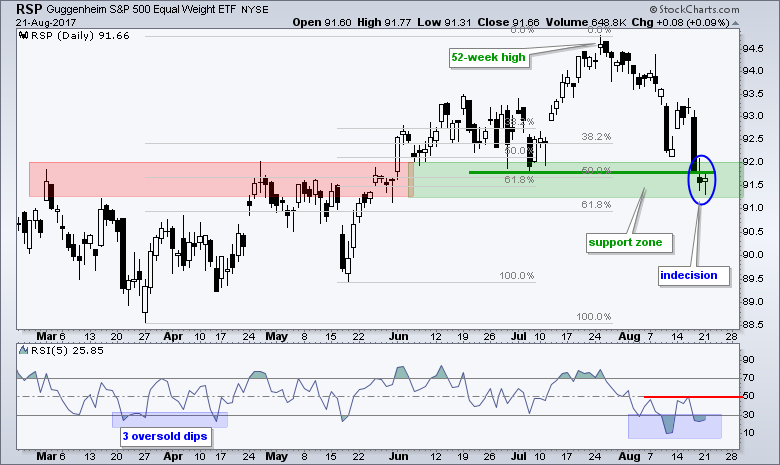
Nobody knows how far the current pullback will extend, but my basic strategy is to trade pullbacks within an uptrend. This means I am looking for oversold conditions and potential reversal zones. The pullback in RSP has reached a point where a short-term reversal could materialize. First, notice that the ETF retraced 50-61.8% of the March-July advance and returned to the breakout zone. Technically, RSP broke the mid July low (green line), but ETF and indexes with dozens of moving parts (stocks) deserve support and resistance ZONES. Second, RSP formed indecisive candlesticks over the last two days and a gap-surge today would forge a morning star type reversal. Third, RSI dipped below 30 for the third time in three weeks. A move above 50 would trigger a short-term momentum breakout. The SPY and QQQ charts show similar setups.
Checking the Chandelier Exit on IJR
The RSI-Chandelier strategy for the S&P SmallCap iShares (IJR) produced three good trades from March to June, but the current trade(s) are under water. This system buys when RSI(5) moves above 30 and sells when IJR closes below the Chandelier Exit (22,1). You can read more about this strategy and the backtest results in this System Trader article. The strategy triggered bullish signals on August 7th and August 14th, but IJR continued lower after these signals. A third signal would trigger if RSI moves above 30 again and perhaps the third time would be the charm. The red line at 50 shows that RSI has remained in the bottom half of its range since late July. Look for a move above 50 for a momentum breakout.
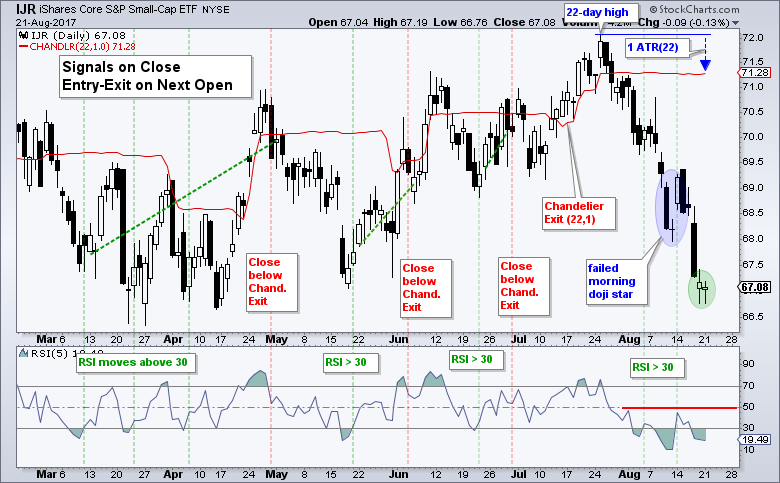
The Chandelier Exit (22,1) is a trailing stop that is one ATR(22) value below the 22-day high, which was on July 25th. The system triggered a buy signal when the Chandelier Exit was above the price so it was not "trailing at the time". Either price moves above the Chandelier Exit or the Chandelier Exit starts moving lower (or both). This Chandelier Exit will start moving lower in a few days because the 22-day high will move forward from the 25-July high in four days.
Before leaving this chart, notice that the morning doji star reversal failed in mid August (blue oval). IJR is also setting up for another possible candlestick reversal after a long black candlestick and two indecisive candlesticks the last two days (green oval). A gap and surge today would form a four-day morning star reversal. Yes, I know that morning star reversals are three-candle patterns. However, Steve Nison notes that we should show a little flexibility in interpretation. Namely, do the candlesticks capture the "essence" of the pattern.
S&P 500, Five Percent and the 200-day
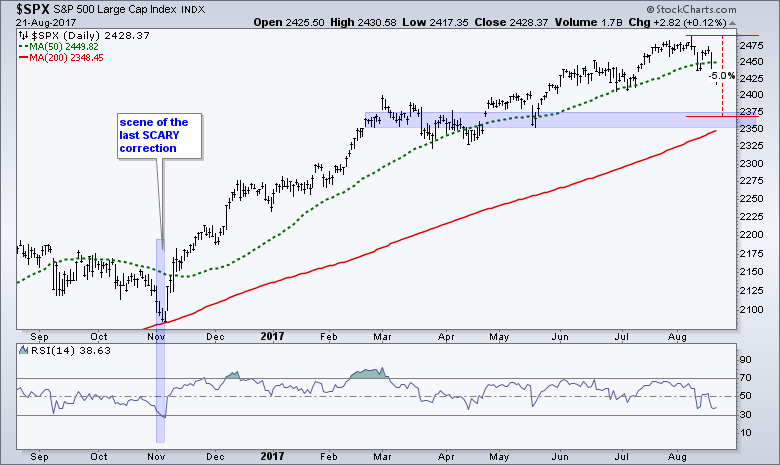
So now that I have laid out the case for a bounce, we must remember that the weakest six-week period of the year just started and it runs until the end of September. August is also known as the most volatile month of the year because thin trading makes for big swings. In addition, stocks were extended in July and ripe for a correction. Pullbacks within an uptrend are normal, but we never know how far a pullback will extend or what course it will take. The last serious correction was from September to early November when the S&P 500 fell a whopping 5%, pulled back to its rising 200-day SMA and RSI(14) dipped below 30. A similar correction now would extend to the 2370 area.
Scanning for Short-term Relative Strength
The first chart in this commentary shows the EW S&P 500 ETF (RSP) peaking on July 25th and falling 3.12% over the last four weeks (19 trading days to be exact). Chartists looking for stocks with relative strength during this timeframe can scan for a positive 19-day Rate-of-Change. Technically, you could scan for stocks with a Rate-of-Change above -3%, but these stocks still exhibit selling pressure because they are down. Stocks with a positive Rate-of-Change actually show some actual buying pressure the last four weeks. The scan code is below:
// set stock universe
[group is SP500] or [group is SP400] or [group is SP600]// set Rate of Change periods
AND [ROC(19) > 0.0]
For reference, 164 stocks in the S&P 500 (32.8%) are positive over the last 19 days, 77 stocks in the S&P Mid-Cap 400 are positive (19.25%) and 118 stocks in the S&P Small-Cap 600 are positive (19.66%). Once again, we can see that large-caps are holding up much better than small and mid caps. For this reason, chartists should consider limiting their scans to the S&P 500 and looking for setups within the large-cap universe.
Scanning within a Sector
Chartists can also scan within sectors. The image below comes from the Advanced Scan Workbench. I am scanning the financial sector within the S&P 500 and looking for stocks that are up over the last 19 days. You can add the sector using the drop-down menu highlighted in red.
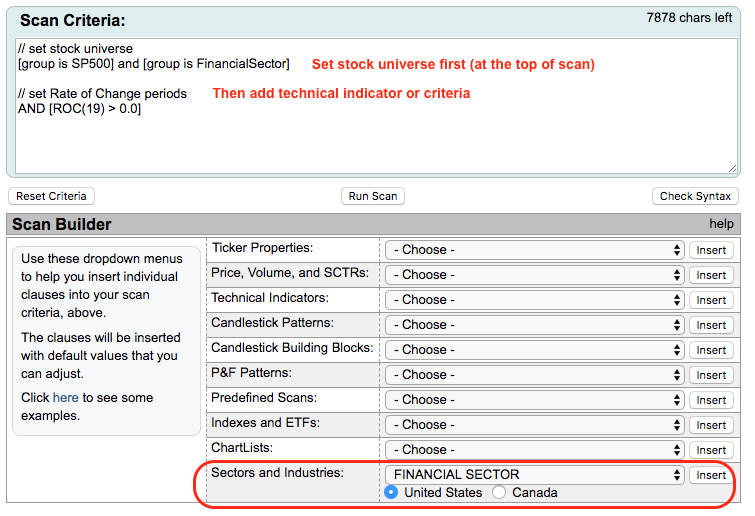
Note that you will have to place this text to the top of your scan code. It is best to whittle down your scan universe first and then scan for a technical indicator. In this example I started with the S&P 500 and whittled it down to the financial sector. I then added the technical indicator. The list below shows all the sector codes.
[group is ConsumerStaplesSector]
[group is CyclicalsSector]
[group is EnergySector]
[group is FinancialSector]
[group is HealthCareSector]
[group is IndustrialSector]
[group is MaterialsSector]
[group is TechnologySector]
[group is UtilitiesSector]
The listing below shows the number of stocks that are up over the last 19 days, the total number of stocks in the sector and the percentage of stocks that are up over the last 19 days. The utilities sector (87.9%) is the overwhelming winner in August. Consumer staples stocks are performing well with 55% up. Cyclicals, aka consumer discretionary, is not performing too bad with 37% up. Hint: you can run the scan without the Rate-of-Change line to see how many stocks are in each sector.
Consumer Staples: 19/34 (55%)
Cyclicals: 33/89 (37%)
Energy: 2/32 (6.25%)
Finance: 30/107 (28%)
Healthcare: 16/60 (26.7%)
Materials: 6/24 (25%)
Technology: 17/59 (28%)
Utilities: 29/33 (87.9%)
Fundamental Fishing for the Long-term
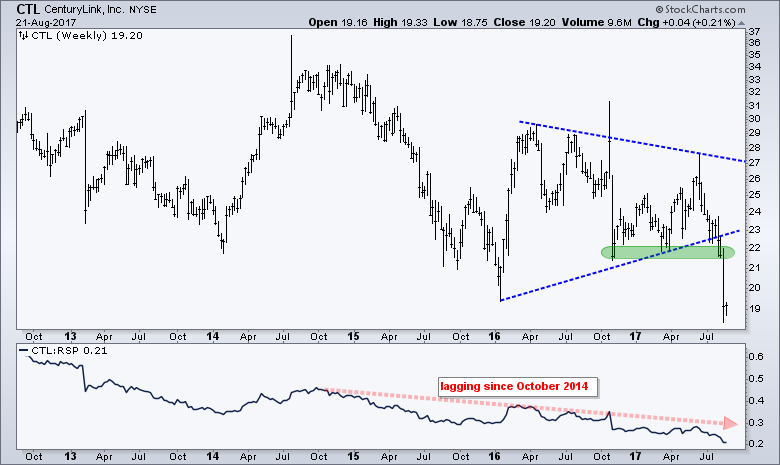
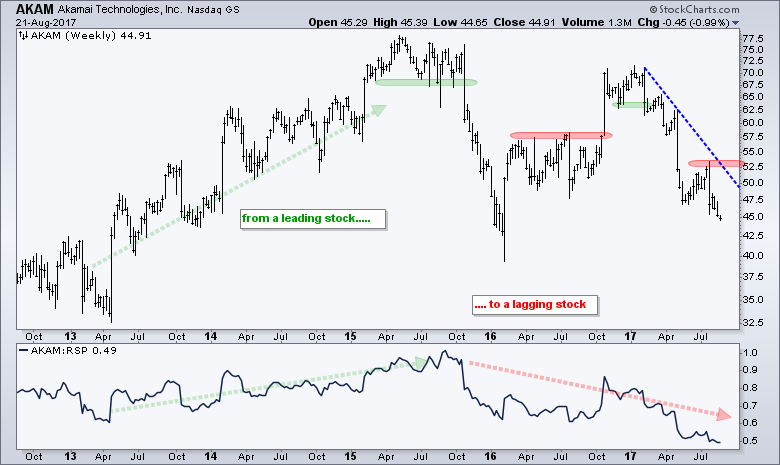
I watched an interview with Paul Meeks, a fund manager with Sloy, Dahl & Holst who specializes in technology. In particular, I found his 80/20 approach to portfolio construction interesting. Basically, 80% of the portfolio goes into strong names and leaders. The other 20% is for beaten down stocks that are misunderstood. Some of them will not recover, but some will and the gains from these will more than offset the losses from the others. At least, that is the theory. This approach is something like venture capital: lots of strikeouts and a few home runs. This type of strategy also takes time to play out. Meeks mentioned two beaten down names, AKAM and CTL, and here are the charts. Yep, the charts are so ugly that only a fundamental analyst could love them, with all due respect to Mr. Meeks. I am highlighting AKAM and CTL because Meeks thinks long-term and is a top manager who knows a lot more about technology than I do.
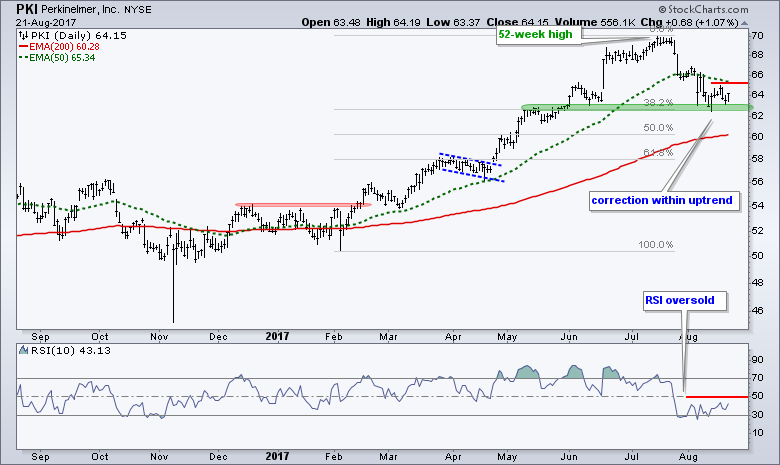
PKI Firms at a Key Retracement
PerkinElmer (PKI) highlights the type of setup I am looking for in a stock. There are basically three parts: long-term uptrend, pullback and potential reversal zone. PKI is clearly in a long-term uptrend with the 52-week high and the 50-day EMA above the 200-day EMA. The stock pulled back with the decline to around 63 and RSI became oversold. This pullback is at a potential reversal zone marked by the 38% retracement and the green support zone. A break back above the 50-day EMA or RSI break above 50 would provide the first signs of an upturn (end to the correction).
Small-caps Breadth, Large-cap Leadership, Economy and DC
And finally, here are a few videos that I found interesting.
Jonathan Krinsky, MKM Partners chief market technician, discusses the current trends in the market and the weakening breadth in small-caps.
Canaccord Genuity chief market strategist Tony Dwyer discusses his stock market projection, the market PE, economic growth and Washington DC. Dwyer comments about DC are especially interesting (inaction ok as long as no new taxes and no new regulation)
Craig Johnson of Piper Jaffray discusses the Russell 2000, relative weakness in small-caps and leadership in large-caps.
******************************************************
ETF Master ChartPack - 300+ ETFs organized in a Master ChartList and in individual groups.
Follow me on Twitter @arthurhill - Keep up with my 140 character commentaries.
****************************************
Thanks for tuning in and have a good day!
--Arthur Hill CMT
Plan your Trade and Trade your Plan
*****************************************


