Art's Charts September 29, 2017 at 09:22 AM

.... VIX Extends its Low Run .... Revisiting Seasonality .... QQQ Lags, but Doesn't Drag .... Small-caps and Micro-caps Take the Lead .... Biggest Momentum Surge in 10 Years for IJR .... Sector Participation Supports Bull Market ...... Read More
Art's Charts September 28, 2017 at 04:07 PM

Most of us are familiar with positive and negative divergences in momentum indicators. These divergences suggest that directional momentum is slowing and there could be a trend reversal. There is just one problem. Most divergences are at odds with the bigger trend... Read More
Art's Charts September 26, 2017 at 07:45 AM
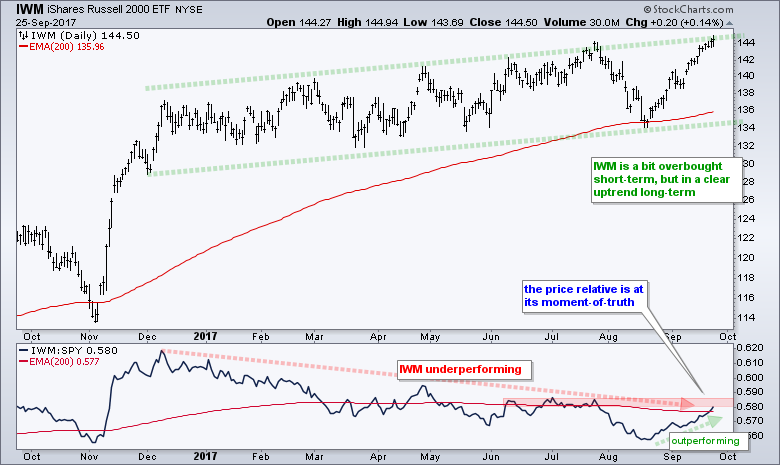
.... Small-caps Extend to New Highs .... Broad Selling in the Nasdaq 100 .... XBI and IBB Edge Higher .... COPX and JJC Correct within Uptrends .... TLT Turns Up within Uptrend .... Charts to Watch: DAL, CB, LEN, RMD, SBAC ...... Read More
Art's Charts September 22, 2017 at 09:47 AM

.... An Abrupt Change in Leadership .... News and No Man's Land .... New High Parade Continues .... Uptrends are Slowing, Not Reversing .... A Strong Surge for Small-caps .... Finance, Tech, Industrials and Materials Lead .... Healthcare and Utilities Take a Dip ...... Read More
Art's Charts September 19, 2017 at 07:52 AM
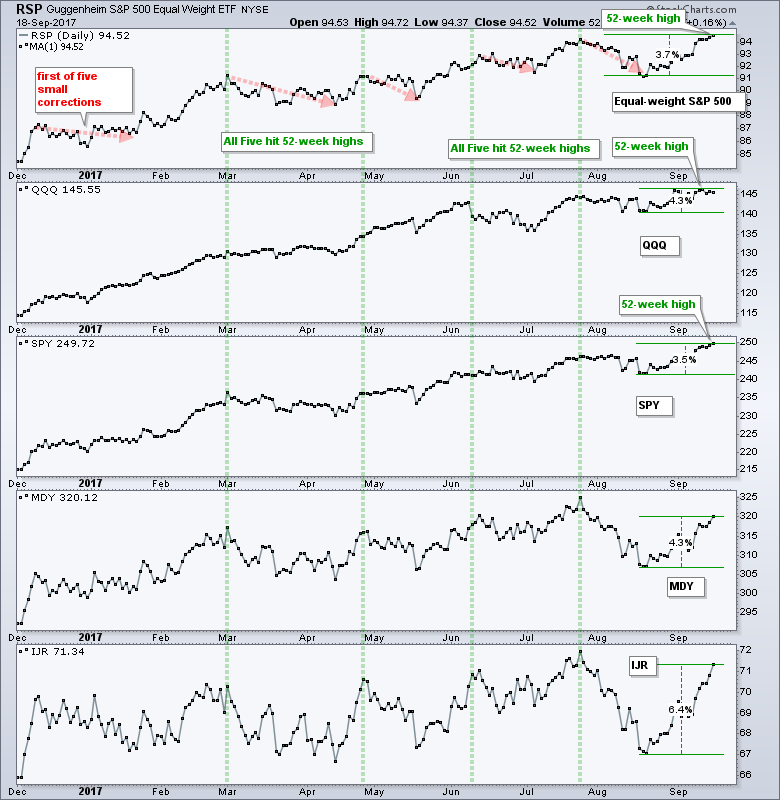
.... 52-week Highs Reflect Broad Strength .... Materials, Industrials and Technology Lead New High List .... Alphabet, Amazon and Facebook are Dragging .... CSCO Hits Multi-Month High .... Fiserv Turns Up after Pullback .... AMD Bounces off Key Retracement ...... Read More
Art's Charts September 15, 2017 at 10:29 AM

.... Small-caps Extend Newfound Leadership Role .... AD Lines Hit New Highs .... RSI Notches another Overbought Reading for SPY .... IJR Continues to Grind Higher .... Tech, Industrials, Healthcare and Materials Lead .... XLI and XLB Extend after Breakouts ...... Read More
Art's Charts September 14, 2017 at 10:00 AM
Price Characteristics and Indicator Effectiveness There is NO SUCH thing as the perfect indicator. Further more, even if you find the almost perfect indicator, there is no such thing as the optimal setting. A 50-day SMA works great for one stock and lousy for another... Read More
Art's Charts September 12, 2017 at 09:23 AM
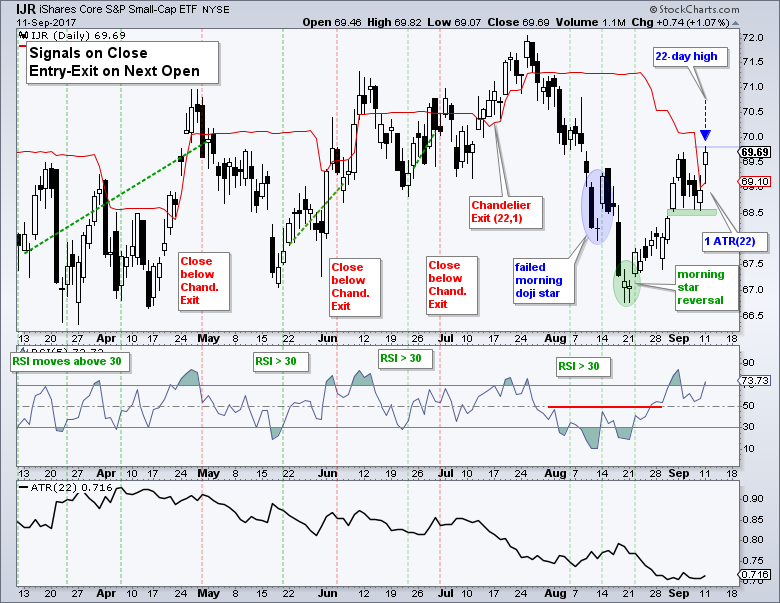
.... Sticking with a Strategy (IJR) .... Finance Sector Rebounds .... Broker-Dealer ETF Holds Up Better .... TD Ameritrade and Etrade Lead Brokers .... Industrials Sector Breaks Out .... Airlines Finally Perk Up .... Delta and American Lead Bounce ...... Read More
Art's Charts September 08, 2017 at 09:27 AM

.... Large-techs Tower over Small-caps .... September is a Coin Flip .... High-Low Percent Indicators are Dragging .... Fewer than 50% of Small-caps Above 200-day EMA .... SPY and QQQ Hold Flag Breakouts .... Monitoring the Upswing in IJR .... Finance Weighs as Healthcare Leads ... Read More
Art's Charts September 07, 2017 at 07:56 AM
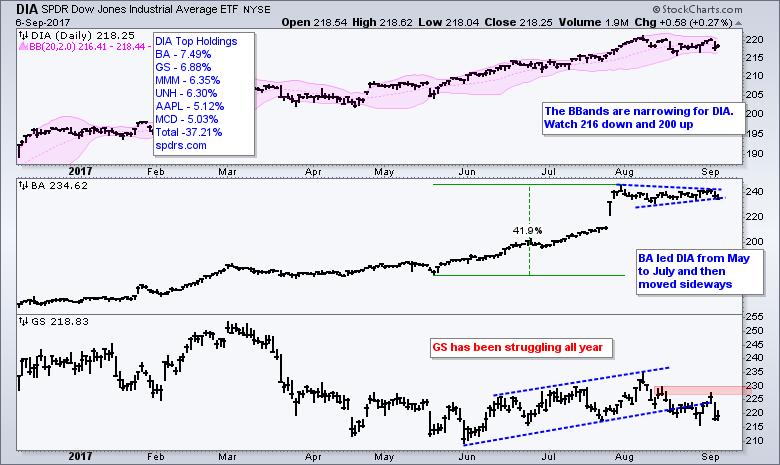
.... Bollinger Bands Contract for Dow SPDR (plus BA and GS) .... QQQ Holds Breakout Zone .... Setting a Pullback Target for Apple .... A Boring Uptrend for Microsoft .... Facebook Breaks Wedge Line .... Alphabet and Amazon are the Weakest Links ...... Read More
Art's Charts September 05, 2017 at 09:12 AM
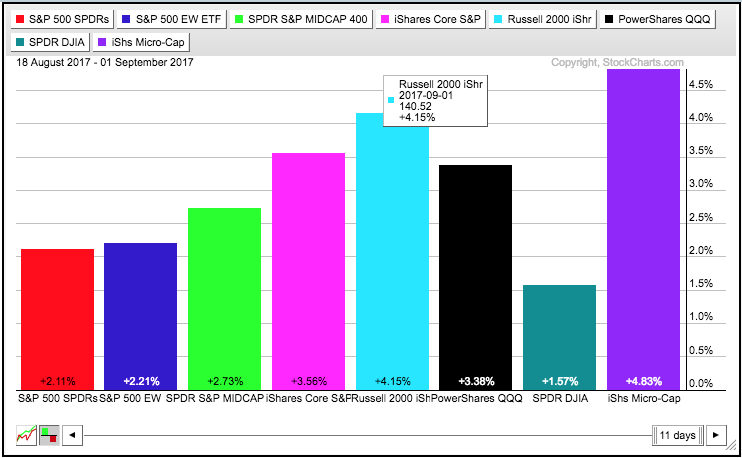
.... Small-caps Take the Short-term Lead .... But Small-caps are Still Lagging Long-term .... IJR Surges Toward Chandelier Exit .... 10-yr T-Yield Firms Near June Lows .... Correlations with the 10-yr Yield .... Brent Stronger that WTI .... Two Bearish Stocks and One Bull ...... Read More
Art's Charts September 01, 2017 at 10:40 AM

.... QQQ Leads with Breakout and New High .... Higher Highs > Weakening Momentum .... Small-caps Leading for Two Weeks .... Tech, Utes and Healthcare Lead Sector SPDRs .... Materials and Industrials Break Flag Lines .... Consumer Discret. SPDR Bounces off Support ...... Read More