.... The Little Bull that Could
.... Industrials, Finance and Tech Lead New High List
.... Cyber Security and Networking ETFs Turn Up
.... Strategy Note - A New High in the Future
.... Metals-Mining and Steel ETFs Bid to End Pullbacks
.... Freeport McMoran Stalls within Uptrend
.... Nucor and Steel Dynamics Attempt to End Corrections ....
The Little Bull that Could
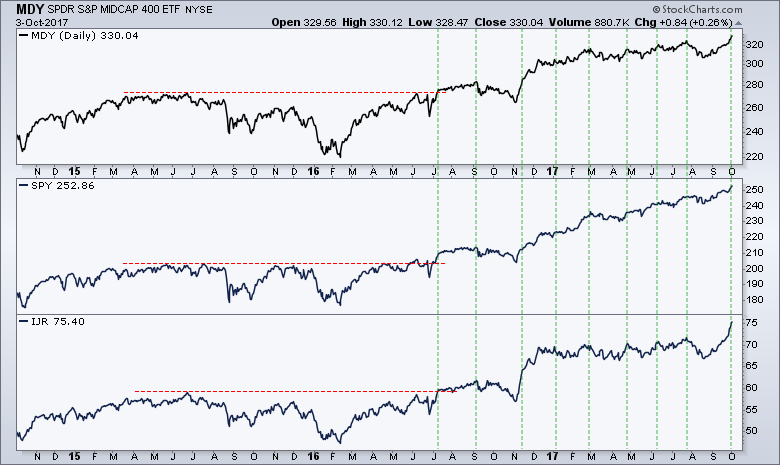
The bull market extended yet again as the S&P 500 SPDR, S&P MidCap SPDR and S&P SmallCap iShares hit new highs. Not just new 52-week highs, but new all time highs. We can argue about sentiment, seasonality, overbought conditions and valuations, but there is no arguing the bull market when these three hit new highs. Oh, by the way, these three ETFs first hit simultaneous new highs in June 2016. They have continued hitting new highs every two to three months as the uptrends simply extend.
Industrials, Finance and Tech Lead New High List
Looking through the sectors, we saw fresh new highs in the Technology SPDR (XLK), Finance SPDR (XLF), Industrials SPDR (XLI) and Materials SPDR (XLB). Even though XLK is underperforming over the last four weeks, it is certainly not weak and the chart remains bullish overall. The chart below shows the nine sector SPDRs ranked by High-Low Percent. As a percentage of total issues, Net New Highs is the highest for industrials (34%). XLF High-Low% ($XLFHLP) is at 30% and XLK High-Low% ($XLKHLP) is at 20.5%. These are not shabby numbers and show that these three sectors are leading the new high list. This is where market leadership can be found and this is a bullish trio. Note: the High-Low Percent values can be seen on the right end of each histogram.
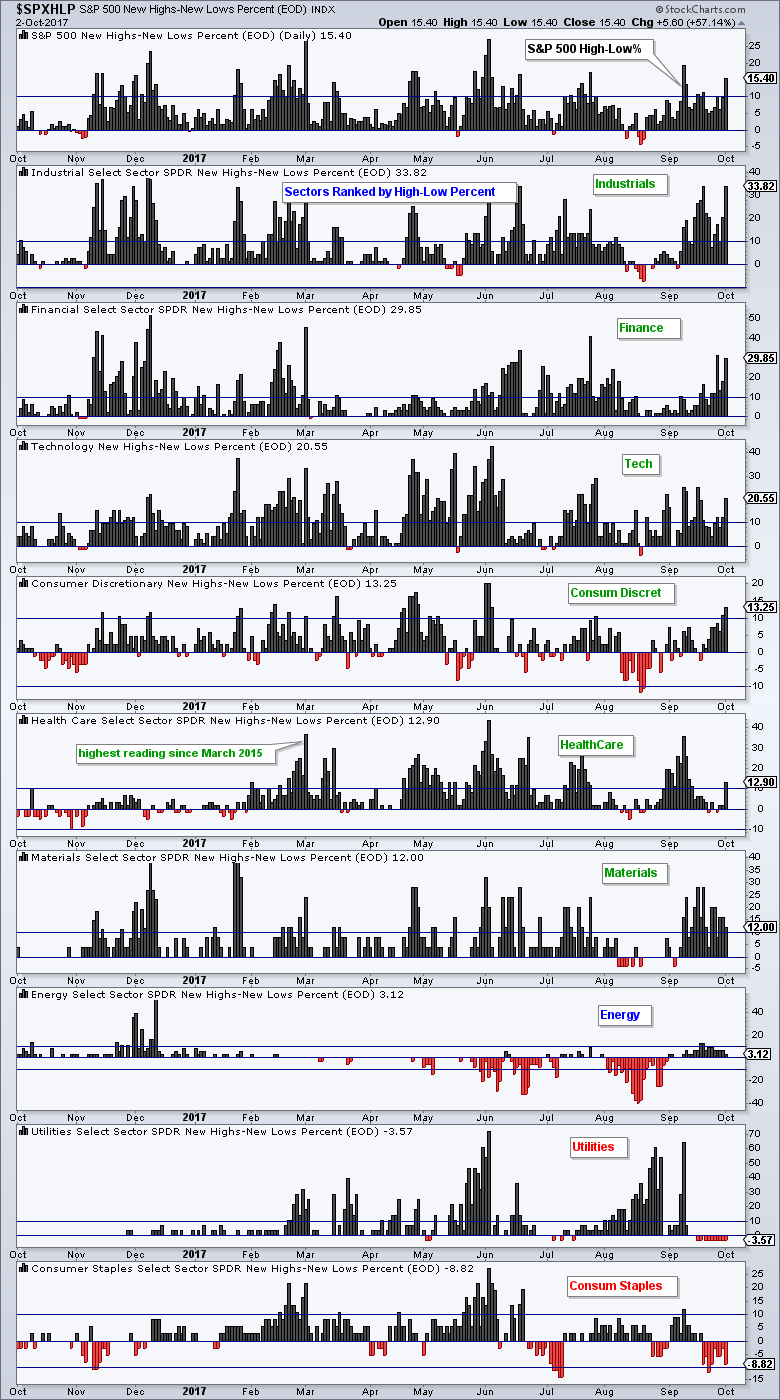
Chartists should also note that XLY High-Low% ($XLYHLP) exceeded +10% and hit its highest level since early June. Homebuilders, Autos and Gambling are helping this sector. XLP High-Low% ($XLPHLP) is by far the weakest of the nine because it exceeded -10% in late September and remains in negative territory.
Cyber Security and Networking ETFs Turn Up
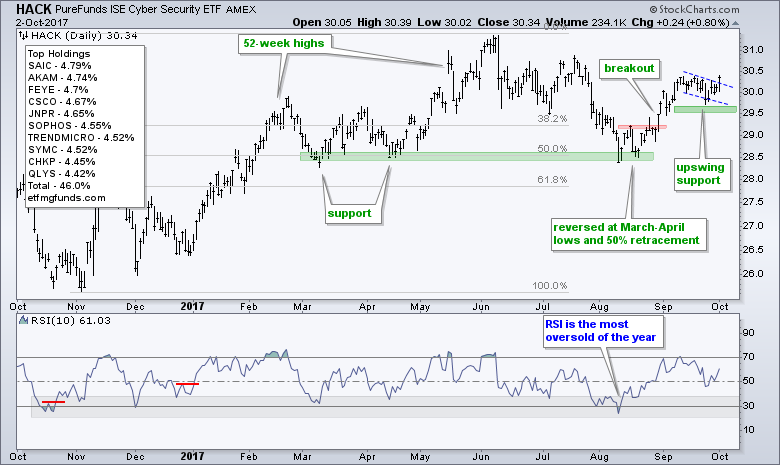
The Cyber Security ETF (HACK) and the Networking iShares (IGN) have been lagging the other tech-related ETFs over the last few months, but they may be poised to play a little catch-up. Note that the Internet ETF (FDN), Cloud Computing ETF (SKYY) and Semiconductor iShares (SOXX) hit fresh new highs on Monday and these three continue to lead the market. The first chart shows HACK reversing off the 50% retracement and March-April lows in mid August. The ETF fell back over the last few weeks with a falling flag of sorts and broke above the upper trend line on Monday.
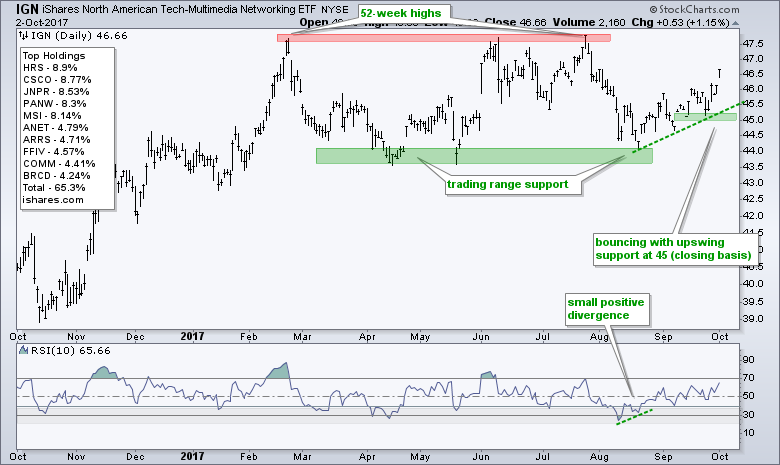
The next chart shows the Networking iShares (IGN) reversing off support from the April-May lows in mid August and surging the last four trading days. The green trend line and late September lows mark upswing support at 45 (closing basis).
Strategy Note - The Next Stock with a New High
My general strategy is to look for pullbacks within an uptrend and then try to time the end of the pullback. IGN and HACK are in long-term uptrends because both hit 52-week highs in June. Both pulled back into mid August and then turned up the last five weeks. I am also on the lookout for stocks and ETFs that have turned up recently and could hit new highs in the coming weeks. New highs are bullish, but they are not always actionable from a trading standpoint. I prefer to take my chances before the new highs make the headlines.
Metals-Mining and Steel ETFs Bid to End Pullbacks
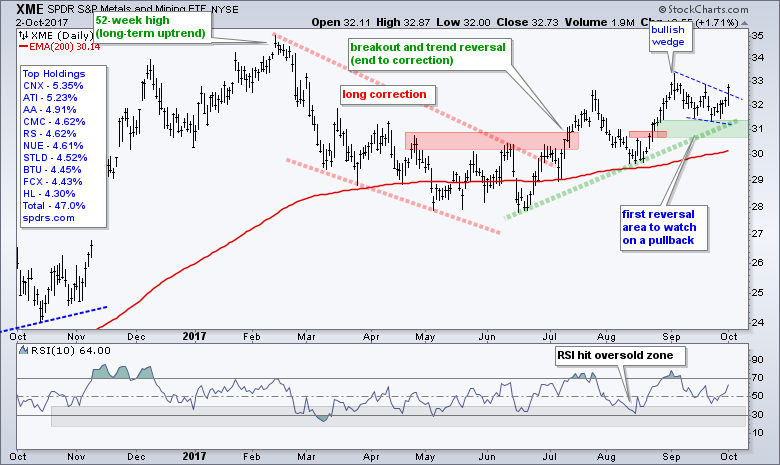
The industrials sector is one of the strongest sectors in the market right now. I do not want to wade into the fundamental reasons behind this strength, but I suspect it could be because capital spending is increasing. This makes me wonder if some other cyclical groups may join the rally, such as the Metals & Mining SPDR (XME) and the Steel ETF (SLX). The first chart shows XME in an uptrend since the July breakout. After hitting a multi-month high in early September, the ETF corrected with a small falling wedge. Monday's surge above the upper wedge line suggests that the correction is ending and the uptrend is resuming. Support is set in the 31 area.
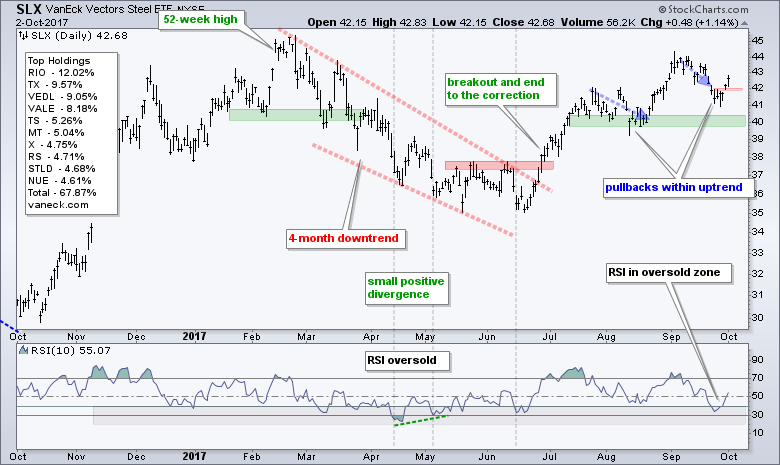
The next chart shows the Steel ETF (SLX) reversing its four month correction with a breakout in June. The ETF pulled back twice (blue arrows) and the most recent pullback pushed RSI into the oversold zone. SLX appears to have reversed this pullback with an upturn over the last two days. Key support is set in the 40 area.
Freeport McMoran Stalls within Uptrend
Freeport McMoran (FCX) is finding support near the August lows and chartists should watch for a break above the mid September high. Overall, the stock reversed its correction with a breakout in July and surge above 15. FCX then consolidated in the 13.5-15.5 area for two months and this is considered a rest within a bigger uptrend.
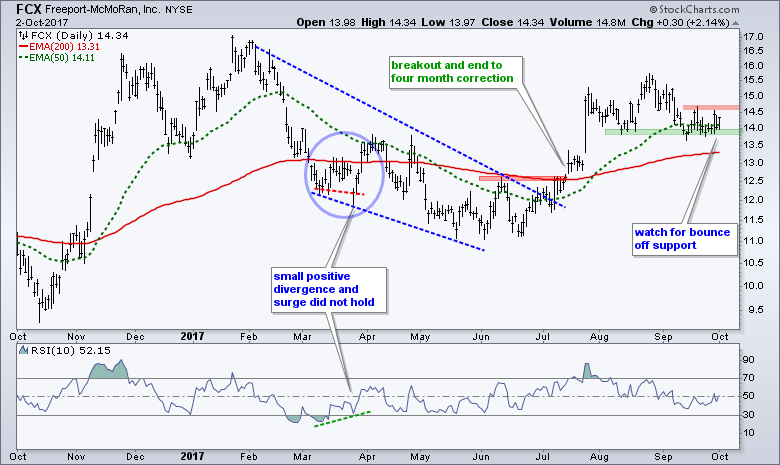
I wrote about divergences on Thursday and offered a strategy for quantifying positive divergences. Basically, we should ignore negative divergences that form in uptrends or when a symbol is hitting new highs. Instead, we should look for positive divergences to signal the end to a correction. It certainly sounds great in theory, but it does not always work in real life. Case in point....RSI formed a positive divergence in March and FCX surged above its mid March high in late March. This looked like a pretty good setup at the time, but it ultimately failed as the stock moved below the March lows. Can't win them all.
Nucor and Steel Dynamics Attempt to End Corrections
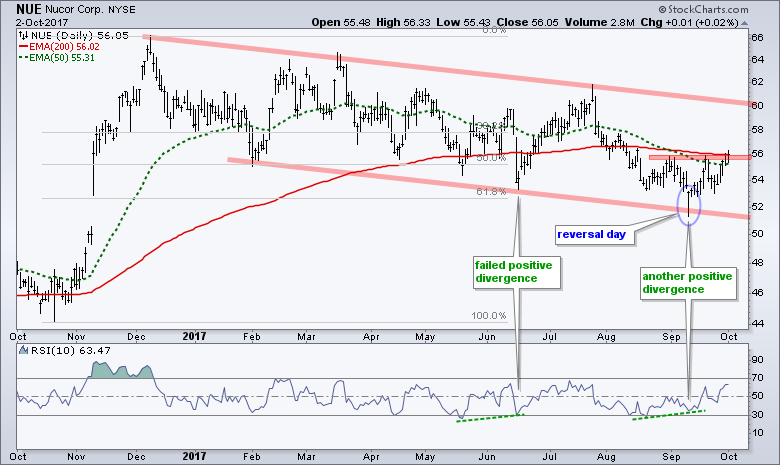
The next chart shows Nucor (NUE) peaking in December and falling the last nine months (red lines). It is a clear downtrend, but it could still be a correction after a surge from October to December because it has retraced around 61.8% of this advance. The correction has clearly overstayed its welcome, but so too did the correction in the Regional Bank SPDR (KRE). I thought NUE was going to reverse in June with the positive divergence and surge back above the 200-day EMA. This attempt failed and RSI is once again forming a positive divergence. Also notice that NUE firmed from late August to late September and broke above its September highs on Monday. The pattern over the last two months could be a small inverse head-and-shoulders. A short-term breakout is in the making and this could lead to a bigger breakout down the road.
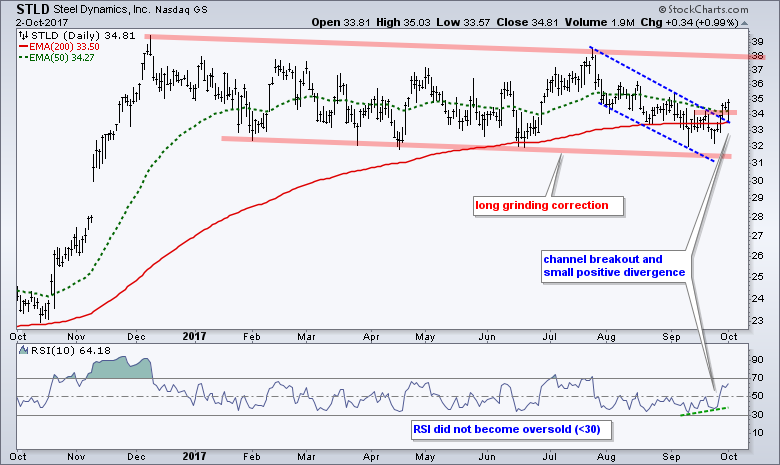
The next chart shows Steel Dynamics (STLD) with a long grinding correction from December to September. The stock surged some 70% from mid October to mid December and then fell around 20% during this correction. This is like three steps forward (+70%) and one step backward (-20%). There are signs of an upturn within the correction as the stock broke out of the two month channel and RSI formed a small positive divergence.
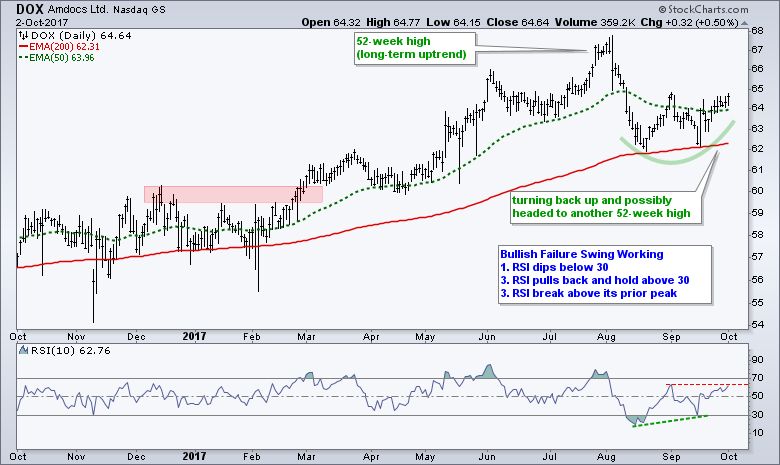
And finally, the last chart shows Amdoc (DOX) in a long-term uptrend and turning up over the last few week. A trend in motion stays in motion and this suggests that a new 52-week high is in order in the coming weeks.
******************************************************
ETF Master ChartPack - 300+ ETFs organized in a Master ChartList and in individual groups.
Follow me on Twitter @arthurhill - Keep up with my 140 character commentaries.
****************************************
Thanks for tuning in and have a good day!
--Arthur Hill CMT
Plan your Trade and Trade your Plan
*****************************************


