.... Active Management Comes at a Cost
.... Add Some Beta with the S&P 500 High-Beta ETF
.... Get Serious Beta from the IBD 50 List
.... Creating a ChartList of the IBD 50 ....
Today I am going to step back and show how we can set up a ChartList to focus stocks with high growth. After a rant on active ETFs and the shortcomings of the S&P 500 High Beta ETF (SPHB), I will turn my attention to the IBD 50 ETF (FFTY) and its high-octane stocks. The performance of this ETF since February 2016 is astounding and there are some high flyers, but there are also some duds, such as Celgene, Veeva System and Nutrisystem. The idea is not so much to find stocks for right now, but to create a list of high-octane stocks that we can watch for bullish setups going forward.
Active Management Comes at a Cost
I am not a big fan of actively managed stock ETFs because they are likely to suffer the same fate of actively managed mutual funds. Higher expense fees and the human element will likely result in underperformance. We are all familiar with the stories of mutual fund underperformance. Most studies suggest that just 5% of mutual funds outperform their benchmarks over the long haul (10+ years). A report from Standard & Poor's reveals the following:
Over the 15-year period ending Dec. 2016, 92.15% of large-cap, 95.4% of mid-cap, and 93.21% of small-cap managers trailed their respective benchmarks.
Traders and investors are usually better off sticking with passive ETFs when it comes to stocks. First, the fees are usually a lot lower than actively managed ETFs. Second, they have a much better chance of outperforming an actively managed ETF. Non-stock and specialty ETFs are different and probably warrant some active management. These may include emerging market debt, junk bonds and international bonds.
While most actively managed stock ETFs underperform their benchmarks, there may be a place for actively managed ETFs that add some serious beta to the equation. Beta represents an asset's volatility relative to the broader market. Broadly speaking, a beta of 1 means the stock or ETF tracks the broader market perfectly. A beta of 2 means the asset is twice as volatile as the broader market and prone to wilder swings (think tech stocks). A beta of .50 means the asset is half as volatile as the broader market and prone to milder swings (think utilities).
Add Some Beta with the S&P 500 High-Beta ETF
As its name suggests, the S&P 500 High Beta ETF (SPHB) offers more sensitivity to the broader market by investing in the 100 stocks with the highest betas. Thus, it is invested in 20% of the stocks in the S&P 500. This fund is rebalanced quarterly in February, May, August and November.
The chart below shows SPHB in the upper window, SPY in the middle and the S&P SmallCap iShares (IJR) in the lower window. SPHB performed more like SPY (large-caps) from August to November 2016, but more like IJR (small-caps) from November to October. Notice how these two traded flag from mid December to mid August. With the surge from mid August to mid October, the SPHB regained its beta and outperformed SPY from November to October (31.5% vs 26.4%).
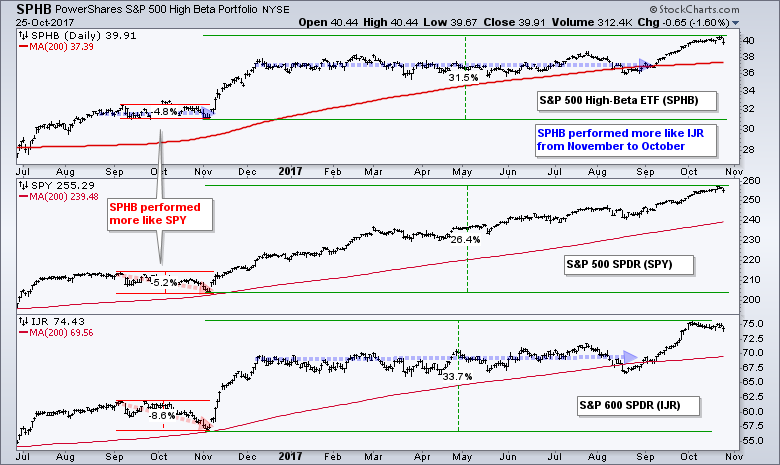
Admittedly, the S&P 500 High Beta ETF does not seem to add that much beta. It certainly does not add "serious" beta. A look at the holdings shows 23.81% industrials, 23.49% financials, 18.86% technology and 10% energy. I suspect that we would better off with a broad small-cap or mid-cap ETF because these stocks typically have higher betas than large-caps.
Get Serious Beta from the IBD 50
Chartists looking for some serious octane can try the IBD 50 ETF (FFTY) from Innovator and Investors Business Daily. This ETF uses the CANSLIM methodology to find high growth stocks with strong fundamentals and strong relative performance. It is a global ETF that is more concentrated and volatile than SPHB. The chart below shows FFTY, QQQ and SPY since FFTY began trading (August 2015).
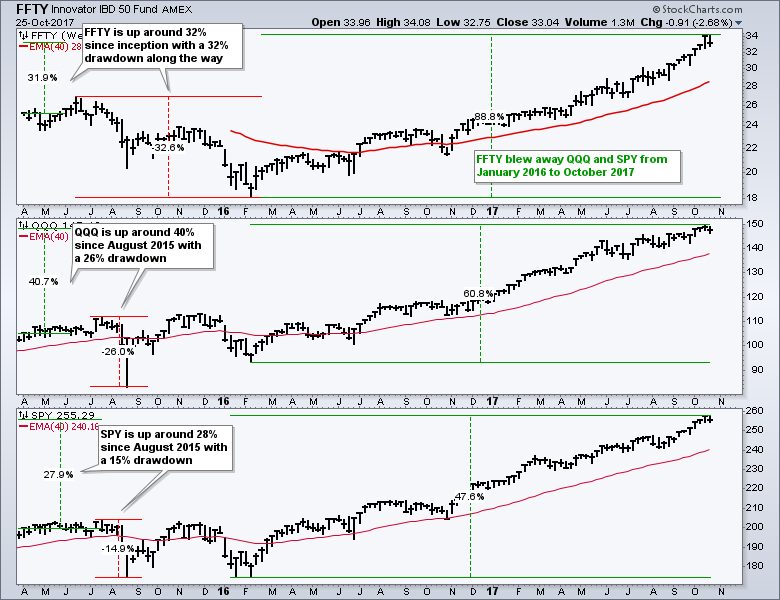
FFTY has outperformed SPY since August 2015, but not QQQ. Also notice that FFTY experienced a 32% drawdown from June 2015 to February 2016. This shows that growth is a double edge sword and we should expect bigger drawdowns. Most recently, FFTY is up over 80% from the February 2016 low and easily outperforming SPY and QQQ during this timeframe. An 80% gain in less than two years is certainly an attention grabber, but keep in mind that this is a volatile ETF that will go through some big drawdowns. The next correction, however, will set up the next opportunity to enter at a discount.
A look through the holdings of FFTY shows technology as the top sector with 63.65% and consumer discretionary as the second biggest sector with 20.57%. Together, these two account for over 80% of the ETF. Furthermore, 71.8% of the stocks are from the US and 25% are from China (ADRs). According to the Innovator website, the ETF is rebalanced weekly with a higher percent going to the names with the highest rank.
Creating a ChartList of the IBD 50
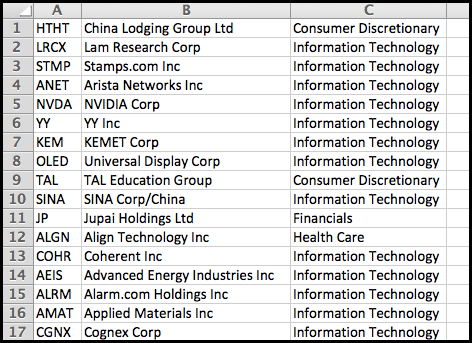
The IBD 50 ETF (FFTY) also gives us access to the IBD 50 Index and this means we can put the components in a ChartList for further analysis. These holdings are subject to change so we should probably update the list on a monthly basis. The first step is to put the holdings into an excel sheet with the symbol in column one (A), the name in column two (B) and any comments in column three (C). Usually, you can highlight/select the list in the browser, copy it and then paste it as text into excel. You then need to edit the sheet so it looks like the image below and save it as a "csv" file.
StockCharts members can create a new ChartList by going into "Edit" view and then closing the "New List" button.
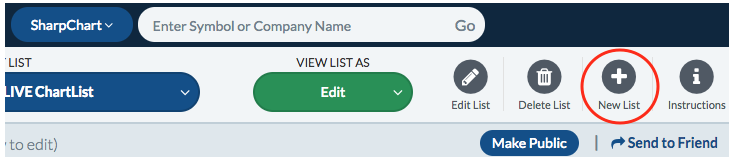
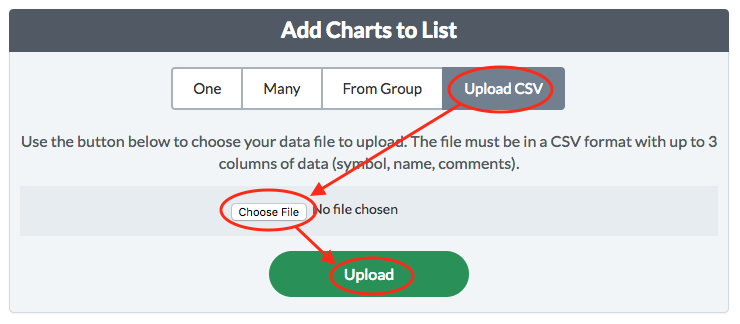
Then scroll down, click upload CSV, choose your CSV file and click upload. The file will upload and then click "ok" to complete the process.
Here is a link to a detailed support article on creating chartlist with a csv file.
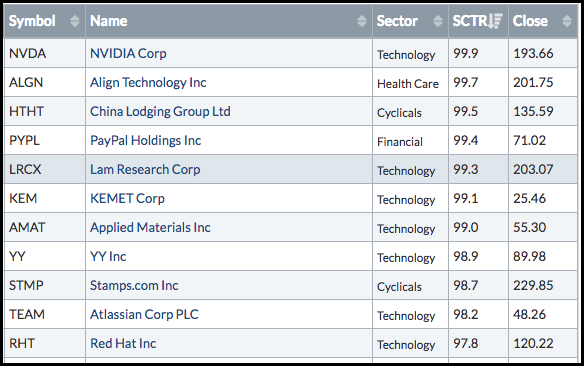
All but two of the stocks have a SCTR (SUPV and JP). Of the 48 stocks with an SCTR, only six are below 70 (CELG, GTN, VEEV, FB, EA and NTRI). Thus, 42 of 48 (87.5%) have a SCTR above 70. Of these 48, 18 (37.5%) have a SCTR that is 90 or higher. Clearly, there are some strong stocks in this group. The table below shows some of the top stocks for the SCTR. Here is a link to our SCTR Reports.
******************************************************
ETF Master ChartPack - 300+ ETFs organized in a Master ChartList and in individual groups.
Follow me on Twitter @arthurhill - Keep up with my 140 character commentaries.
****************************************
Thanks for tuning in and have a good day!
--Arthur Hill CMT
Plan your Trade and Trade your Plan
*****************************************


