 |
.... Amazon and Google Fool Billy Bear .... SPY and QQQ Edge Lower after New Highs .... QQQ Joins the Small-cap Dip .... IJR Falls Back into Flag Pattern .... 5 Sectors Hit New Highs - Tech Leads .... XLB Jumps to Fresh High .... XLF Breaks out of Flag .... XLK and XLI Extend with New Highs .... XLV Falls Towards First Support Zone .... XLY Set to Challenge Flag Line .... Utilities Defy Bonds in October .... Consumer Staples Remains the Weakest Link .... Brent Hits New High and Outperforms WTI .... XLE and XES Hit Potential Reversal Zone .... Bonds, Gold and the Dollar .... Chart Notes and Observations ... |
----- Art's Charts ChartList (updated October 27th) -----
Amazon and Google Fool Billy Bear
The major index ETFs hit new highs last week and then stalled a bit this week. Stalling is all part of an uptrend and an important part of the process, just ask Amazon and Alphabet. My old pal, Billy Bear, pointed to Amazon's failure to hold July's 52-week high and the trading range for five months. Billy also noted that Alphabet has HUGE resistance at 1000 and has gone nowhere since June.
I realize hindsight is 20/20, but the bigger picture shows that these were corrections within an uptrend. Corrections can be flat or involve a decline of sorts. Corrections are a normal part of an uptrend and they are actually healthy. Note that Amazon advanced over 50% from November to July and Alphabet was up around 35% from November to early June. These stocks were entitled to lengthy corrections after such strong advances. At the very least, chartists should resist the temptation to look for bearish patterns when 52-week highs are in sight.
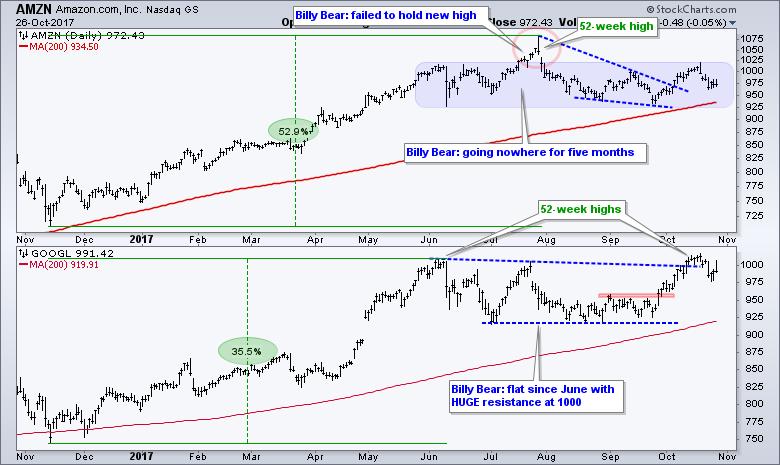
The direction of the bigger trend is my single most important assumption. Both stocks recorded 52-week highs in recent months, both are above their rising 200-day moving averages and their 50-day moving averages are above their 200-day moving averages. This means the long-term trends are up and a sideways trading range or pullback would be deemed a correction within this uptrend. AMZN formed a falling wedge and broke out in mid October. GOOGL surged off support in late September and broke resistance. There were signals before today's moves and today's move simply confirm the current uptrends. Note that both stocks are set to open above 1000 today. Oh, and by the way, Billy Bear is fictitious. Note that Google was highlighted in DTIC on October 4th and the Amazon wedge was highlighted in Art's Charts on October 12th.
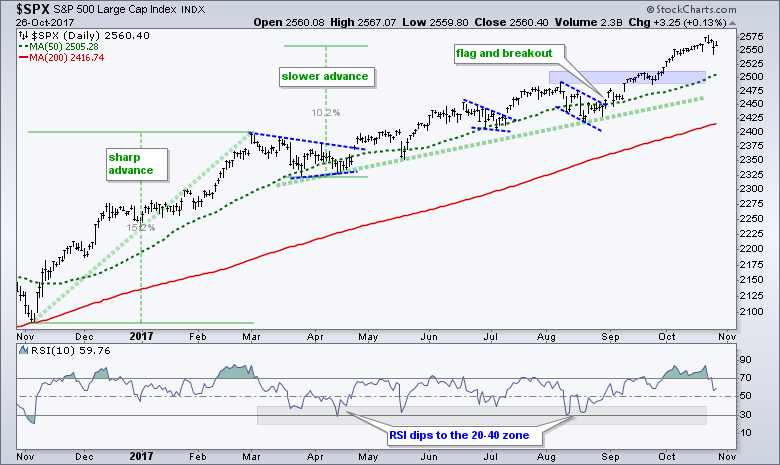
SPY and QQQ Edge Lower after New Highs
The S&P 500 SPDR (SPY) surged to a new closing high last Friday and then fell back over the last few days. SPY is down a whopping .58% so far this week and I would attribute this short-term noise to overbought conditions and earnings season. Overall, SPY remains in a short-term uptrend since mid August and a long-term uptrend since April 2016, which is when the 50-day EMA crossed above the 200-day EMA. The long-term uptrend dictates my trading bias and it remains bullish. This means I am only focused on bullish setups and bullish patterns. At this stage, SPY is "in trend" and I am waiting for the next bullish setup. Broken resistance and the late September consolidation mark the first pullback area to watch around 247-250.
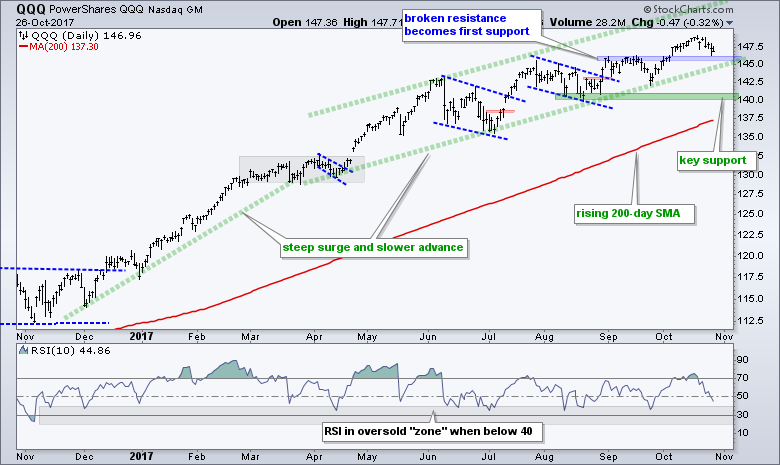
QQQ Joins the Small-cap Dip
The Nasdaq 100 ETF (QQQ) peaked last week and fell a whopping 1.3% the last six trading days. Again this is just a mini pullback after the surge from late September to mid October. The September highs mark broken resistance and this is the first support area to watch for a bounce. QQQ also hit this level with Wednesday's low. We can expect QQQ to start strong on Friday after a slew of earnings beats (AMZN, GOOGL, INTC, MSFT, WDC, KLAC)
IJR Falls Back into Flag Pattern
The S&P SmallCap iShares (IJR) broke above the flag line with a gap last Friday, but fell back into the flag with a decline on Wednesday. With a small bounce on Thursday, the ETF is back above the flag line and the short-term bias is still bullish. A close below 74 would be enough to negate the flag break and argue for a deeper pullback, perhaps to the 72 area.
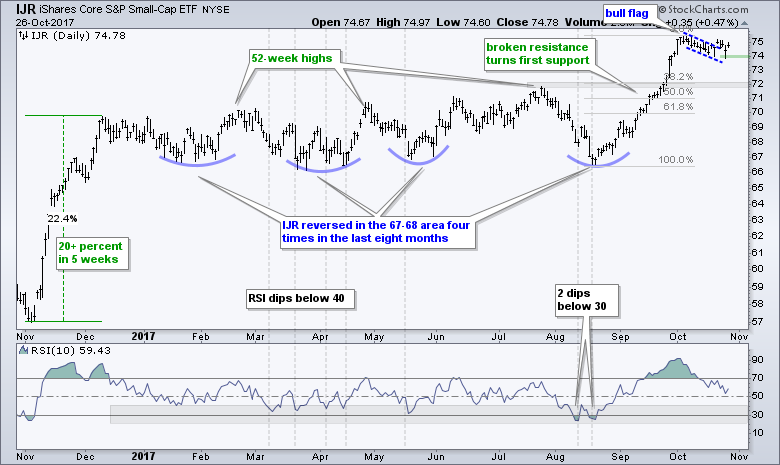
I make attempts to estimate the depth of a pullback, but these are just guesstimates. The long-term trends are up for SPY, IJR and QQQ, and this bigger force can override at pullback at any time. The IJR example uses the 38.2% retracement and broken resistance to estimate the depth of a deeper pullback, should it occur. I would also keep an eye on RSI(10) for a dip into the oversold zone (20-40). I suspect that RSI will not dip below 30 on the next pullback and we should be prepared on a dip below 40.
Majority of Sectors Hit New Highs
Five sector SPDRs hit new highs intraday this week (XLK, XLI, XLB, XLF, XLV). The Materials SPDR (XLB) is the strongest because it closed at a new 52-week high on Thursday. Similarly, the equal-weight versions of the technology, industrials, materials and finance sectors hit new highs this week (RYT, RGI, RTM, RYF). These are the four leading sectors right now and they account for 51% of the S&P 500 SPDR (SPY) and 47% of the EW S&P 500 ETF (RSP). In addition, I consider the technology, industrials and finance sectors as "offensive" sectors and leadership here bodes well for the stock market. Consumer discretionary is the fourth offensive sector and is very close to a 52-week high. The table below shows the sector ETFs that hit new highs (intraday) at some point this week.
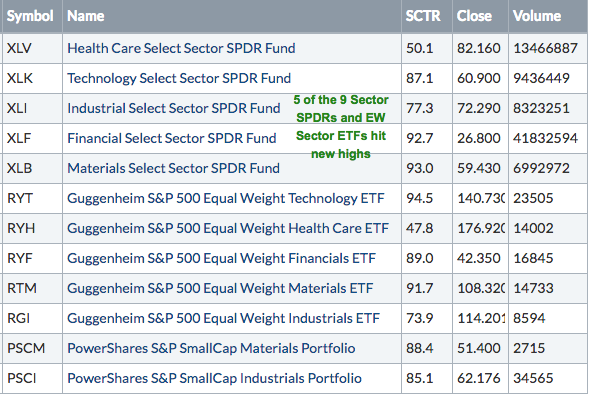
Technology Leads New High List
The next chart shows the nine sector SPDRs ranked by High-Low Percent. The XLU High-Low% ($XLUHLP) shot to the top of the list with +39%, which means 11 of the 28 components hit new highs and none hit new lows (11/28=.39 or 39%). Elsewhere, XLB High-Low% ($XLBHLP) hit +36%. Out of 25 total stocks in XLB, there were 9 new highs and 0 new lows (9/25 = .36 or 36%). The materials and utilities sectors are small so the absolute number of new highs is also pretty small.
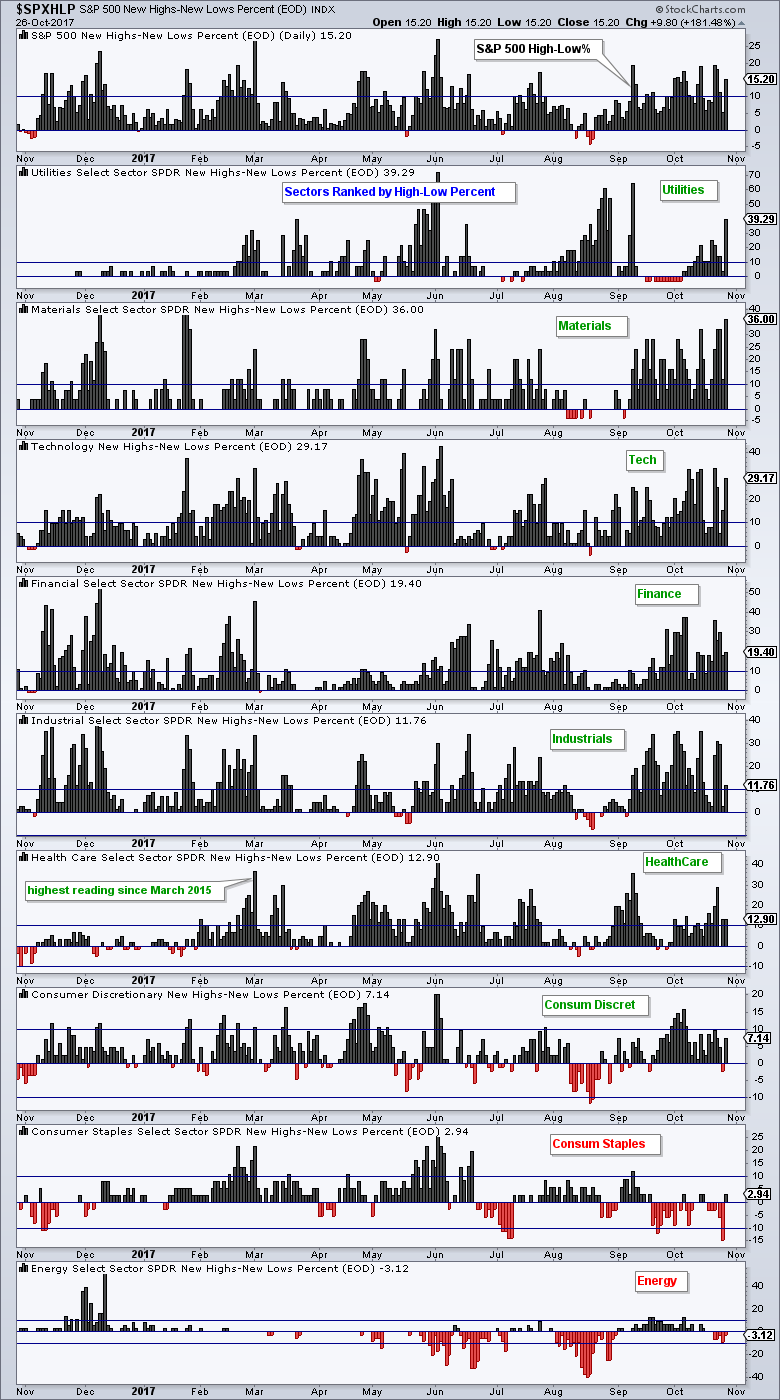
In contrast to XLB and XLU, there are 67 stocks in the Financials SPDR and 72 stocks in the Technology SPDR. XLF High-Low% ($XLFHLP) hit 19% and XLK High-Low% ($XLKHLP) hit 29%, which implies that 21 tech stocks hit new highs. Clearly these two sectors account for the majority of new highs in the S&P 500. Note that S&P 500 High-Low% ($SPXHLP) exceeded +15% seven times this month. This suggests that more than 75 of the 500 stocks in the S&P 500 hit new highs this month. Sounds strong to me. You can find the holdings for the sector SPDRs at sectorspdrs.com.
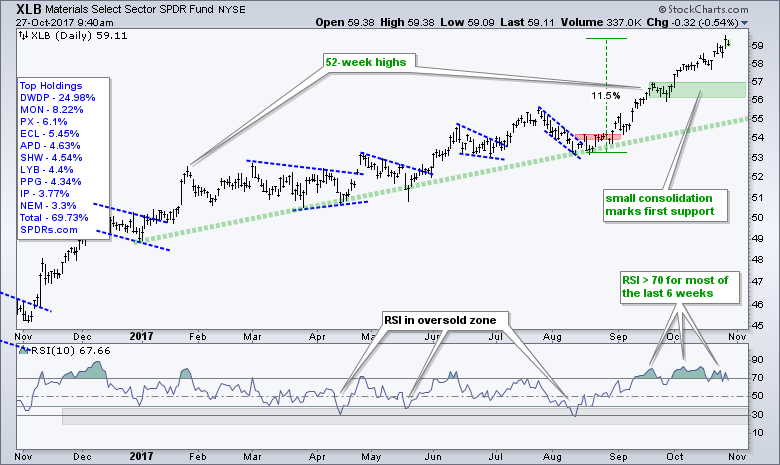
XLB Jumps to Fresh High
I keep marking the first support levels to watch on a pullback, but many of the sectors simply continue higher. The Materials SPDR (XLB) broke out in the second half of August and zoomed higher the last nine weeks. The pullbacks during this zoom were just 3 to 5 days and 1-2%. Nevertheless, I will keep the first support level in the 56-57 area.
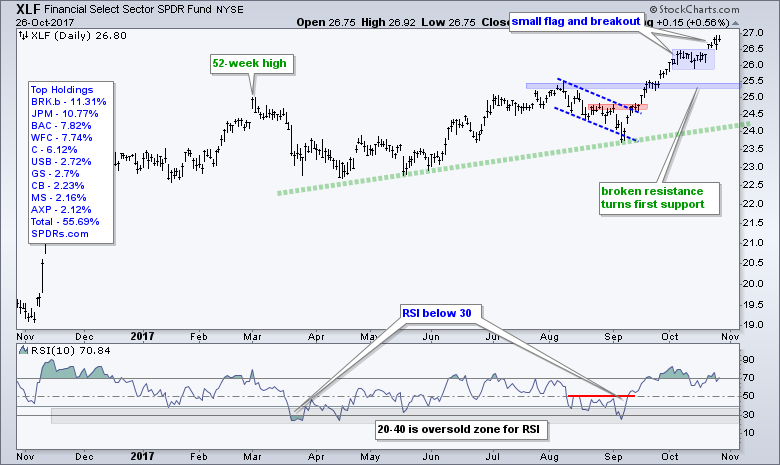
XLF Breaks out of Flag
The Financials SPDR (XLF) surged to a new high in mid October and then formed a flat flag. Banks caught another bid as the 10-yr T-Yield ($TNX) surged again this week and XLF broke out of the flag pattern with a gap. I could say that the gap and breakout zone mark the first area to watch for signs of failure, but the long-term trend is up and I prefer to ignore short-term bearish scenarios during long-term uptrends. Note that the Art's Charts ChartList shows KRE and IAI with flag breakouts.
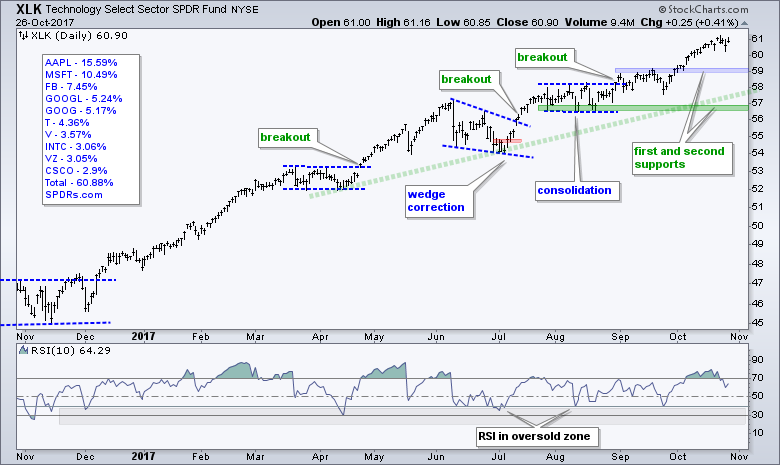
XLK and XLI Extend with New Highs
The Technology SPDR (XLK) hit a new high with the recent move above 61 and then stalled out the last few days. I do not think we should read too much into this stall because it is just a few days and XLK will likely hit another new high today when GOOGL, MSFT, INTL and AMAT pop on the open.
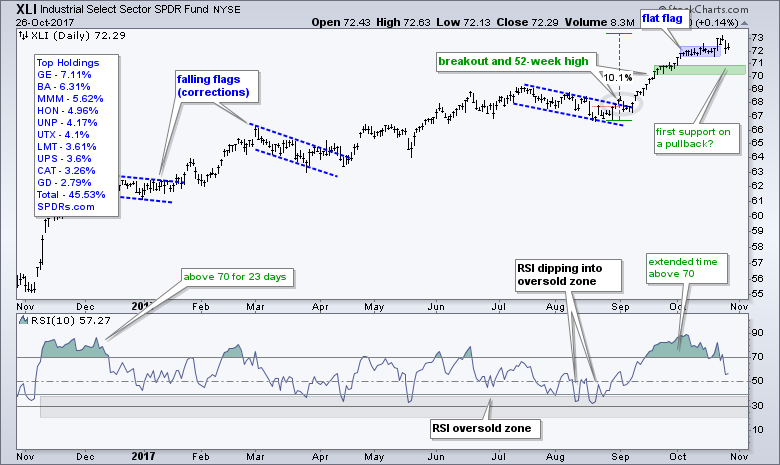
The Industrials SPDR (XLI) broke out of its tight consolidation with a surge last Friday and then fell back into the consolidation. It may seem negative that the breakout did not hold, but we need to give XLI a little wiggle room after a 10% advance. This is why I am setting the first support zone in the 70-70.5 area.
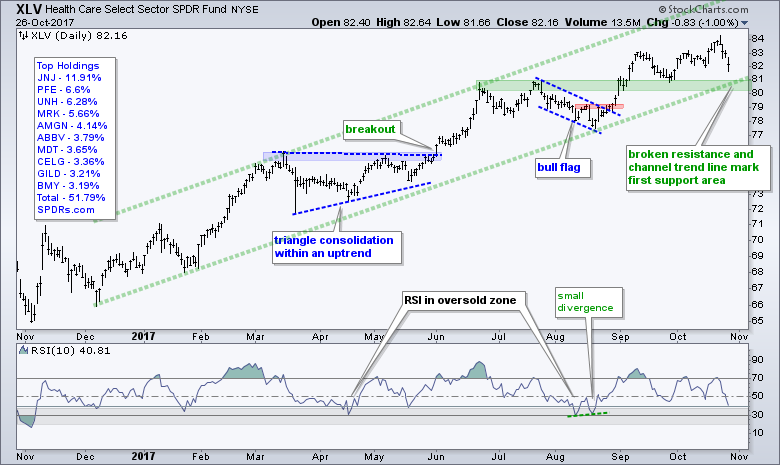
XLV Falls Towards First Support Zone
The Health Care SPDR (XLV) pulled back rather sharply over the last three days as the White House addressed the opioid crisis. This pullback is nearing an interesting point as price falls towards support in around 80-81 and RSI(10) hits 41. The long-term trend is up and this means pullbacks are viewed as opportunities. Thus, I would be on alert for some sort of short-term reversal as XLV nears 81. The Art's Charts ChartList shows RSI(10) hitting its lowest point of the year for the Biotech iShares (IBB) and the Biotech SPDR (XBI). http://www.stockcharts.com/articles/arthurhill/charts
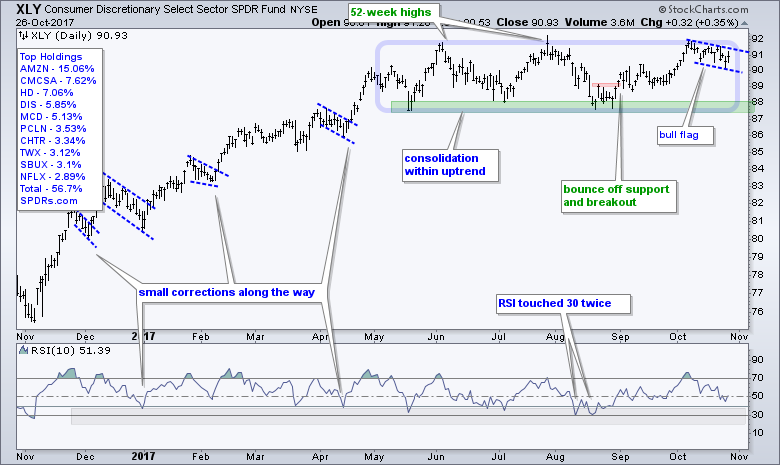
XLY Set to Challenge Flag Line
The Consumer Discretionary SPDR (XLY) is likely to open strong on the heels of a big beat from Amazon, its largest component (~15%). Overall, the big trend is up and the ETF has been consolidating with a trading range since June (kind of like AMZN). A falling flag formed the last two weeks and a breakout at 91.5 would open the door to new highs.
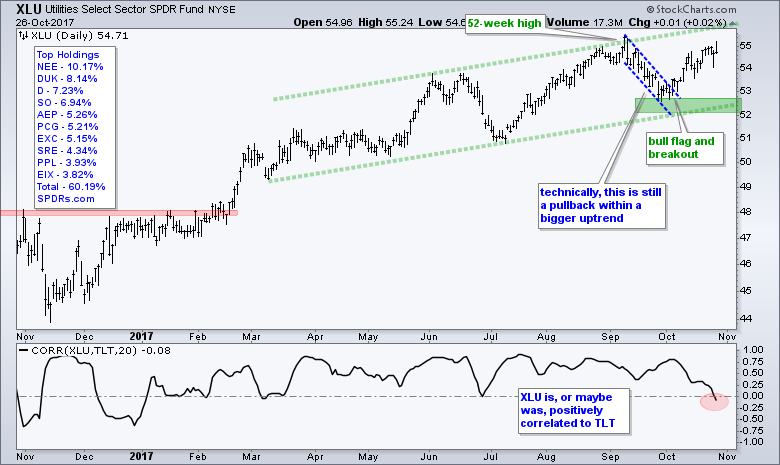
Utilities Defy Bonds in October
Despite a sharp decline in the 20+ YR T-Bond ETF (TLT) this month, the Utilities SPDR (XLU) moved sharply high with a 3% gain in October. The overall trend has been up for some time and the short-term trend reversed with the early October breakout. The late September low and channel line mark key support in the 52-53 area. Despite the uptrend, I am a bit wary of utilities for two reasons. First, we are in a bull market and this favors offensive sectors, not defensive sectors. Second, we appear to be in a rising rate environment and this often leads to underperformance from utilities.
Consumer Staples Remains the Weakest Link
The Consumer Staples SPDR (XLP) remains the weakest of the nine sector SPDRs. XLP hit an eight month low on Wednesday and the Consumer Staples %Above 200-day EMA (!GT200XLP) is the lowest of the nine sectors. This indicator hit its lowest level of the year and the majority of stocks in this sector are in long-term downtrends. Also notice that staples tend to underperform in a rising rate environment and a bull market.
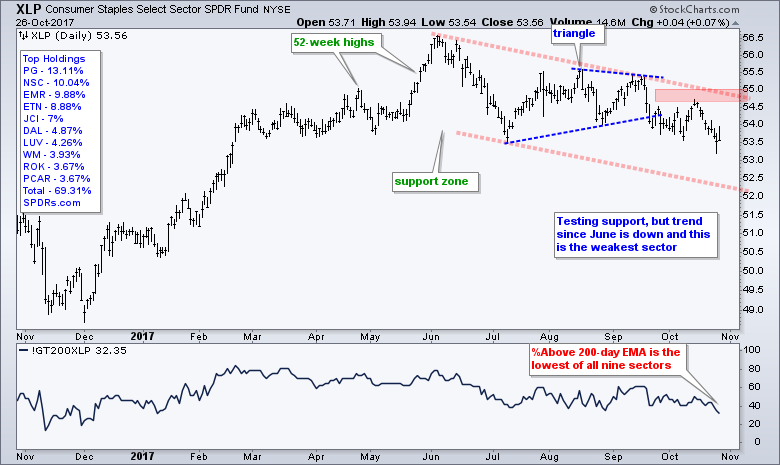
Charting note: You can chart the %Above 200-day EMA for each sector. Simply change the sector symbol at the end: !GT200XLP for Staples, !GT200XLE for energy, !GT200XLK for technology.
Brent Hits New High and Outperforms WTI
I did not put the Energy SPDR (XLE) as the weakest sector because XLE and the Oil & Gas Equip & Services SPDR (XES) have reached potential reversal areas. First, let's look at December Brent (^BZ17) and December Light Crude (^CLZ17). The first chart shows the US Brent Oil ETF (BNO) with December Brent in the lower window. December Brent extended its uptrend this week and hit a 52-week closing high on Wednesday. The intraday high on January 3rd is slightly higher than Wednesday's high. The uptrend in Brent is net positive for the energy sector and I am marking support at 55.
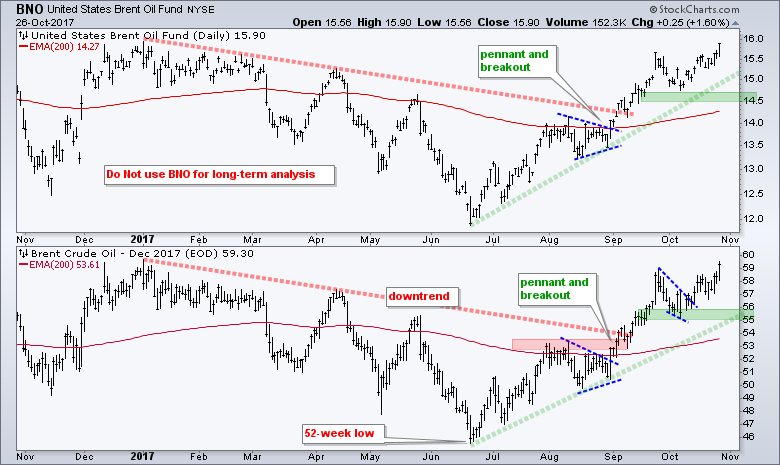
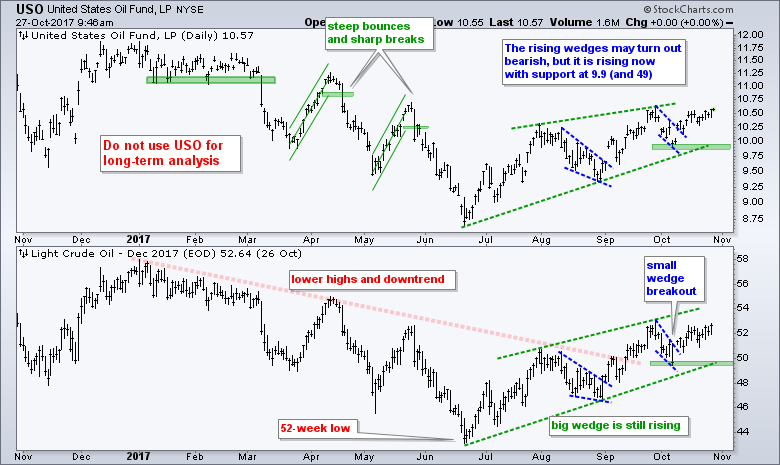
The next chart shows the USO Oil Fund (USO) and December Light Crude, the latter is the focus for analysis. I was skeptical of the green rising wedge in Light Crude, but the trend is clearly up as long as this wedge rises. Crude broke out of a smaller blue wedge earlier this month and this breakout is holding. In fact, it looks like crude is poised to extend its uptrend. Key support is set at 49. Before leaving these two charts, notice how Brent is MUCH stronger than Light Crude. Brent is close to the January high and Light Crude is still 10% below this high.
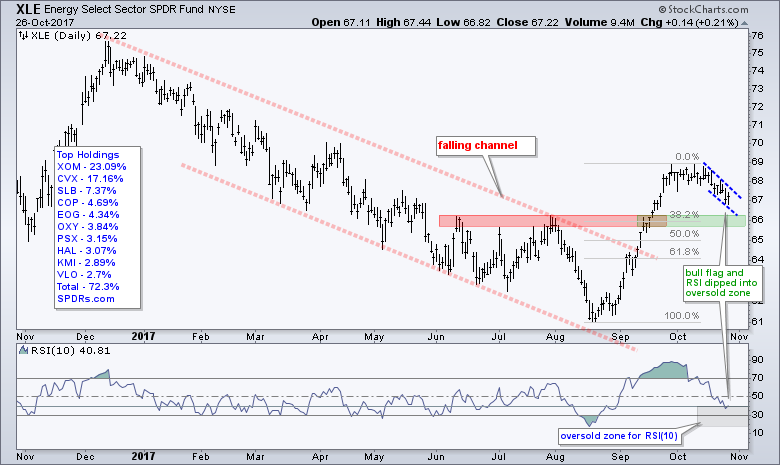
XLE and XES Hit Potential Reversal Zone
The Energy SPDR (XLE) fell back over the last two weeks and is nearing the breakout zone around 66. Also notice that RSI(10) dipped below 40, which put it in the oversold zone. Assuming a long-term uptrend, this means we have a pullback and a potential opportunity. A move above 67.5 would break flag resistance and argue for a continuation of the prior surge.
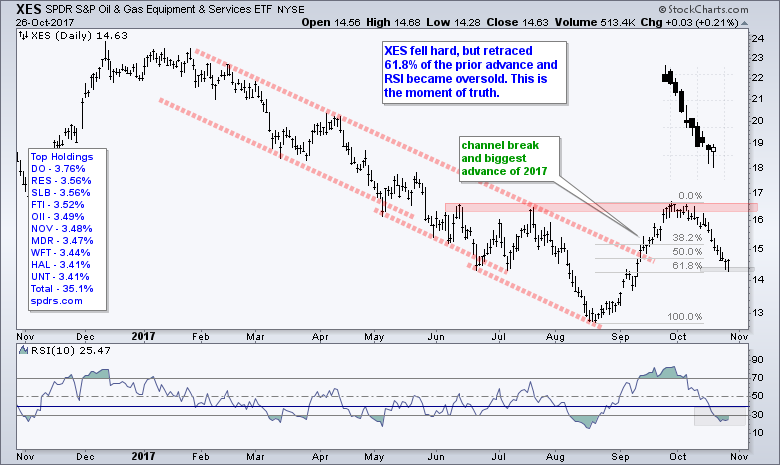
It is hard to get too excited about oil and the energy sector when stocks like Schlumberger (SLB), Baker Hughes (BHGE), Halliburton (HAL) and Weatherford International (WFT) hit 52-week low recently. However, there are some with bull flags working (EOG, CRZ, NBL) and others are holding above their breakouts (RIG, RDC, DO). The Oil & Gas Equip & Services SPDR (XES) fell hard with the new lows in the big players, but is currently in a reversal zone marked by the 50-62% retracements. RSI(10) also dipped below 30 as a couple of hammers formed on the candlestick chart (shown in cutout). Even though there are six other sectors ahead of energy in my preference list, the setup is here so we should pay attention in the coming days.
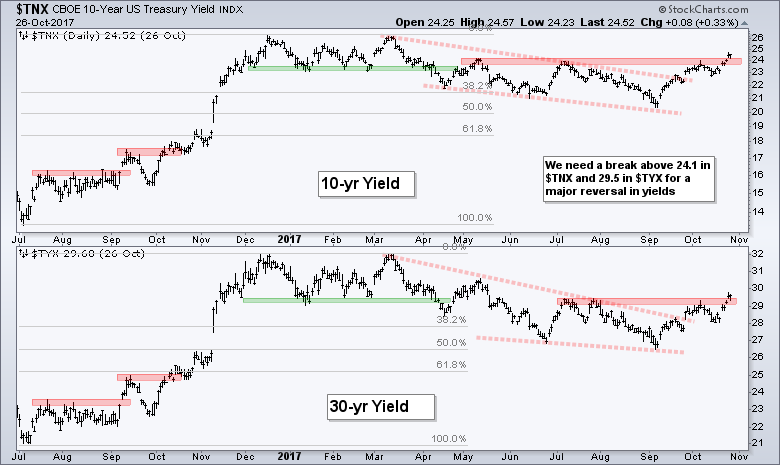
TLT Tests 200-day as $TNX Breaks Out
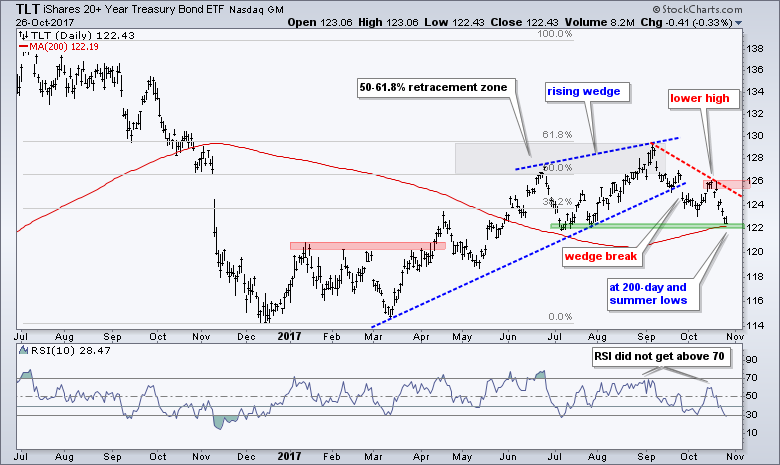
The 20+ YR T-Bond ETF (TLT) broke the wedge line with a sharp decline in September and extended its move with further weakness in October. The wedge break signals a continuation of the prior decline (July to December 2016) and targets a move well below 114. There is a chance of support at current levels because TLT is at the 200-day SMA and the summer lows. I am setting resistance at 126 and would not take a bounce seriously unless TLT can close above this level.
The next chart shows the 10-yr T-Yield ($TNX) breaking above its May-July high and the 30-yr T-Yield ($TYX) breaking above its summer highs. These resistance breakouts follow the wedge breaks in September and signal a continuation of the prior advance (July to December). This breakout targets a move above 30 (3%) in the 10-yr. Further strength in yields would likely be negative for bond proxies (utilities) and gold, but positive for banks and the Dollar.
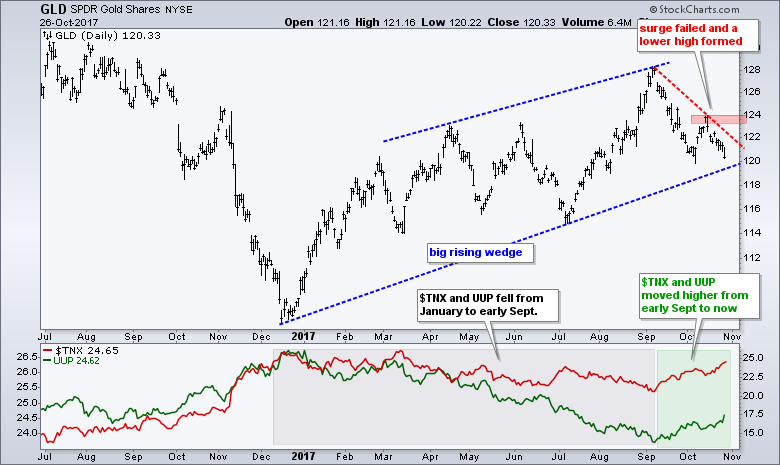
Gold Fails to Hold Upturn and Breakout
The continued rise in the 10-yr T-Yield ($TNX) and the US Dollar ETF (UUP) is wreaking havoc on gold. The chart below shows the Gold SPDR (GLD) surging in mid October and failing to hold this surge after a sharp decline below 121 this week. Technically, the big blue wedge is still rising, but I do not see gold moving higher as long as the 10-yr yield and Dollar move higher.
Dollar Breaks Out as Yield Differentials Grow
I was waiting for a break above the Raff Regression Channel to turn bullish on the US Dollar ETF (UUP), but I think this week's move is enough to turn bullish so I did some redrawing on the chart. The five-day move (1.69%) is the biggest five-day of the year so something is clearly happening. I am not a big fan of the head-and-shoulders pattern, but it is there and there is a breakout this week. More importantly for me, the US-German and US-Japanese yield differentials continue to widen in favor of US yields. This makes Dollars more appealing and this is bullish for the Dollar.
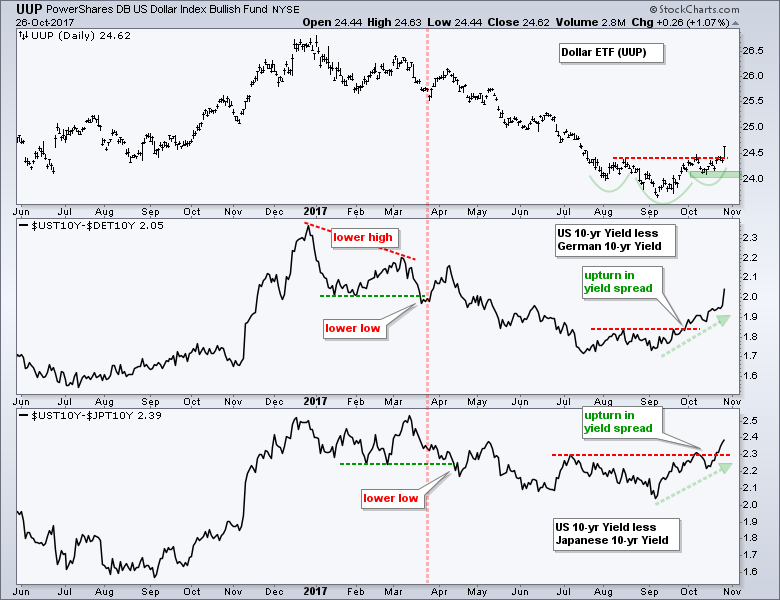
Chart Notes and Observations
- Link to Art's Charts ChartList
- The Home Construction iShares (ITB) hit another new high this week.
- The Retail SPDR (XRT) bounced off the 61.8% retracement and now needs to hold 40.
- The Cyber Security ETF (HACK) turned up near the breakout zone with a gap on 20-Oct and this gap is holding for the most part.
- FDN formed a flat flag the last four weeks. This is a bullish continuation pattern.
- IGN continues to struggle with a fall back this week. A close below 45.7 would reverse the uptrend here.
- The Semiconductor SPDR (XSD), Semiconductor iShares (SOXX) and Software iShares (IGV) hit new highs this week.
- The Broker-Dealer iShares (IAI) and Regional Bank SPDR (KRE) broke out of their flag patterns.
- The Mortgage REIT ETF (REM) fell hard, but is already oversold and in the middle of its triangle consolidation.
- The REIT iShares (IYR) fell hard and is testing uptrend support. RSI is below 30 for the first time since mid March.
- The Airline ETF (JETS) peaked below the July high and broke channel support with a sharp decline this week. Looks bearish.
- The Shipping ETF (SEA) failed to hold the break above 12 and broke wedge support with a sharp decline this week. Looks bearish.
- The Solar Energy ETF (TAN) bounced off support in late September and hit a new high this week.
- The Biotech iShares (IBB) became oversold as RSI(10) dipped to its lowest level of the year. The long-term trend is still up. (ditto for XBI)
- The Medical Devices ETF (IHI) hit a new high to lead healthcare and MDT surged above its 50-day SMA.
- The Oil & Gas Equip & Services SPDR (XES) fell hard, but retraced 61.8% of the prior advance and RSI became oversold. This is the moment of truth.
- The Gold Miners ETF (GDX) failed to hold its breakout and broke wedge support this week.
- The Metals & Mining SPDR (XME) continues to struggle after the early October wedge break, but the overall trend remains up and the breakout is largely holding.
- The Base Metals ETF (DBB) hit a new closing higher and the Aluminum ETN (JJU) surged to a new high this week.
******************************************************
ETF Master ChartPack - 300+ ETFs organized in a Master ChartList and in individual groups.
Follow me on Twitter @arthurhill - Keep up with my 140 character commentaries.
****************************************
Thanks for tuning in and have a good day!
--Arthur Hill CMT
Plan your Trade and Trade your Plan
*****************************************


