.... Bonds, Gold and the Dollar
.... XME Holds Breakout with Bullish Pattern
.... Medtronic Hits Reversal Zone with Selling Climax
.... Old School Tech Stocks Take the Lead
.... Facebook and Amazon Stall
.... Uptrends in Alphabet and Apple Slow
.... Palo Alto Forms Bull Flag ....
The short-term uptrend in the Dollar and short-term downtrend in Treasury bonds are weighing on Gold. Gold, however, is testing a short-term breakout after a throwback to the breakout zone. The chart below shows the Gold SPDR (GLD), the 20+ YR T-Bond ETF (TLT) and the US Dollar ETF (UUP) as line charts with dots marking the closing prices. You can click this chart to open it in SharpCharts and see the settings. The top window shows GLD reversing at the 61.8% retracement and breaking out of a Raff Regression Channel in mid October. GLD fell back to this breakout zone and this is the moment-of-truth for the breakout. A close below 121 would fully negate the breakout and call for a reassessment.
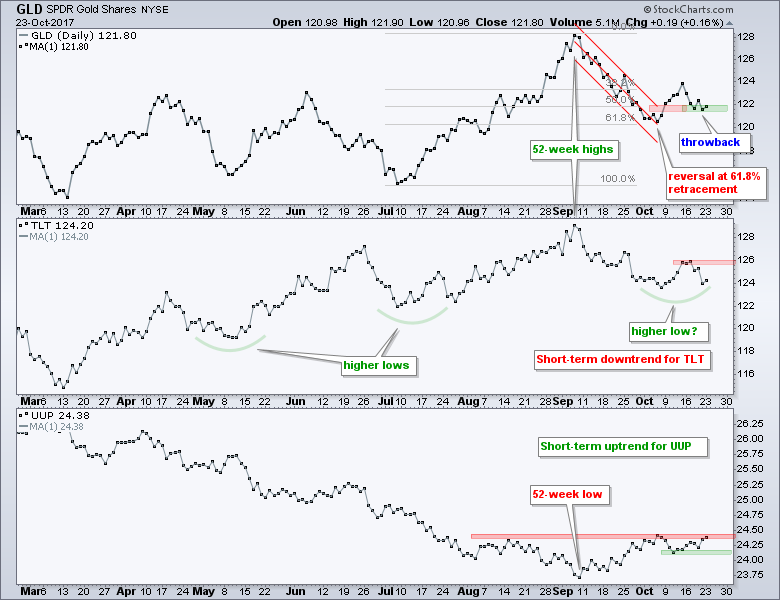
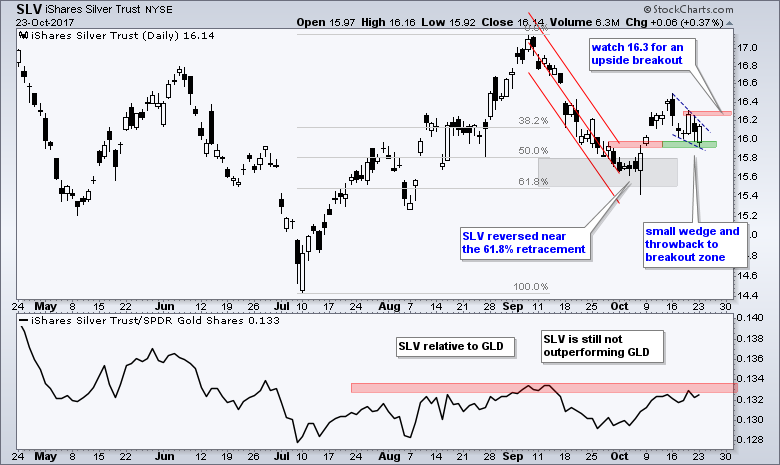
The middle window shows TLT with a short-term downtrend since early September and a long-term uptrend in 2017. Yes, the chart shows higher lows in May and July and a 52-week high in September. Last week's highs mark short-term resistance at 126 and a breakout here is needed to reverse the short-term downtrend. The lower window shows UUP with a short-term uptrend since early September. Notice that the short-term downtrend in TLT and the short-term uptrend in UUP weighed on gold the last six weeks. The mid October lows mark short-term support for UUP and a break below this level would reverse the short-term upswing. The next chart shows the Silver ETF (SLV) testing its breakout with a small falling wedge.
XME Holds Breakout with Bullish Pattern
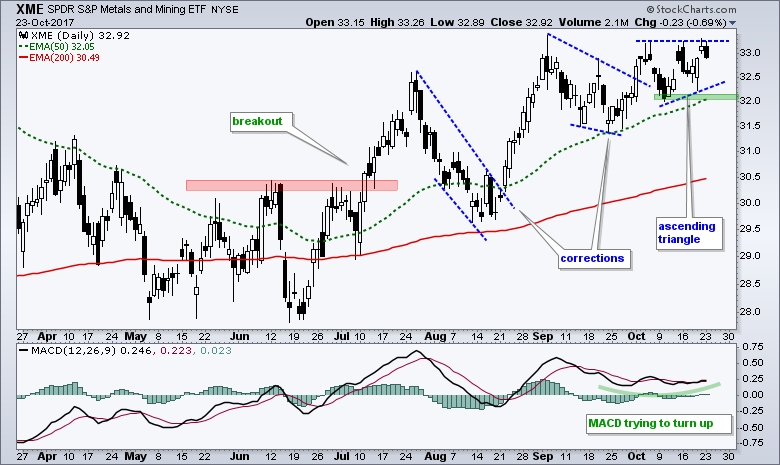
The Metals & Mining SPDR (XME) continues to show promise with an uptrend and a small bullish consolidation. XME broke out with a big move in July, corrected twice and broke out of these corrections. The ETF is struggling after the last correction breakout in early October, but an ascending triangle is taking shape the last few weeks. This is a bullish continuation pattern and a breakout at 33.3 would keep the uptrend alive. Chartists can use the pattern lows to mark support in the 32 area and re-evaluate on a close below 32. I would love to highlight RS and FCX, but they report earnings in a few days and I prefer to wait until after the reports.
Medtronic Hits Reversal Zone with Selling Climax
The chart for Medtronic is about as close to a bottom pick as I will get. In general, I try to avoid stocks when the 50-day EMA is below the 200-day EMA. Sometimes, however, the 50-day is below the 200-day EMA, but the decline still looks like a correction within a bigger uptrend. I am not showing the EMAs for MDT because I want to keep the chart clean and simple. The stock surged some 27% from the January low to the June high and then retraced 50-61.8% of this advance with a decline back to the 77 area. Even with this double-digit decline, MDT is still up over 12% year-to-date.
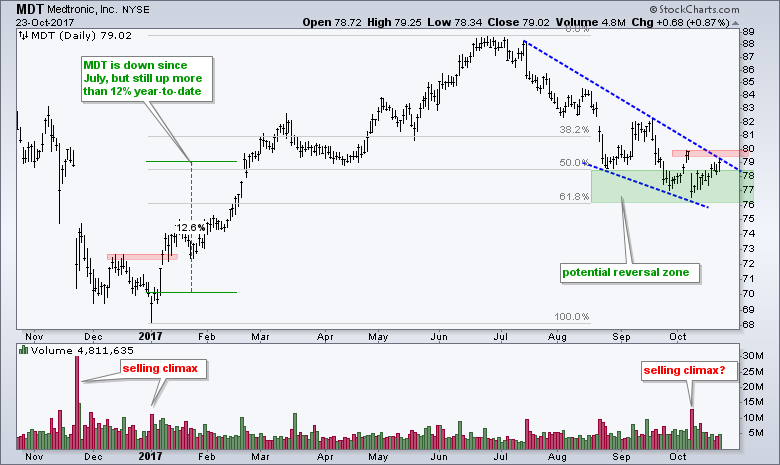
The stock caught my eye because the falling wedge is typical for a correction within a bigger uptrend and the retracement amount is normal for a correction. Think two steps forward and one step backward. In addition, the stock gapped down and fell on the highest volume of the year on October 9th. This looks like a selling climax of sorts and the stock is starting to fill the gap. A breakout at 80 would complete the fill and break wedge resistance. Also note that sector and industry group dynamics are bullish. The Health Care SPDR (XLV) and the Medical Devices ETF (IHI) just hit new highs.
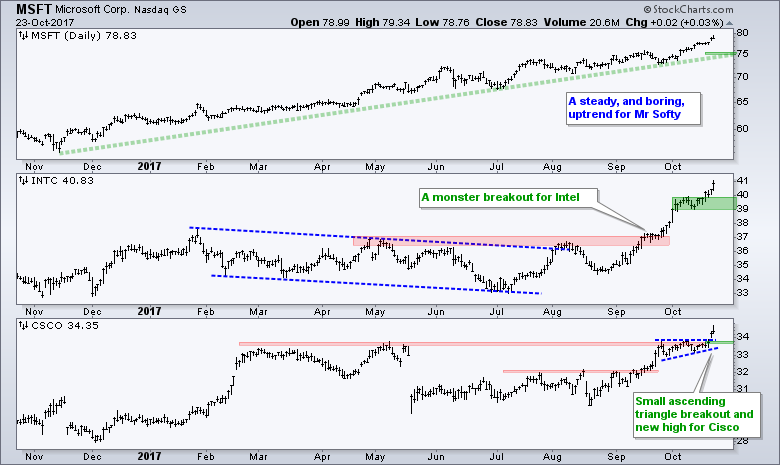
Old School Tech Stocks Take the Lead
We are right in the middle of earnings season and three old school tech stocks are leading the pack. The chart below shows all three hitting fresh 52-week highs on Monday. Microsoft (MSFT) has been in a steady uptrend since November. Intel (INTC) was lagging into the summer, but turned up in July and broke out to new highs in September. Cisco (CSCO) broke first resistance in mid September and broke out to new highs last Friday. Intel and Microsoft report earnings on October 26th, while Cisco reports on November 15th. The green areas on the far right of the chart mark the first support zone to watch on a pullback. We should keep these three in our watchlists and watch for pullbacks and bullish setups.
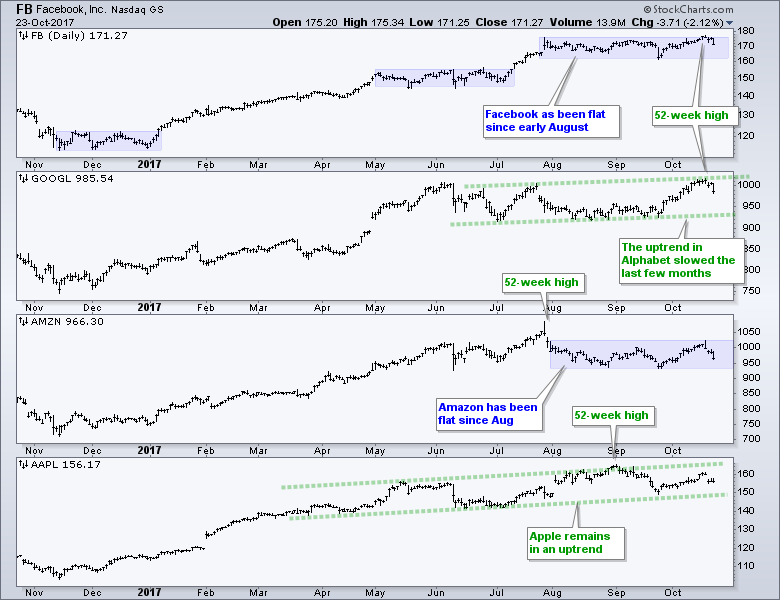
Facebook and Amazon Stall as Uptrends in Alphabet and Apple Slow
The next chart shows the other four social-tech titans: Facebook, Alphabet, Amazon and Apple. Actually, when you think about it, Microsoft, Intel and Cisco are true tech companies that derive most of their revenue from technology-related products. Facebook and Alphabet sell ads, Amazon sells everything under the sun and Apple sells phones. There is clearly some technology involved, but these four companies are more like consumer oriented. Admitted, Amazon with AWS may be the exception.
The chart below shows Facebook and Alphabet hitting new highs last week and leading the group. Apple hit a new high on September 1st and Amazon hit a new high way back on July 27th. Note that the 50-day EMAs are above the 200-day EMAs for all four and all four are trading above their rising 200-day EMAs. I think it is safe to say that the long-term trends are up. Assuming the long-term trends are up, I am going to avoid the temptation to look for bearish patterns. I want to look for bullish setups and use pullbacks as opportunities when the long-term trends are up. Thus, pullbacks to support areas or trend lines are viewed as more of an opportunity than a threat.
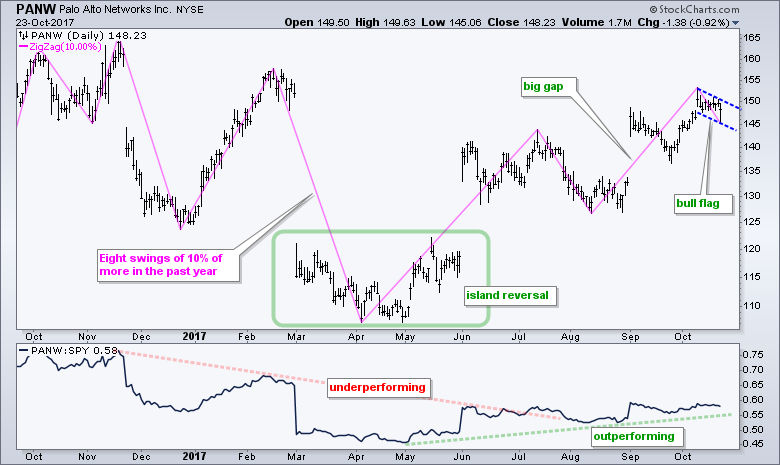
Palo Alto Forms Bull Flag
The chart for Palo Alto Networks is probably enough to make most traders run for the hills. There are eight swings of 10% or more in the last twelve months and four pretty big gaps (two down and then two up). Clearly, this is not a stock for the faint at heart. As far as I am concerned, the trend reversed with the island reversal and continued with the September gap. Thus, PANW has gone from downtrend to uptrend in the past year. Short-term, the stock formed a falling flag the last nine days and a break above 150 would signal a continuation higher.
******************************************************
ETF Master ChartPack - 300+ ETFs organized in a Master ChartList and in individual groups.
Follow me on Twitter @arthurhill - Keep up with my 140 character commentaries.
****************************************
Thanks for tuning in and have a good day!
--Arthur Hill CMT
Plan your Trade and Trade your Plan
*****************************************


