.... Small-cap ETFs Form Falling Flags
.... XLE Stalls as XES Breaks Down
.... Watching Two Timeframes for Oil
.... Shipping ETF Turns Up
.... Oracle Bounces off Support ....
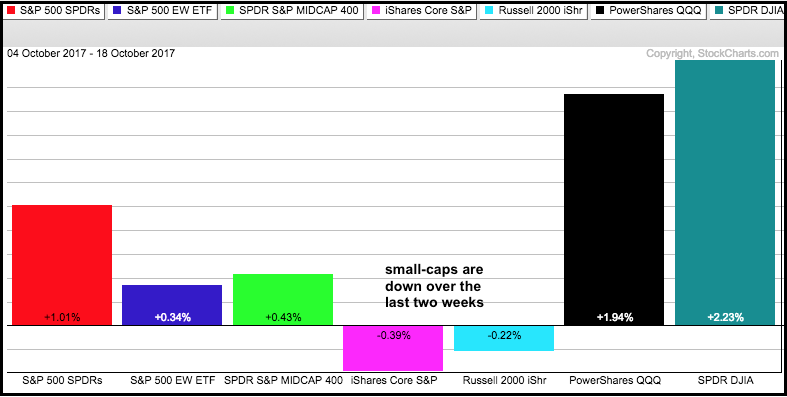
There are lots of small consolidations on the charts as the market digests the gains from mid August to early October. The S&P 500 SPDR (SPY) and Nasdaq 100 ETF (QQQ) continued to new highs on Wednesday, but the Russell 2000 iShares (IWM) and S&P SmallCap iShares (IJR) peaked in early October. Well, I would not call this a significant peak because both are just 1% below their early October highs, which were 52-week highs. The PerfChart below shows IJR and IWM with small losses over the last two weeks. Meanwhile, QQQ and DIA continued hgiher the last two weeks and added another 2%.
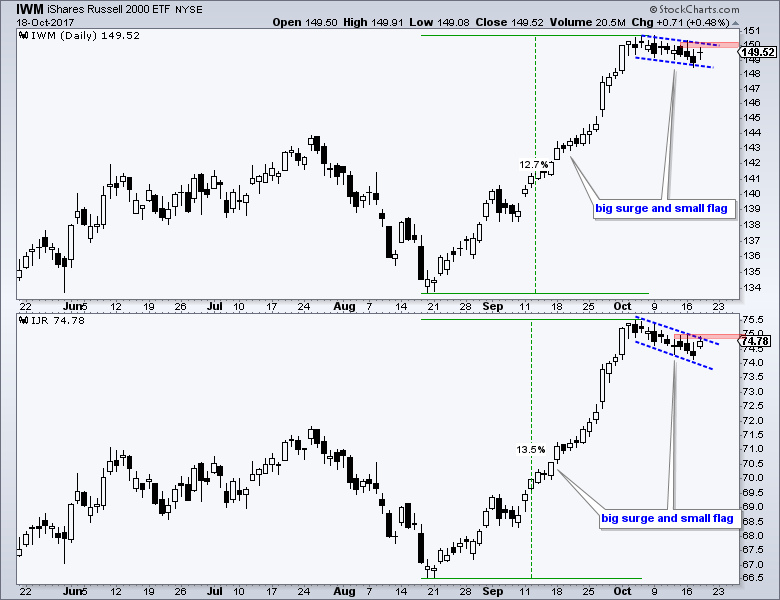
The chart below shows IWM and IJR surging over 12% from mid August to early October and then correcting with falling flags the last few weeks. Flags are typically continuation patterns that represent a rest within the bigger trend. These flags are bullish continuation patterns because the prior move was up. Short-term resistance for these flags is marked with the red zones. Breakouts here would signal an end to the pullback and a resumption of the uptrend. Keep in mind that the short-term trends are down as long as the flags fall and this means small-caps are currently undergoing a correction after the big advance.
XLE Stalls as XES Breaks Down
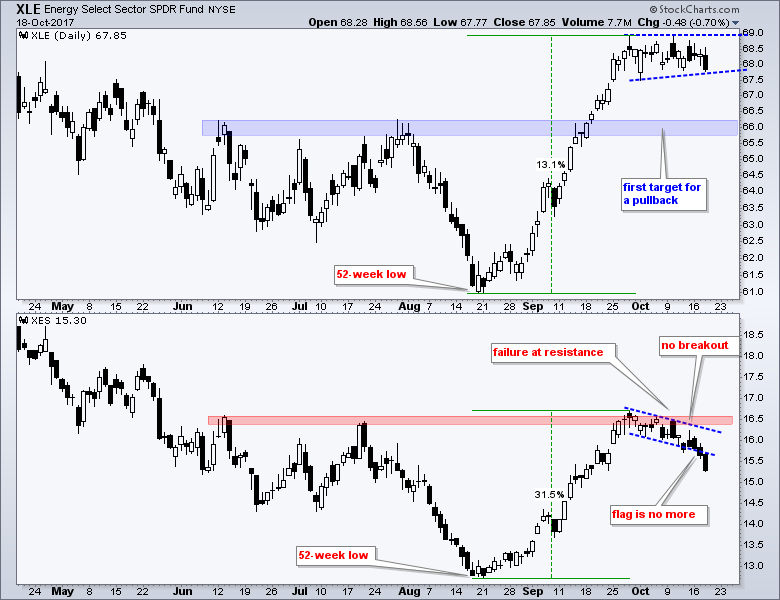
The next chart shows the Energy SPDR (XLE) and the Oil & Gas Equip & Services SPDR (XES). First, notice that XLE surged around 13% from mid August to late September. XES, which is like XLE on steroids, surged over 30% and more than doubled the gain in XLE. XES is the place to be if you are looking for a little leverage in oil. XLE stalled the last few weeks with a pennant or triangle of sorts. These are also continuation patterns and an upside breakout would be bullish. A look at the XES chart, however, suggests an upside breakout is unlikely in XLE. Notice that XES failed at the summer highs and moved below the lower trend line of the falling flag. Thus, the falling flag is no more as XES succumbed to serious selling pressure. The failure in XES could be a bad omen for oil and XLE because stocks in the Oil & Gas Equip & Services SPDR are closely tied to the price of oil.
Watching Two Timeframes for Oil
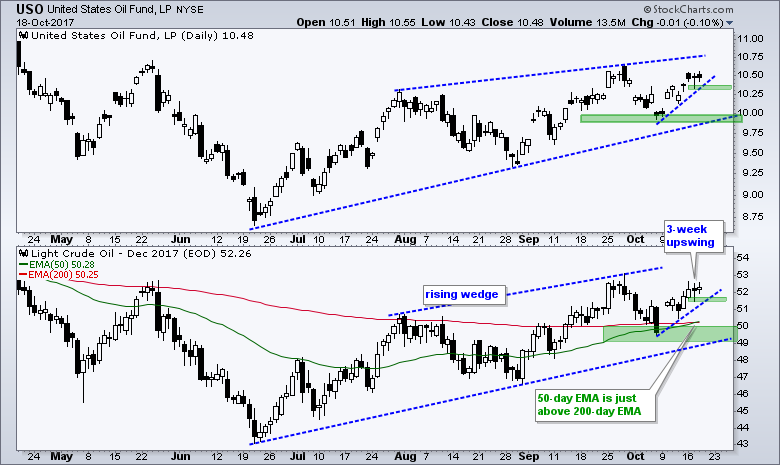
Oil futures are trading lower this morning and this puts my on rising wedge watch. The lower window of the chart below shows December Crude Futures Contract (^CLZ17) holding above is 200-day EMA since mid September. Also notice that the 50-day EMA just crossed above the 200-day EMA. Despite early signs of a long-term uptrend, I remain skeptical because a rising wedge is taking shape since mid June. Rising wedges are typical for counter-trend advances and this could be just a big corrective rally in crude. The October low and lower trend line mark a support zone in the 49-50 area and a break here would reverse the four month uptrend. Chartists looking for an early signal can watch the three week upswing. A close below 51.4 would reverse this upswing.
Shipping ETF Turns Up
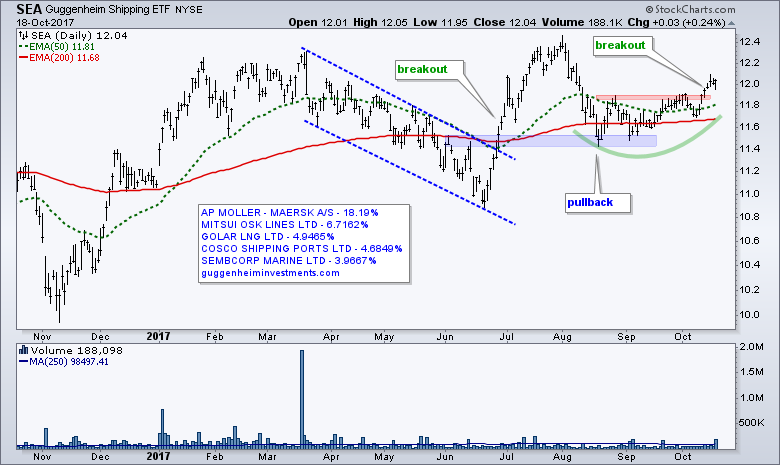
The Guggenheim Shipping ETF (SEA) is showing signs of life with a higher low in August-September and a breakout over the past week. Overall, notice how SEA surged in June-July, pulled back into August and resumed its uptrend with the recent breakout. The 50-day EMA is above the 200-day EMA and the close is above the 200-day. Overall volume on this ETF averages around 100,000 shares per day. Looking at the holdings, the Danish shipping giant Maersk accounts for 18.19% and three of the top four holdings are non-US stocks.
Oracle Bounces off Support
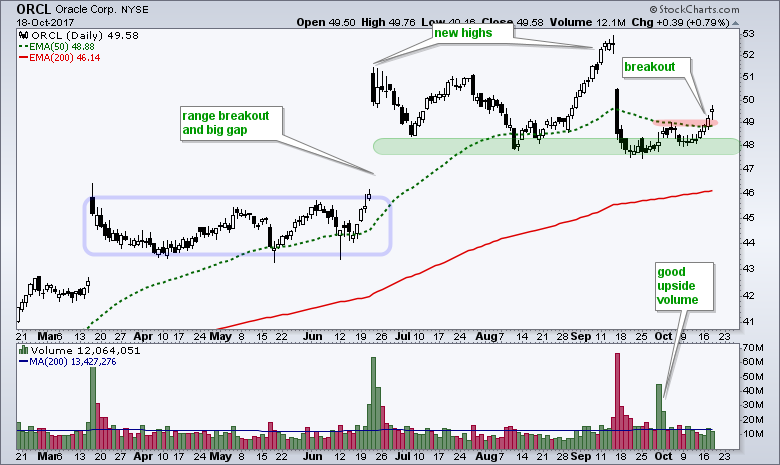
Oracle is part of the Software iShares (IGV) and this is one of the strongest industry group ETFs in the market right now. The chart below shows the stock surging with a massive gap in mid June and hitting new highs again in early-mid September. The stock gapped down from the new high in mid September and fell on high volume. Despite a big uptick in selling pressure, the stock found support in the 48 area and firmed into mid October. Most recently, Oracle turned up and broke above its early October high. With the bigger trend up, this looks like a bullish upturn off support and I would expect new highs in the coming weeks or months. Finding stock setups now is difficult because we are in the middle of earnings season and I do not want to highlight a stock that will report in the next week or two. Oracle reported earnings in mid September so this suggests that the next report will be mid December.
******************************************************
ETF Master ChartPack - 300+ ETFs organized in a Master ChartList and in individual groups.
Follow me on Twitter @arthurhill - Keep up with my 140 character commentaries.
****************************************
Thanks for tuning in and have a good day!
--Arthur Hill CMT
Plan your Trade and Trade your Plan
*****************************************


