 |
.... Large-caps and Mid-caps Hit New Highs |
---- Art's Charts ChartList (updated October 20th) -----
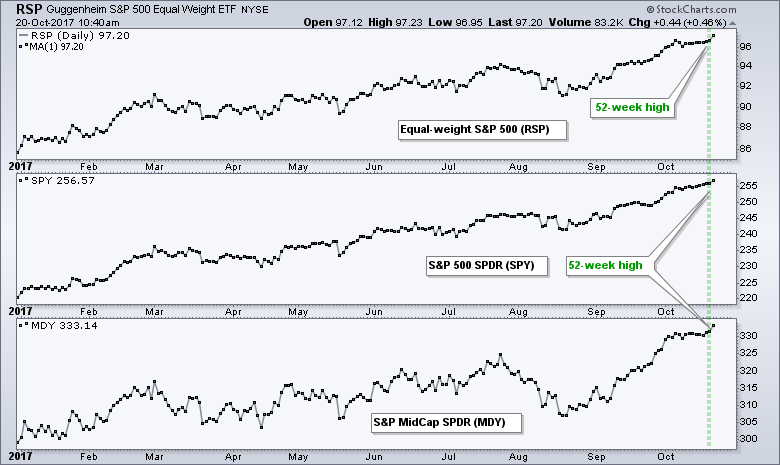
Large-caps and Mid-caps Hit New Highs
After a joint surge in September and new highs in early October, stocks turned mixed the last two weeks with small-caps correcting. These corrections are still relatively mild and many stocks simply continued on their merry way with new highs this past week. The chart below shows the EW S&P 500 ETF (RSP), S&P 500 SPDR (SPY) and S&P MidCap SPDR (MDY) hit new closing highs on Thursday. These ETF represent around 900 of the 1500 stocks in the S&P 1500. In addition, over 70% of stocks in the S&P 1500 are above their 200-day EMAs.
Even though we may fret over short-term overbought conditions, the bull market is doing just fine and participation remains high. Today I will focus on the short-term consolidations in small-caps and several ETFs. These consolidations could be the pause that refreshes because they are looking like bullish continuation patterns.
SPY has been "Overbought" Since mid September
The S&P 500 SPDR (SPY) continued its "overbought" march to new highs this week. The daily change in SPY has been less than 1% since mid September as the ETF simply works its way higher. Note that the daily change exceeded +1% and -1% five times in August and this was the most recent period of above average volatility. The daily Rate-of-Change has ranged between +.80% and -.30% over the last 22 trading days. As my old friend Forest Gump might say: it is as boring as boring gets. SPY is simply inching higher and this tells means buying pressure remains stronger than selling pressure.
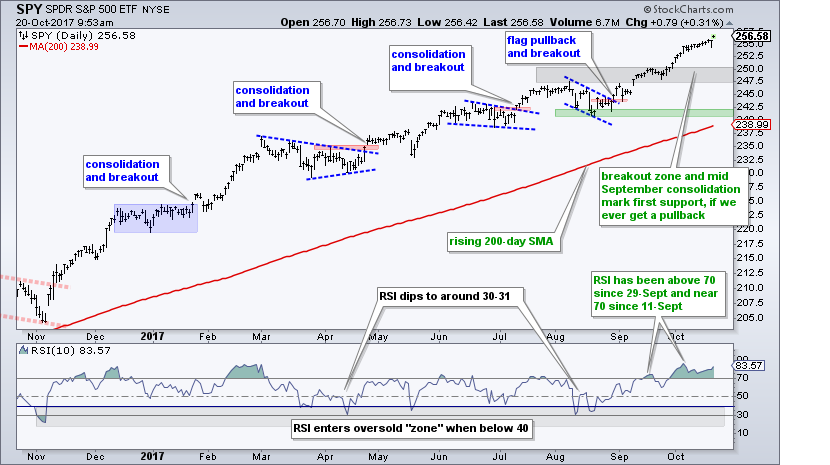
There is nothing new to report on this chart. The trend is up and this favors higher prices, even if the market "seems" overbought. Most of us are guilty of invoking the term overbought after a sharp gain, but it is really a meaningless term in an uptrend. First, overbought conditions are expected in an uptrend. Second, overbought conditions often persist in uptrends. Note that RSI(10) has been above 70 since 29-Sept (15 days) and first exceeded 70 on 13-Sep (27 days ago). I have no idea how long these conditions will last, but I think a pullback would be an opportunity and short-lived.
QQQ Hits Another New High
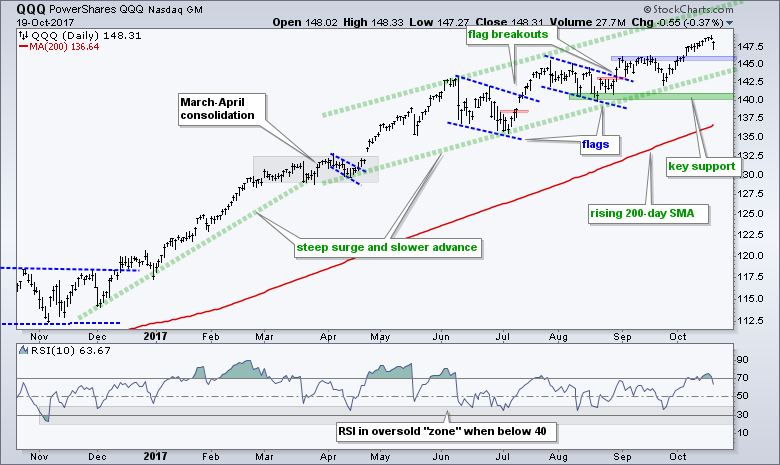
The Nasdaq 100 ETF (QQQ) is also inching higher with a 1-day Rate-of-Change ranging from .50% to -.30% the last ten days. The ETF fell on Thursday because Apple, its biggest component, was down over 2%. This is clearly not enough to affect the bigger uptrend. In fact, QQQ is not even testing its first support zone in the 146 area. Note that broken resistance turns first support in this area. A pullback to this area could create an opportunity to buy at a discount.
Instead of offering my technical take on Apple, I will point you to two videos from two noted technical analysts: Craig Johnson of Piper Jaffray and Robert Sluymer of Fundstrat Global Advisors. They are pretty much in agreement and I agree with their assessments. In addition, I would not want to bet against Apple as the company launches the biggest form factor upgrade to the iPhone in years.
Flags, Pennants, Small Wedges and Short-term Consolidations
The stock market has been mixed the last few weeks and this created a lot of consolidations on the charts. Keep in mind that stocks surged from mid August to early October. Thus, these consolidations represent a rest within an uptrend. Short-term consolidations take the form of falling flags, flat flags, pennants or wedges. The shape of the pattern is really not that important. Chartists just need to ask themselves if the pattern captures the spirit of a consolidation after a sharp advance and mark a resistance level. A break above the resistance level signals an end to the consolidation and a resumption of the uptrend.
The chart below shows three bullish consolidation patterns at various stages. The top window shows the Biotech iShares (IBB) breaking out of a falling flag and then falling back to the breakout zone this week. This pullback is called a throwback and the breakout zone marks the first support level to watch. In other words, be on guard for a successful test and move higher.
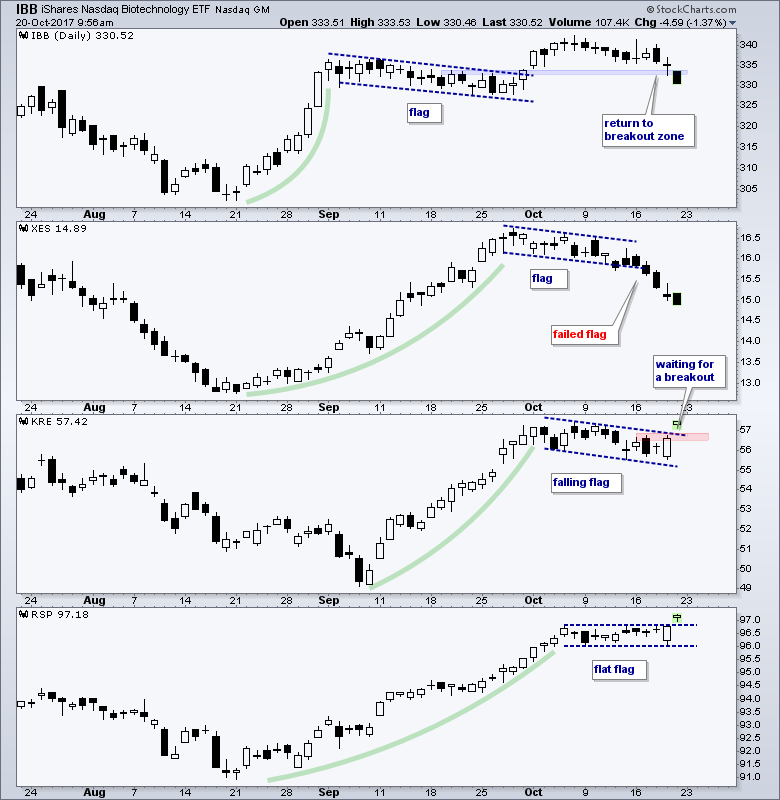 The second window shows the Oil & Gas Equip & Services SPDR (XES) with a falling flag the first two weeks of October. The ETF never broke out and instead broke below the lower trend line over the last few days. This is clearly a failed flag and the pattern is no longer valid.
The third window shows the Regional Bank SPDR (KRE) with a falling flag the last three weeks and a breakout at 57 would be bullish. The bottom window shows the EW S&P 500 ETF (RSP) with a flat flag the last two weeks and a break above the flag highs would be bullish.
Flags, pennants and small wedges are short-term patterns that can last a few weeks. Ideally, we would see a breakout, a continuation higher and a nice gain. The ideal scenario, however, does not always happen. Sometimes there is a breakout and then a pullback into the consolidation. This puts a damper on the breakout signal, but it is not enough to turn bearish. The low preceding the breakout is the important support level to watch. A close below this low would signal a clear failure and warrant a reassessment.
IWM and IJR Remain with Falling Flags
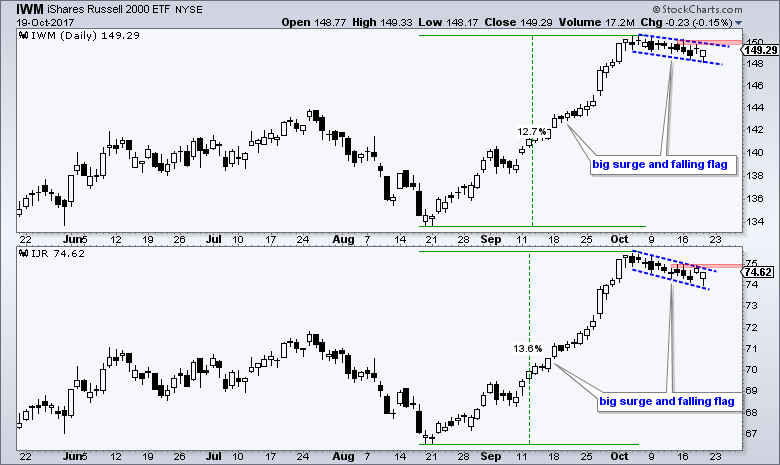
The next chart shows the Russell 2000 iShares (IWM) and the S&P SmallCap iShares (IJR) with falling flags since early October. These corrections are probably normal because small-caps led the advance from mid August to early October and deserved a corrective period. The red zones mark flag resistance and breakouts here would signal an end to the corrections.
XLY Forms Bullish Pennant
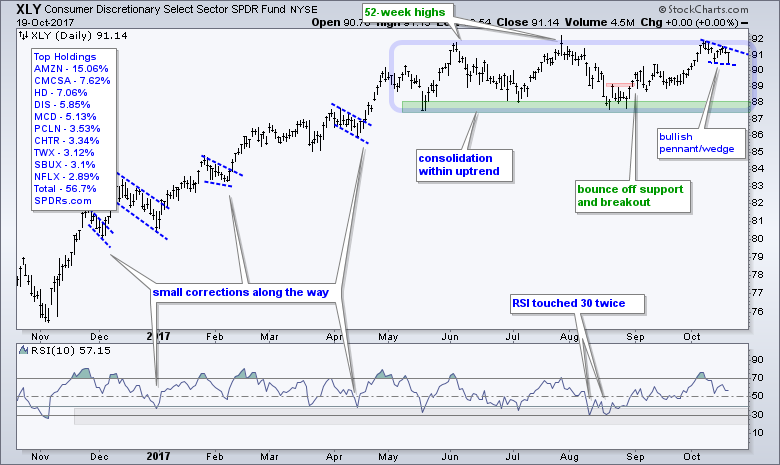
The Consumer Discretionary SPDR (XLY) bounced off support in mid August and advanced to the summer highs in early October. I am NOT calling this a resistance zone because the bigger trend is clearly up and higher highs are expected in an uptrend. XLY fell back over the last two weeks with a wedge or pennant. Pennant looks like horizontal baseball pennants, while wedges slope down. Perhaps it is a falling pennant. Regardless, this is a consolidation within an uptrend and a breakout at 91.5 would open the door to new highs.
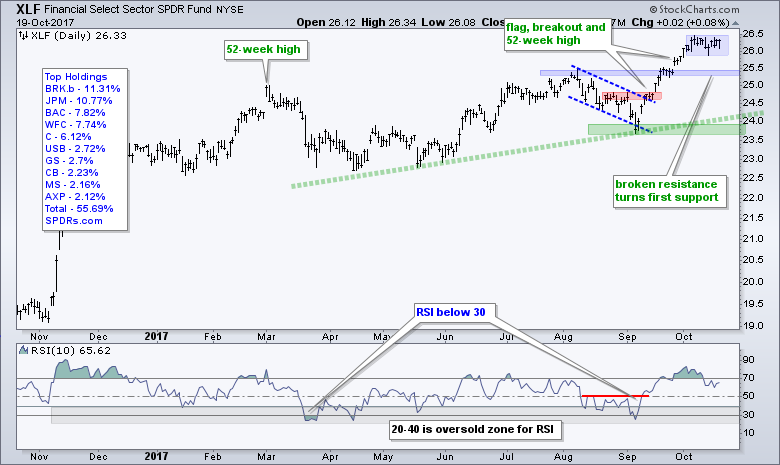
XLF and XLI Consolidate after Big Moves
The Industrials SPDR (XLI) and the Financials SPDR (XLF) surged to new highs in early October and then consolidated with flat ranges the last two weeks. I shaded these blue because trend lines were hard to fit. Again, the spirit of a flat flag is there as both traded flat the last two weeks. Even though they still seem extended, upside breakouts would signal a continuation higher. 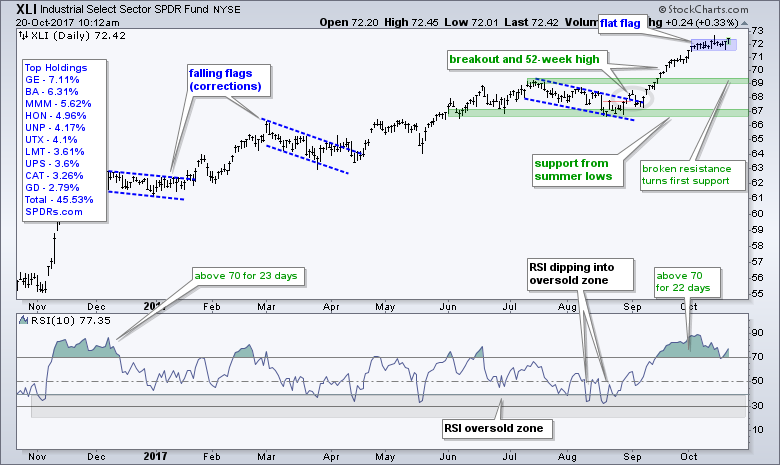
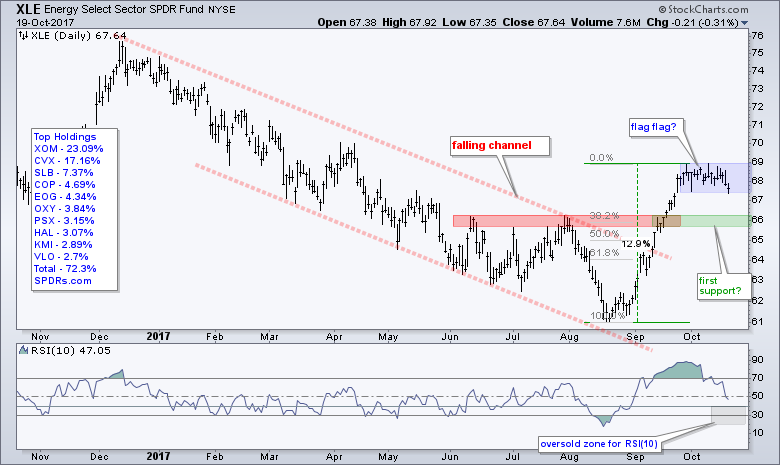
XLE Tests Flag Lows
The Energy SPDR (XLE) surged above 68 in late September and then stalled the last three weeks. The blue shading marks a flat flag as a potential continuation pattern. I am, however, a bit skeptical because the flag in XES failed and oil may be topping. A break below the flag lows would negate the flag in XLE and argue for further weakness, perhaps back to the 66 area. Note that the energy sector is the second weakest sector of the nine and this means there are seven other sectors to consider first! In other words, other areas of the market are far more interesting than energy.
Tech, Healthcare and Materials Lead
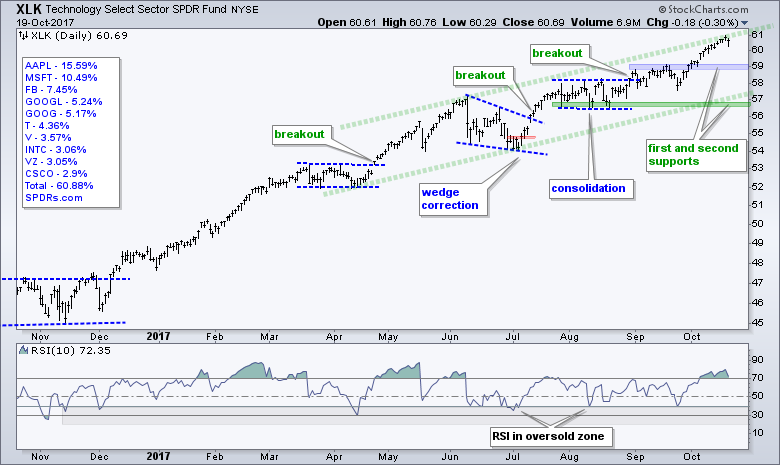
The Technology SPDR (XLK), Health Care SPDR (XLV) and Materials SPDR (XLB) hit new highs this week and they are the current leaders. Note that XLF, XLI, XLY and XLU are not far behind. The first chart shows XLK hitting the upper trend line of a rising channel. Hitting this trend line is the same as RSI moving above 70. It suggests that XLK is getting extended, but this level does NOT mark resistance and the uptrend is the most dominant force. Perhaps, I should have just left it off the chart. :)
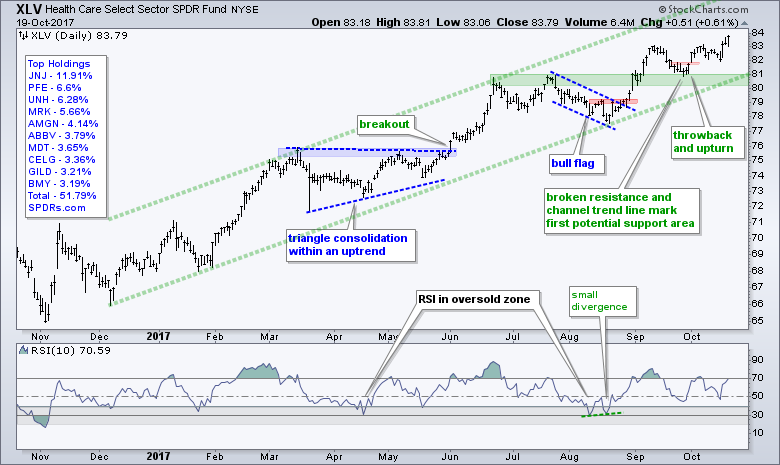
The Health Care SPDR (XLV) surged to a new high this week and this move simply signals a continuation of the mini breakout from late September. Should the current trajectory continue, the upside target in XLV would be in the upper 80s. This target is a guesstimate based on the upper trend line of the rising channel. Broken resistance and the lower trend line mark key support in the 80-81 area for now.
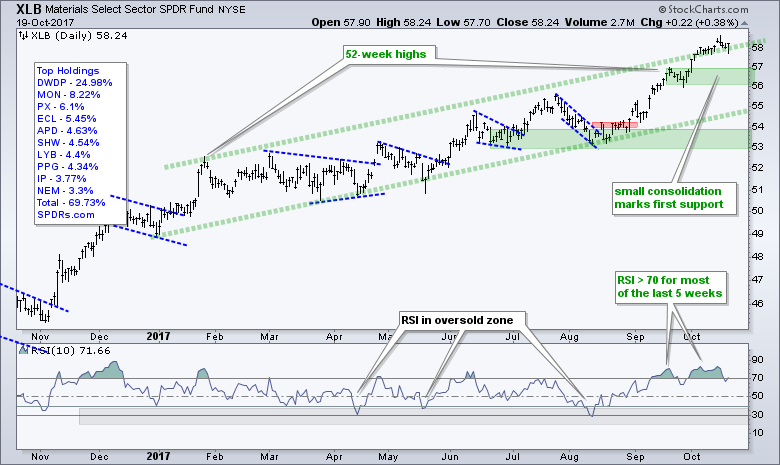
The Materials SPDR (XLB) moved above the upper trend line of a rising channel. This ETF is up around 10% from the mid August lows and still one of the leaders. Notice that RSI has been above 70 for most of the last five weeks. XLB tacked on another 4.5% after first becoming "overbought".
Utilities Lead the Market this Month
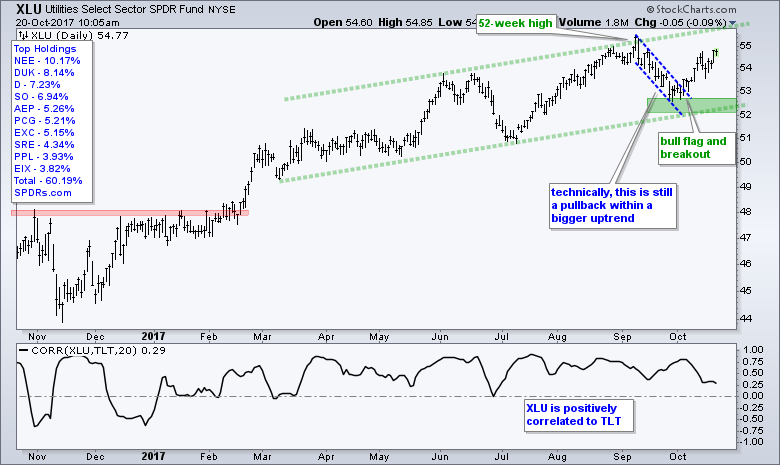
The Utilities SPDR (XLU) is the best performing sector so far this month with a 3.34% gain over the last 14 trading days. On the price chart, XLU broke out of its falling flag pattern on 4-Oct and pretty much never looked back. The flag lows and March trend line mark key support in the 52-53 area. I would put the utilities in seventh place on interesting sectors because it looks like Treasury yields are headed higher and this is negative for utes.
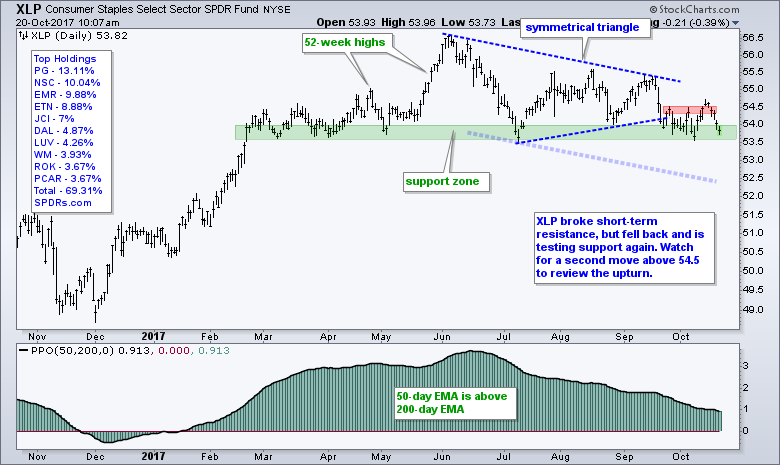
The Consumer Staples SPDR (XLP) remains the weakest of the nine sectors. XLP peaked in mid June and is the only sector with a loss since mid August. The ETF attempted a breakout with a move above 54.5 last Friday, but this attempt failed as it fell back to the support zone. Watch for a second breakout attempt at 54.5 to get this tide turning.
Bearish Wedge for TLT Remains in Play
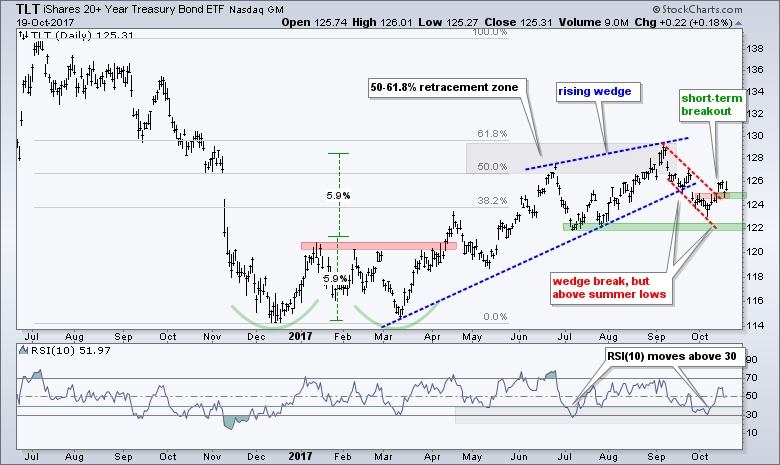
The 20+ YR T-Bond ETF (TLT) got a short-term breakout last Friday with a surge above 125, but fell back this week and it looks like this breakout attempt will fail. A close below 124 would mark a clear failure. This means the bigger rising wedge is in play and the wedge break is long-term bearish. The summer lows mark the last bastion of support at 122 and a break here would officially reverse the 2017 uptrend.
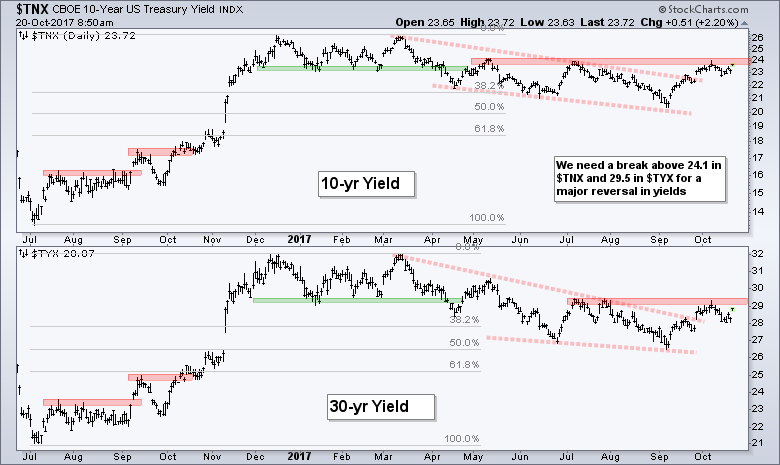
The next chart shows the 10-yr T-Yield ($TNX) breaking its wedge line in late September and challenging the May-July highs around 24 (2.4%). A breakout here would clearly reverse the 2017 downtrend in Treasury yields. The lower window shows a similar picture for the 30-yr T-Yield ($TYX). Note that rising yields would be negative for gold and utilities, but positive for banks and the Dollar.
Gold Breakout is in Jeopardy
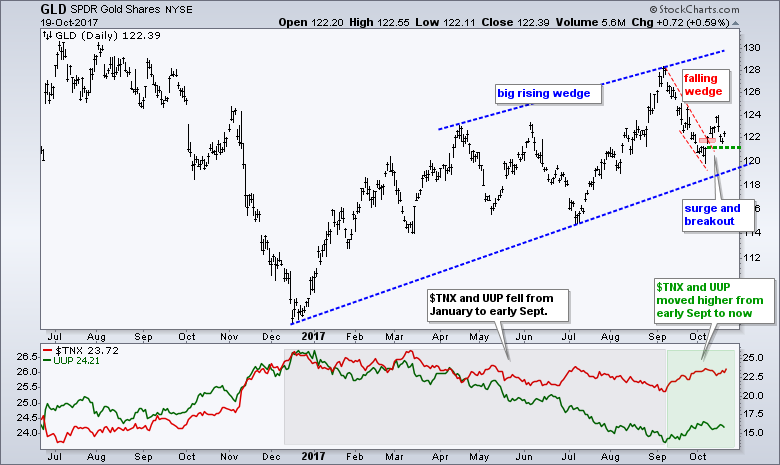
The Gold SPDR (GLD) broke out last week with a surge above 122, but fell back this week and the breakout is under threat. The green dashed line marks the initial surge above the wedge line and a close below 121 would negate the breakout. The blue lines mark a big rising wedge similar to the one seen in TLT. Further weakness below 119 would break the wedge trend line and add one more step to a long-term trend reversal in gold.
Dollar Bounces within Bigger Downtrend
There is no change in the Dollar analysis. Note that TLT peaked in early September, gold peaked in early September and the US Dollar ETF (UUP) bottomed in early September. Should the TLT and UUP trends continue, it would be quite bearish for gold. The chart below shows UUP within a falling channel (Raff Regression Channel). The ETF bounced above 24, but I would like to see a break above the upper channel line before calling a long-term trend reversal in the Dollar. The middle window shows the spread between the US 10-yr yield and German 10-yr yield widening since early September and this is positive for the Dollar.
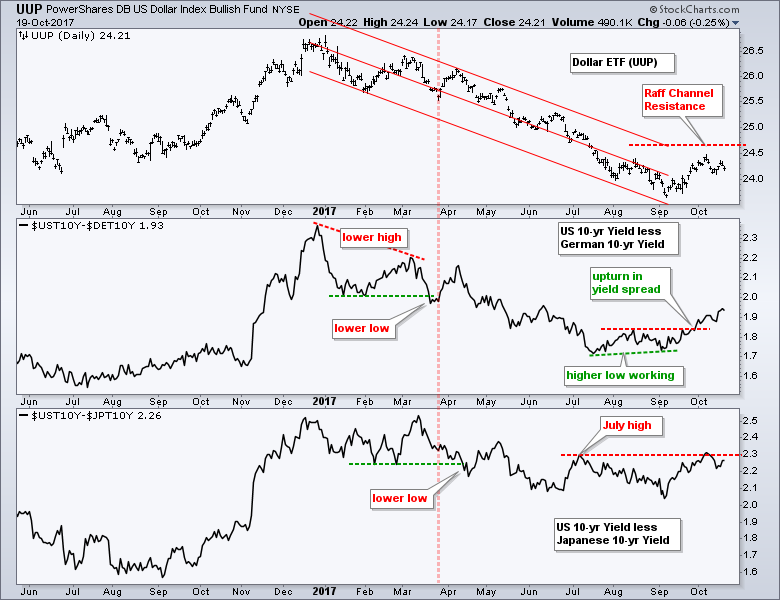
Chart Notes from the Art's Charts ChartList
- ITB surged to a fresh 52-week high this week.
- After a higher high in late September, XRT retraced 50-62% of the prior surge and firmed around 40.
- SKYY, SOXX and IGV are leading the tech-related ETFs with new highs this week.
- HACK is firming near the flag breakout zone (~30.3).
- IGN pulled back to a potential reversal zone (62% retracement and broken resistance).
- IAI pulled back with a falling flag the last two weeks.
- KIE and REM are leading the finance sector with new highs.
- KRE has a bull flag working and a breakout at 57 would be bullish.
- IBB and XBI fell back to their breakout zones, which may offer support.
- IHI is leading the healthcare sector with a fresh 52-week high this week.
- GDX is struggling to hold its upturn and a break below 23 would be bearish.
- XME has been choppy for two weeks, but the wedge breakout is holding and still bullish.
- SLX remains in a choppy uptrend since the early July breakout.
- The bull flag in XES did not work and the ETF is back near its breakout zone.
******************************************************
ETF Master ChartPack - 300+ ETFs organized in a Master ChartList and in individual groups.
Follow me on Twitter @arthurhill - Keep up with my 140 character commentaries.
****************************************
Thanks for tuning in and have a good day!
--Arthur Hill CMT
Plan your Trade and Trade your Plan
*****************************************


