|
.... Testing the Basic PPO Signal Line Cross
.... Setting the Benchmark
.... Consulting, Software and Data
.... System Ground Rules
.... PPO Signal Line System
.... A Winning Chart and a Losing Chart
.... Breaking a Tie and Favoring Momentum
.... Backtest Results Favor Large-caps
.... Profit Factor Metric
.... Conclusions and Caveat Emptor ....
|
Testing the Basic PPO Signal Line Cross
Today I will put the Percentage Price Oscillator (PPO) to the test by testing the signal line cross for the default settings (PPO(12,26,9)). This momentum oscillator is one of the simplest around and I am not curve fitting the settings. The system will buy stocks after they dip and the PPO Line turns up. I will use a momentum indicator to break ties and add a relative strength element. The system will sell when a profit target is reached or when a risk-of-ruin stop is hit. Before asking questions and suggesting tweaks, remember that better is often the enemy of good when it comes to system develop. Robust systems should be simple and with limited curve fitting.
Setting the Benchmark
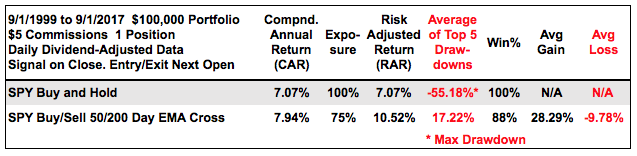
I will use the S&P 500 SPDR (SPY) as the benchmark. The table below shows results for buy-and-hold and an Exponential Moving Average crossover system. The annual return for buy-and-hold is respectable, but there were two BIG drawdowns along the way (2000 and 2008). The EMA crossover buys when the 50-day EMA crosses above the 200-day EMA and sells when the 50-day EMA crosses below the 200-day EMA. This simple system returned around 8% per year (Compound Annual Return) with an average drawdown of 17.22%. Good luck beating that!
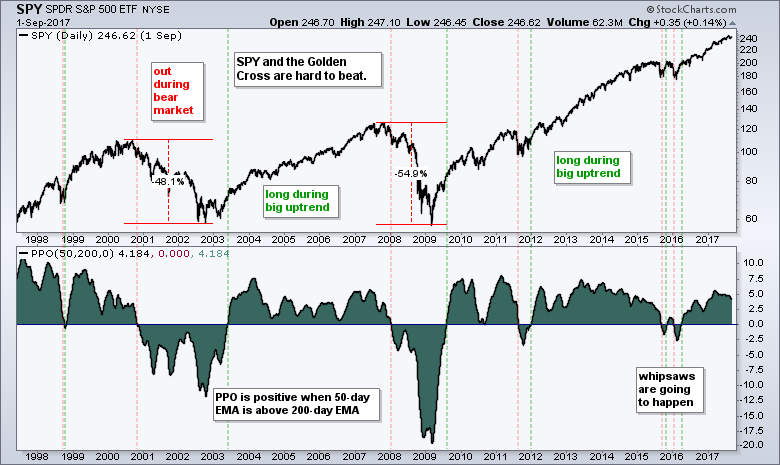
The chart below shows this simple timing system in action using the PPO(50,200,0), which is positive when the 50-day EMA is above the 200-day EMA and negative otherwise. There are whipsaws, but the system manages to catch the big trends and avoid the bear markets. The stock picking systems below are designed to make the most of bull markets and sit out during bear markets.
Consulting, Software and Data
Cesar Alvarez of AlvarezQuantTrading.com provided feedback for the code and system development. Cesar has a
great blog and provides consulting services for system development (
click here). I used Amibroker to test the code and Premium Data from Norgate. Just like StockCharts, the data is adjusted for dividends to reflect the total return.
System Ground Rules
- Bull market: Only long positions are considered and positions are only considered when the S&P 500 ($SPX) is in a long-term uptrend (50-day EMA above the 200-day EMA).
- Timeframe: The testing period runs from 1-September-1997 to 1-September-2017, which is twenty years. The system starts in the middle of a bull run (1997), and there were two bear markets and two bull markets afterwards.
- I will test using historical constituents for the S&P LargeCap 100, S&P 500, S&P Mid-Cap 400, S&P Small-Cap 600 and Nasdaq 100. This means signals from January 2010 will be based on the index constituents at the time.
- Portfolio Size: The portfolio begins at $100,000, commissions were set at $5 per trade and there are 20 equal-weight positions.
- Buy signals are based on closing prices and entry prices are based on the next open.
- Profit targets are set after the entry and triggered as soon as they are hit. Exits trigger intraday when the profit target is reached during the trading day. Exits trigger on the open when the open is above the profit target.
- When a profit target is not reached, a sell signal triggers when the 50-day EMA closes below the 200-day EMA. This is the risk of ruin stop-loss. The sell price is the next open.
PPO Signal Line System
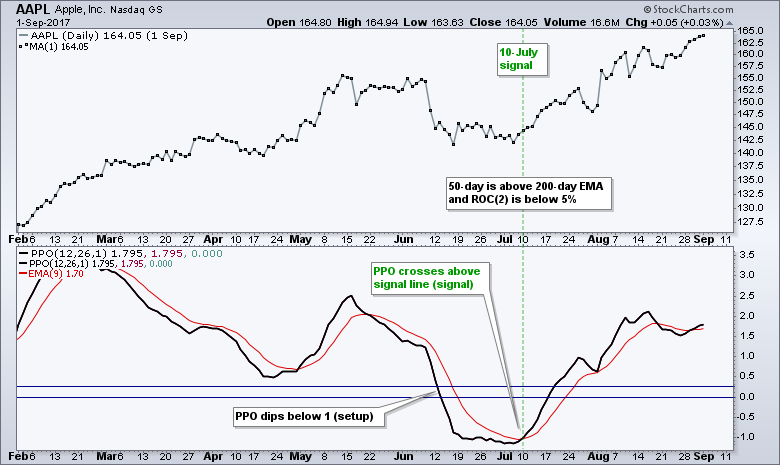
The system triggers a buy signal when the lowest low value of the PPO (12,26,9) over the last 10 days is below 1 and the PPO (12,26,9) then crosses above its signal line. The PPO dip below 1 ensures that a pullback is underway, while the subsequent move above the signal line indicates that prices are turning back up. I am also requiring the 2-day Rate-of-Change to be below 5% to filter out stocks with large 1-day moves.
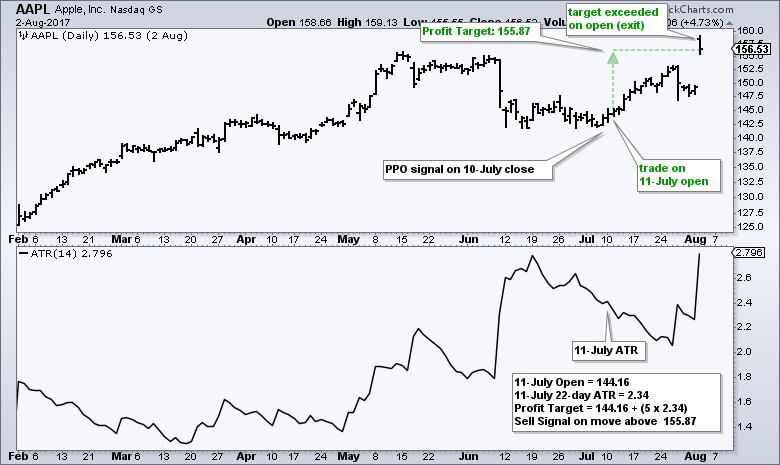
The system sells when a profit target is hit or when the 50-day EMA of the stock crosses below the 200-day EMA, whichever comes first. The profit target is five 22-day ATR values above the entry price and the 22-day ATR is calculated on the day of entry. The chart below shows Apple with a buy signal on 10-July, an entry at 144.16 on the 11-July open and a Profit Target of 155.87.
The next chart shows Apple opening above the profit target on 2-Aug and this open triggered the exit. Sometimes we get lucky with an open above the profit target.
A Winning Chart and a Losing Chart
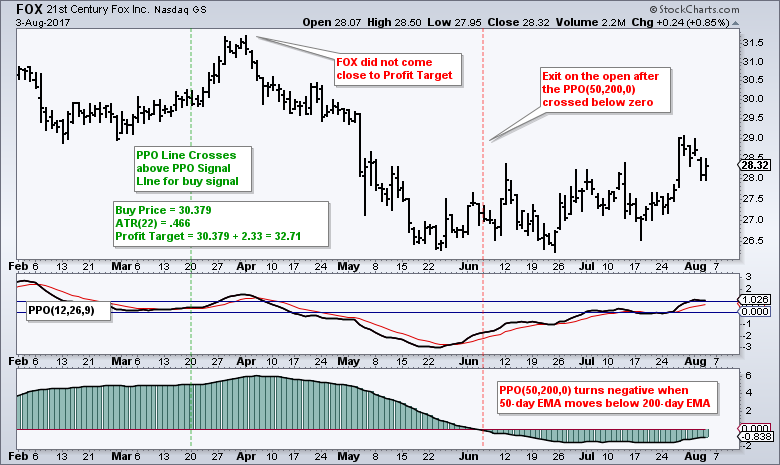
The next chart shows 21st Century Fox (FOX) with a losing trade. The PPO(12,26,9) turned up and triggered bullish in March, but the stock never came close to the profit target. The 50-day EMA subsequently broke below the 200-day EMA in early June to trigger a sell signal.
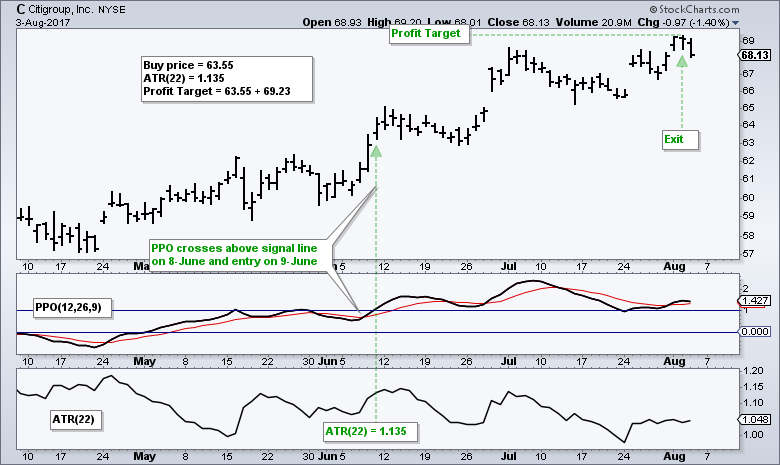
The next chart shows Citigroup (C) triggering bullish in mid June and hitting its profit target in early August for a exit.
Breaking a Tie and Favoring Momentum
There are sometimes more signals than available positions and this requires a tiebreak indicator, especially when using the S&P 500, S&P Mid-Cap 400 and S&P Small-Cap 600. I am using the 65-day Rate-of-Change and picking the stocks with the highest value. This also serves to add a momentum element to the system. Thus, if there are three new positions neede and their are six signals, the system trades the PPO signal line crossovers in the stocks that have the most upside momentum (the top three ranked by the 65-day ROC).
Do not underestimate the power of this momentum element. Systems taking random PPO signals in a stock universe will not perform as well. Yes, I tried it. The momentum filter ensures that you will be trading the stocks showing the most relative strength.
Backtest Results Favor Large-caps
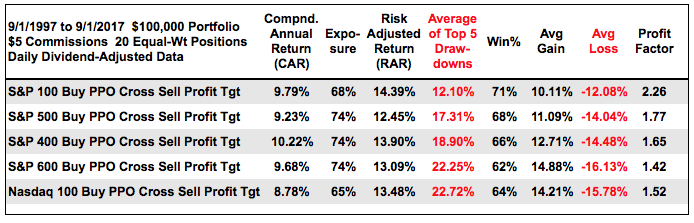
The table below shows the backtest results and the numbers are pretty good overall. The Compound Annual Returns are in the 9% area, exposures are in the low 70% area for the most part and the Win Percents are in the mid 60s. This means that around 2/3 of the trades are profitable. Notice the average gain is slightly lower than the average loss. This means the system works because of the relatively high Win Percent.
I think S&P LargeCap 100 stocks traded the best because the Compound Annual Return was the third highest, the Risk-adjusted Return was the highest and the Average Drawdown was the lowest. In addition, the Profit Factor, which is explained below, is above 2. Mid-caps and small-caps produced good Compound Annual Returns, but their averages drawdowns were significantly higher and their profit factors were lower.
Profit Factor Metric
The profit factor equals the sum of the winning trades divided by the sum of the losing trades. In general, a profit factor of 1.5 means you win $150 for every $100 lost. A profit factor greater than 2 is desired because this means your win/loss ratio is 2 to 1.
Keep in mind that there are dozens of metrics to evaluate a trading system and we all have our personal favorites. The tables above show the metrics that I deem important and I try to show as many raw metrics as possible. In other words, I show the Compound Annual Return and the Average Drawdown instead of a ratio of the two (CAR/Drawdown).
Conclusions and Caveat Emptor
This PPO trading strategy shows some promise, especially for large-cap stocks. My research suggests that three things are key to a successful system. First, it must only trade during bull markets. Second, it must employ some sort of momentum filter to pick stocks showing relative strength. Third, there needs to a modest profit target and a fairly wide stop, such as the risk of ruin stop-loss used in these tests. I tested tighter stop-losses and trailing stops with these systems and the results worsened.
Portfolio level backtesting means I am testing a basket of stocks. I never know which picks will be winners and which will be losers. It is a shotgun approach to stock picking. These systems are profitable because the profit from the winners exceeds the losses from the losers, and because there are more winners than losers (Profit Factor). Also note that the results are based on taking every trade and sticking with the system, which is hard in real life. And finally, keep in mind that past results do not guarantee future results.
Past performance does not guarantee future performance!!
Scan Code
The indented text below shows scan code that you can copy and pasted into the Advanced Scan Workbench. The code finds stocks with PPO signal line crossovers and ranks them by the 65-day Rate-of-change. There are usuaully just a handful of signals when using 100 stocks (SP100), but there are often dozens of signals when using the S&P Small-Cap 600 and the 65-day ROC is used to pick the stocks with the strongest momentum.
// set stock universe
[group is SP100]
// ensure an uptrend in the stock
AND [EMA(50,close) > EMA(200,Close)]
// the 2-day Rate-of-Change is below 5%
AND [ROC(2) < 5]
// the 10-day low of the PPO is below 1
AND [max(10,PPO Line(12,26,9)) < 1]
// PPO crossed above its signal line
AND [PPO Line(12,26,9) x PPO Signal(12,26,9)]
// rank results by 65-day RoC
Rank by ROC(65)
******************************************************
Thanks for tuning in and have a good day!
--Arthur Hill CMT
Plan your Trade and Trade your Plan
******************************************************
Other Articles in the SystemTrader Series:
Introduction to Key Performance Metrics - Quantifying the Golden Cross for the S&P 500
Golden Cross and 5 Major Indexes - EMAs versus SMAs - Do Short Positions Add Value?
Setting up Momentum Scans, Creating ChartLists and Exporting Lists. - Differences in Major Indexes - Do Trend Filters Work?
MACD Crosses - Rules to Reduce Drawdowns and Increase Gains - Testing PPO Strategy âÂÂÂÂÂÂÂÂÂÂÂÂÂÂ
Follow me on Twitter @arthurhill - Keep up with my 140 character commentaries.