 |
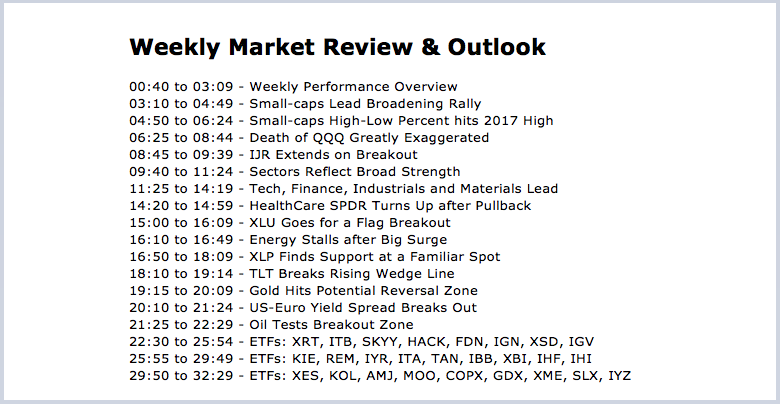
.... Small-caps Lead Broadening Rally .... Small-caps High-Low Percent hits 2017 High .... Death of QQQ Greatly Exaggerated .... IJR Extends on Breakout .... Sectors Reflect Broad Strength .... Tech, Finance, Industrials and Materials Lead .... HealthCare SPDR Turns Up after Pullback .... XLY Catches a Strong Bid .... XLU Goes for a Flag Breakout .... Energy Stalls after Big Surge .... XLP Finds Support at a Familiar Spot .... TLT Breaks Rising Wedge Line .... Gold Hits Potential Reversal Zone .... US-Euro Yield Spread Breaks Out .... Oil Tests Breakout Zone .... Charting Notes ..... |
----- Art's Charts ChartList (updated October 6th) -----
Small-caps Lead Broadening Rally
The revival of small-caps can be seen when looking at the Small-Cap %Above 200-day EMA (!GT200SML), which is shown in the bottom window on the chart below. Around 41% of small-caps were below their 200-day EMA on August 18th (red oval). This indicator rose throughout September and exceeded 75% in early October. As the red horizontal line shows, this level surpassed the spring highs as small-caps led the market the last six weeks. Note that all three indicators are above 75% and this means some 75% of stocks in the S&P 1500 are above their 200-day EMAs. That sounds pretty bullish to me.
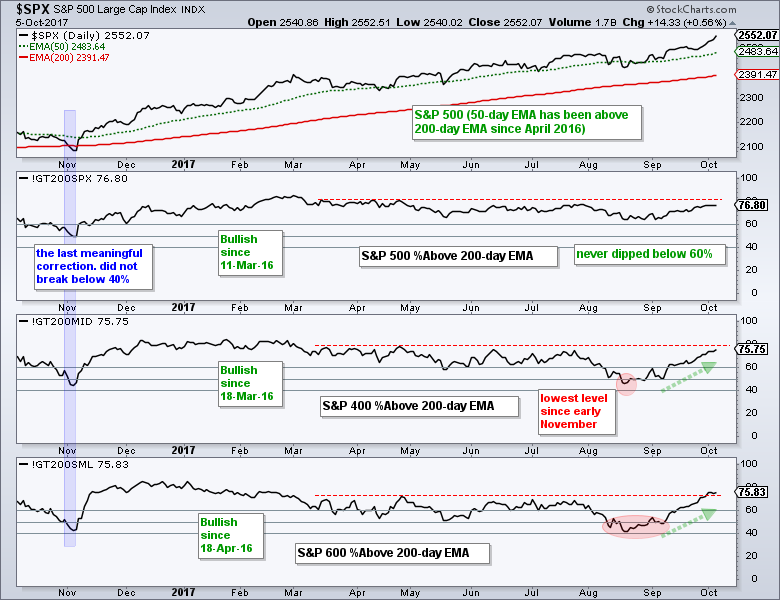
I typically use these indicators to gauge broad market breadth. A move above 60% shows enough critical mass on the upside and this is deemed bullish. Such a signal remains bullish until there is a move below 40%, which shows enough downside participation to reverse the signal. S&P 500 %Above 200-day EMA (!GT200SPX) and Mid-Cap %Above 200-day EMA (!GT200MID) turned bullish in March 2016, while Small-Cap %Above 200-day EMA (!GT200SML) turned bullish in April 2016. Small-caps almost triggered bearish in August, but held above 40% and stayed bullish.
Small-caps High-Low Percent hits 2017 High
I last wrote about the High-Low Percent indicators a month ago when S&P 500 High-Low% ($SPXHLP) was staying below +10% (red shading). This kind of behavior shows a lack of leadership in the market and typically occurs during corrective periods. Keep in mind that a correction can take the form of a pullback or trading range. In any case, High-Low Percent for the S&P 500 surged above 10% on September 11th and the index moved to a new high. Clearly, the corrective mode ended here (green vertical line).
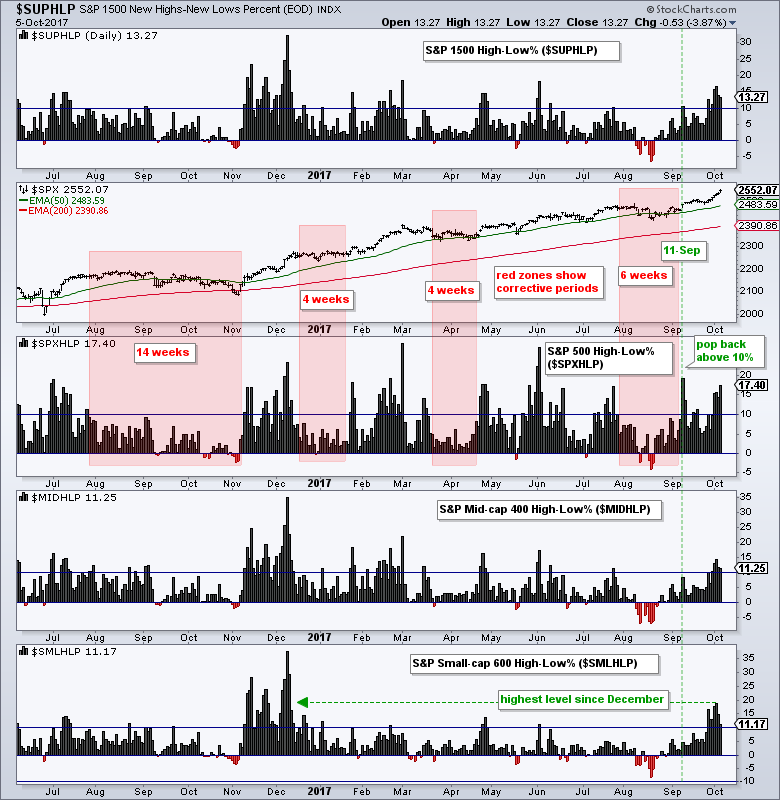
The lower two windows show S&P 400 High-Low% ($MIDHLP) and S&P 600 High-Low% ($SMLHLP) moving above +10% over the last five to seven days. This is the first time all three have been above +10% since June 2nd and this shows broadening leadership. Also note that High-Low Percent for small-caps is at its highest level since December. New highs are bullish and this expansion indicates that the rally has legs. This means we should watch IWM and IJR for pullbacks within their respective uptrends.
Death of QQQ Greatly Exaggerated
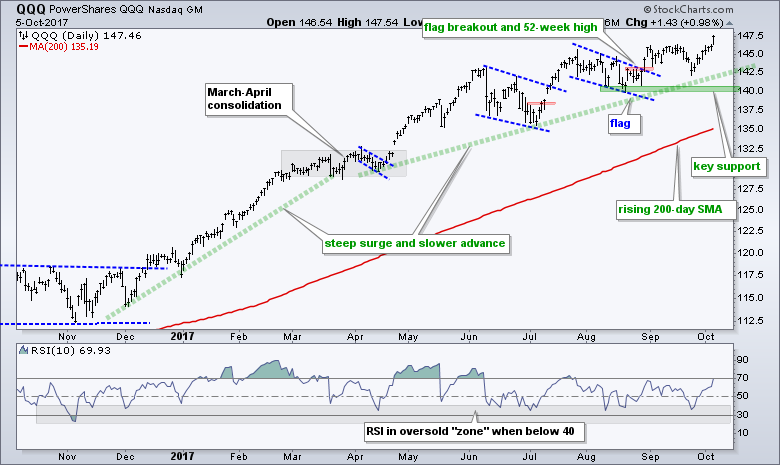
QQQ showed some relative weakness from July 24th to September 25th as it traded flat and did not confirm new highs in SPY. As noted time and time again, relative weakness is not the same as absolute weakness. There was never anything negative on the price chart and the ETF proved its prowess yet again with a surge to new highs. Notice that RSI(10) dipped into the 20-40 zone in late September and this marked the short-term bottom. Picking the exact oversold level is pretty much impossible and this is why I use zones.
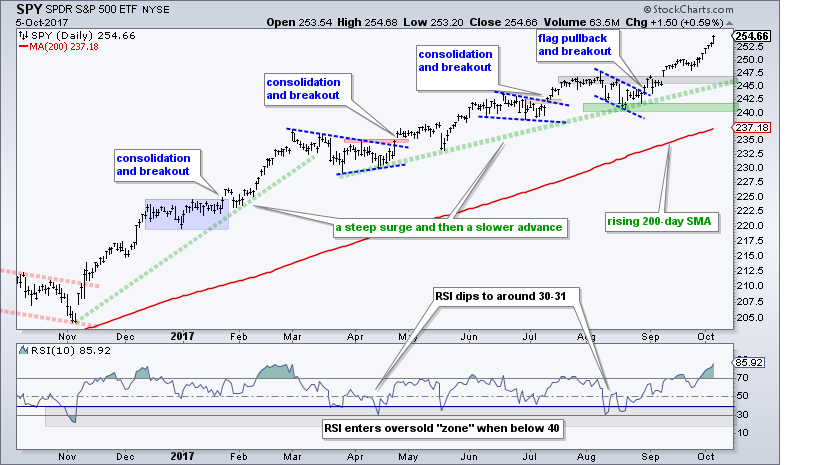
The next chart shows the S&P 500 SPDR (SPY) hitting yet another new high with eight consecutive up days. SPY is also up 13 of the last 15 trading days and up around 5.5% from its mid August low. RSI(10) exceeded 70 on September 13th and is currently at 86. During this "overbought" time, SPY tacked on another 2%. Overbought is not very useful in an uptrend because overbought conditions are normal in an uptrend. At this point, I will use broken resistance and the March trend line to mark first support in the 246-247 area.
IJR Extends on Breakout
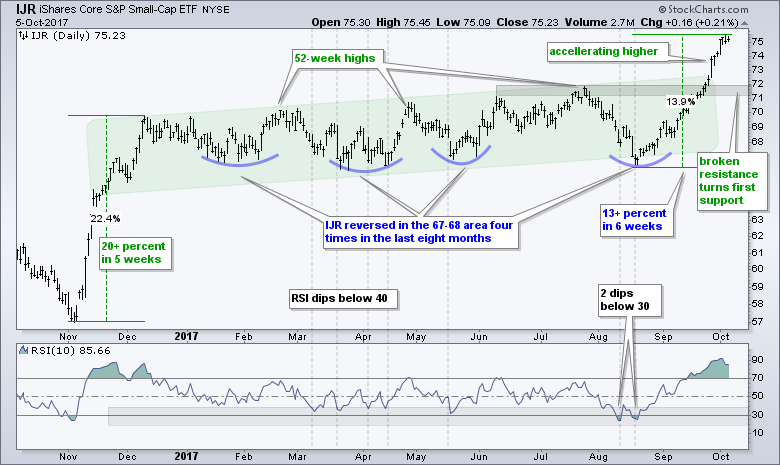
The S&P SmallCap iShares (IJR) is the run away freight train right now with a 13+ percent advance from the mid August lows. Chasing at this stage risks a pullback so I would be content to wait for a setup to unfold over the coming weeks. Broken resistance in the 71-72 area is the first zone to watch for support on a pullback. Chartists can also watch for RSI(10) to dip into the 20-40 zone.
Sectors Reflect Broad Strength
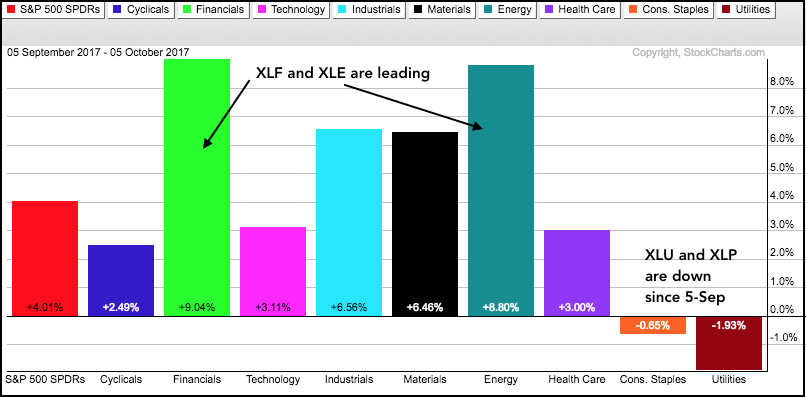
Four of the nine sector SPDRs hit new highs this week and six of the nine sectors are within 1% of a 52-week high. Utilities and consumer staples are around 4% from 52-week highs and showing the most weakness over the past month. Actually, the Utilities SPDR (XLU) and the Consumer Staples SPDR (XLP) are the only two sectors showing losses since September 5th. The Energy SPDR (XLE) is still some 10% below its 52-week high, but it is also the second biggest gainer since September 5th. The Finance SPDR (XLF) is the leading sector with a 9% gain over the past month.
Tech, Finance, Industrials and Materials Lead
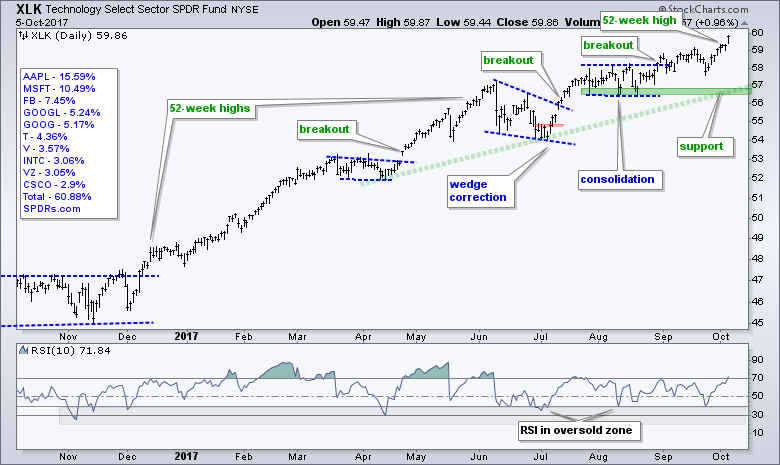
The Technology SPDR (XLK) may be up less than other sectors since the latest advance began on August 18th, but the ETF continues to move higher and remains a leader because it recorded 52-week highs this week. There was a wedge breakout in mid July and a consolidation breakout in late August. RSI touched 40 on September 25th and this was the most recent oversold condition (mildly oversold).
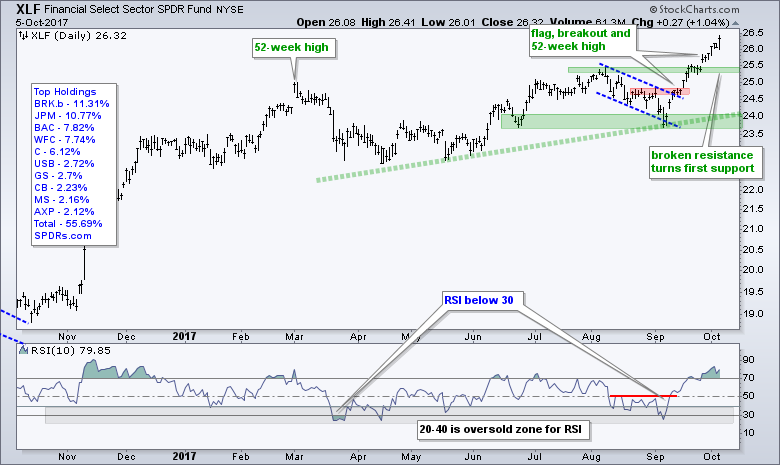
The Finance SPDR (XLF) hit a new high in late September and built on this new high with further gains this month. As with small-caps, XLF is getting quite extended short-term because it is up around 10% in four weeks. Extended is just another word for overbought. Overbought is a short-term condition that warns chartists to prepare for a pullback or consolidation. Overbought does not help with timing because names can become overbought and remain overbought. The ability to become overbought is long-term bullish, but it makes for tricky trading in the short-term. Broken resistance marks first support in the 25.3-25.5 area.
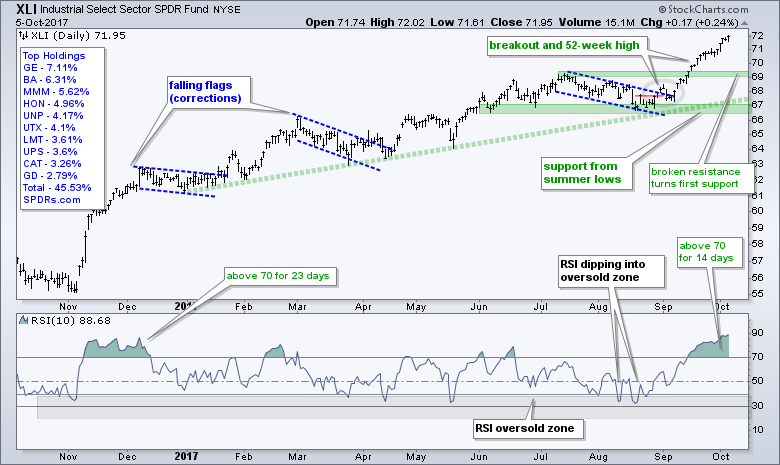
The Industrials SPDR (XLI) is a great case-in-point for becoming overbought and staying overbought, according to RSI. Notice that RSI(10) moved above 70 in mid September and has remained above 70 for 14 days, and counting. The last long run occurred in November-December when RSI held above 70 for 23 days and XLI advanced another 6-7% after becoming overbought. Currently, XLI is up around 4.3% since becoming overbought and could have further room to run. Should we see a pullback, I would mark the first potential reversal zone at broken resistance (~69).
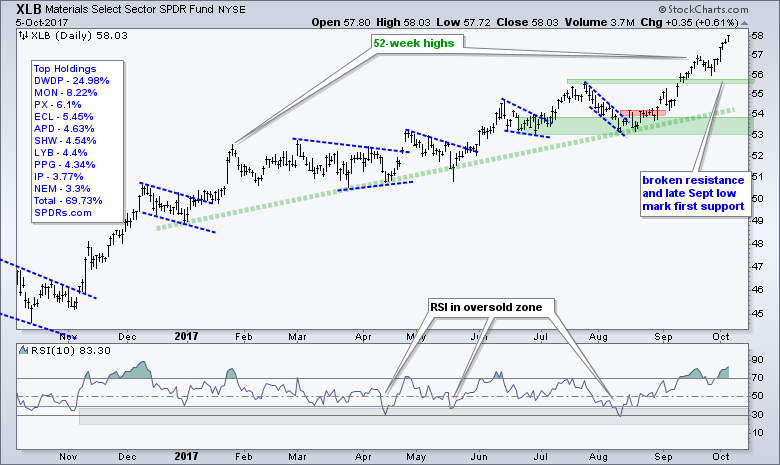
The new high in XLI goes hand-in-hand with the new high in the Materials SPDR (XLB). Both are cyclical sectors that benefit during upturns in the capital spending cycle. XLB went on another tear with a 3% gain the last six days. I could draw an upper channel trend line or use the Fibonacci Retracements Tool to make some upside projections, but any upside target would be a guestimate. The broken resistance zone in the 55.5-56 area turns into the first support zone on any pullback. I prefer to guess support or reversal zones on pullbacks.
HealthCare SPDR Turns Up after Pullback
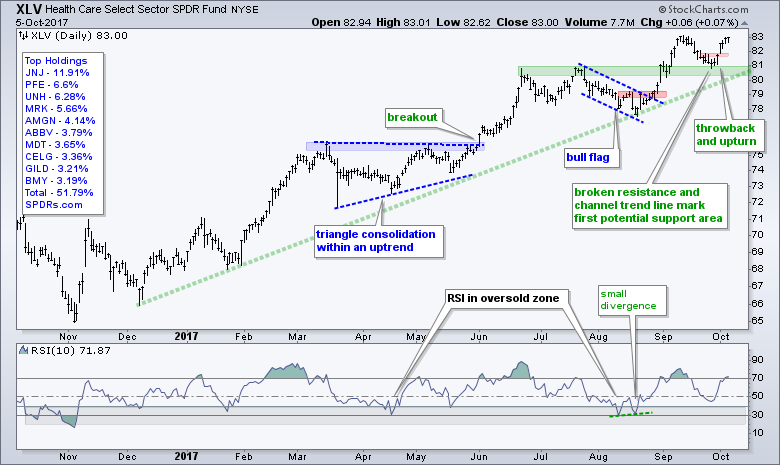
The HealthCare SPDR (XLV) fell back in the second half of September, found support near broken resistance and turned up again this week. The ETF is very close to another new high and still one of the market leaders.
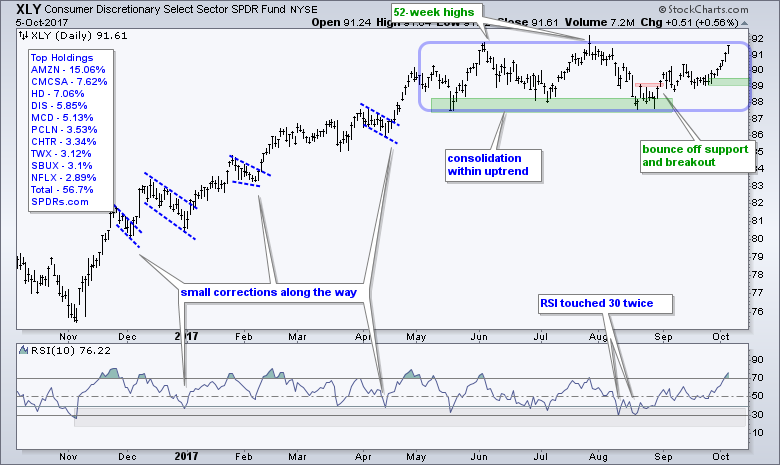
XLY Catches a Strong Bid
The Consumer Discretionary SPDR (XLY) made good on the August support bounce and surged to its summer highs. The double top is clearly no more and this raises an important issue for chartist. We should avoid the temptation to look for bearish patterns when the bigger trend is up. Yes, I can be guilty of this sometimes. XLY hit new highs in June and July, and the bigger trend was up. Support in the 88 area ultimately held and the trading range from May to September now looks like a big consolidation within an uptrend.
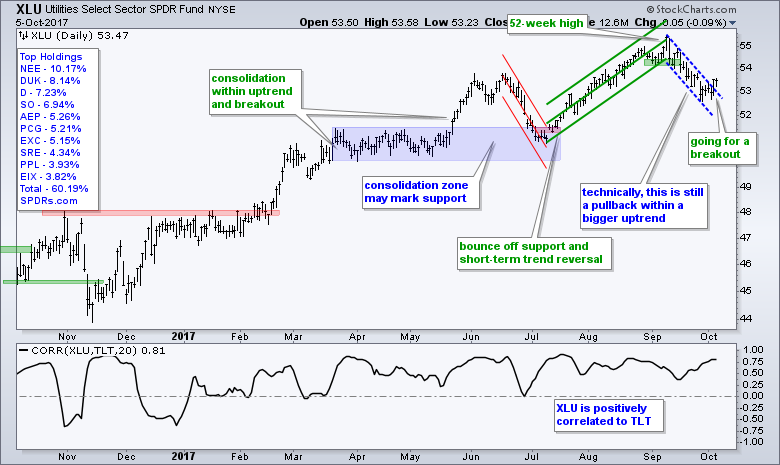
XLU Goes for a Flag Breakout
The Utilities SPDR (XLU) fell sharply the last four weeks as the 10-yr T-Yield ($TNX) rose, and the 20+ YR T-Bond ETF (TLT) fell. The bigger trend is still up with a 52-week high less than a month ago. XLU also remains well above the July low. A falling flag formed into October and the ETF broke above the upper trend line this week. The success or failure of this breakout will probably hang the bond market's reaction to the employment report. A surge in bonds would be bullish for XLU, while further weakness would be bearish.
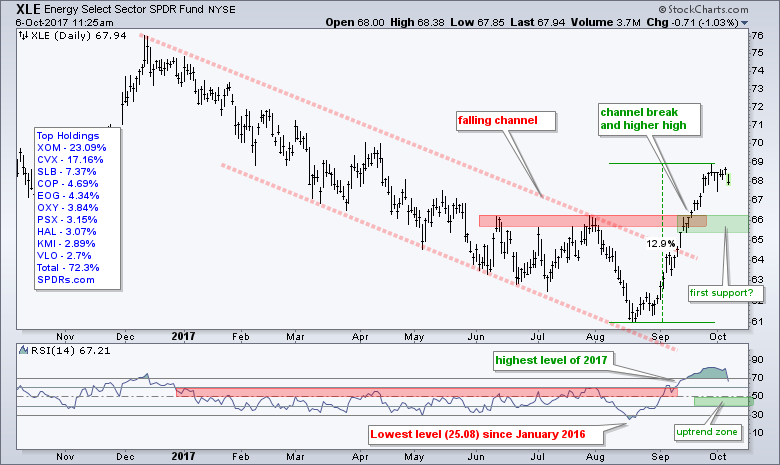
Energy Stalls after Big Surge
The Energy SPDR (XLE) surged over 10% and broke the summer highs in the process. The breakout is bullish, but the ETF is quite extended and ripe for a pullback or consolidation. The broken resistance zone around 65.5-66 turns into the first support zone to watch on a pullback. RSI(14) failed to break above 60 from January to August and this defined the downtrend. The September breakout in RSI coincided with a trend reversal in XLE and I am now watching the bull zone for RSI(14), which extends from 40 to 80. Thus, a pullback into the 40-50 zone could provide an opportunity. Note: This would be equivalent to a pullback into the 30-40 zone for RSI(10).
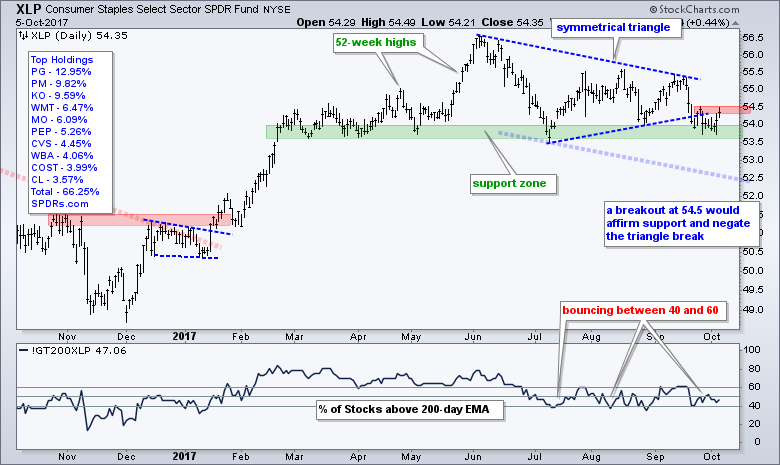
XLP Finds Support at a Familiar Spot
The Consumer Staples SPDR (XLP) is a tough nut to crack right now. The symmetrical triangle break remains in play and this is bearish until proven otherwise. Instead of moving lower, the ETF firmed near the spring-summer lows and the green area marks a support zone. A surge off support and break above 54.5 would argue for re-evaluation. Note that XLP is positively correlated to TLT so weakness in bonds would be negative.
TLT Breaks Rising Wedge Line
The 20+ YR T-Bond ETF (TLT) is also at a tricky juncture. The ETF reversed at the 61.8% retracement and broke the rising wedge line in September. This could be long-term bearish for TLT, but the ETF has yet to break below the July low. The early stages of a trend reversal are clear and a lower low is needed to produce an actual downtrend.
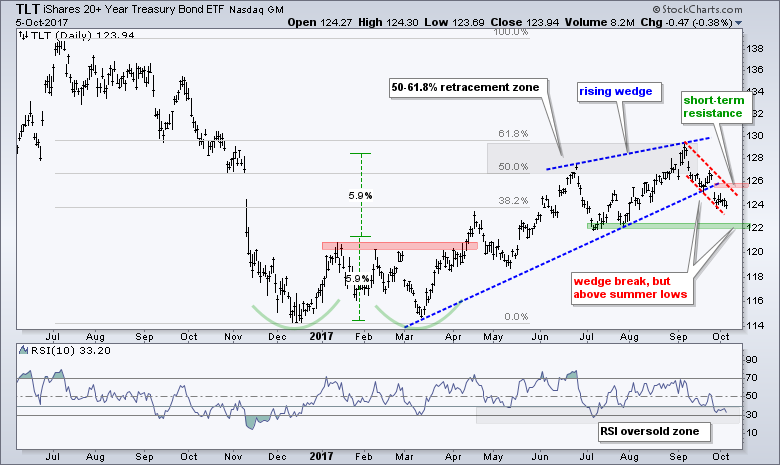
The red trend lines define the short-term downtrend and I am marking resistance at 126. While the odds favor further downside as long as this short-term downtrend holds, a breakout at 126 would reverse this slide and put the bigger uptrend back in play.
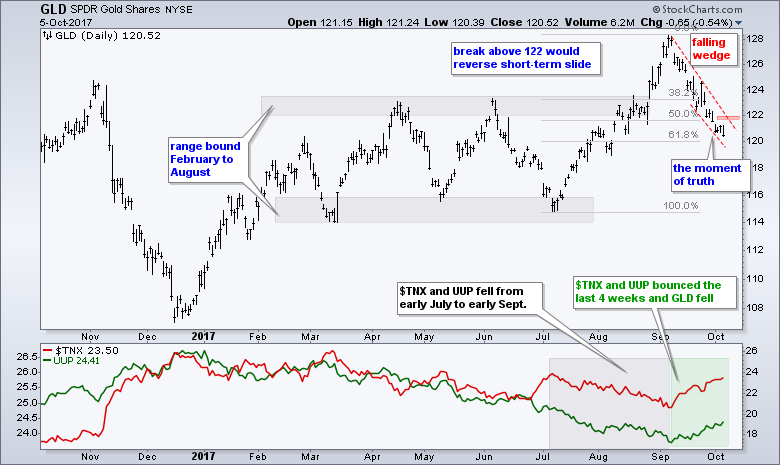
Gold Hits Potential Reversal Zone
The bond market sneezed and gold caught a cold. Watch out because if the bond market gets a cold, gold will get pneumonia. These two are positively correlated, but gold is clearly more volatile. TLT fell around 4.5% and GLD is down around 6% the last few weeks. The red lines mark a falling wedge with resistance at 122. Notice that GLD is at a moment-of-truth because it retraced 61.8% of the prior advance. This is a potential reversal zone, but we need a breakout to signal a return of buying pressure.
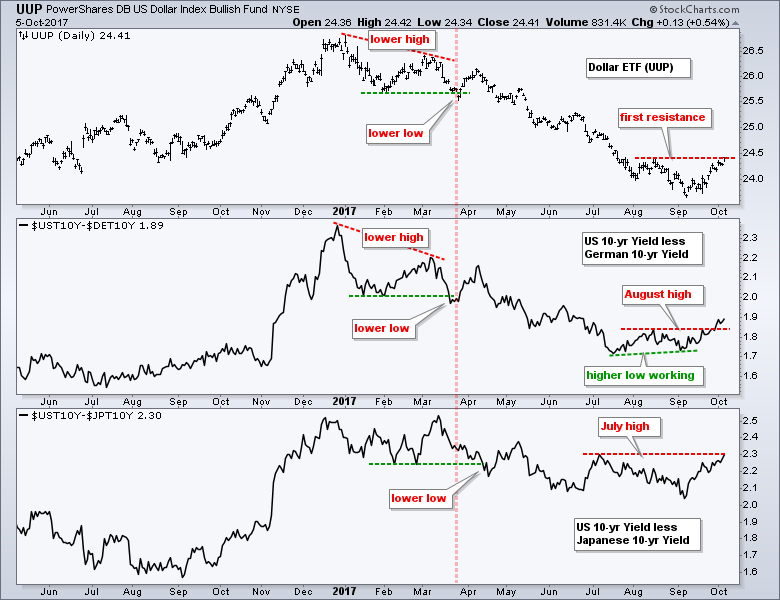
US-Euro Yield Spread Breaks Out
The US Dollar ETF (UUP) is up so far this month and the September gain marks the first monthly gain since February. The first window shows UUP on the verge of breaking its August high. The second window shows the spread between the US 10-yr and the German 10-yr breaking out after a higher low. This is a key driver for the Dollar and this breakout is bullish. It shows the US yields are rising faster than German yields. The lower window shows the spread between the US 10-yr and Japanese 10-yr on the verge of a breakout.
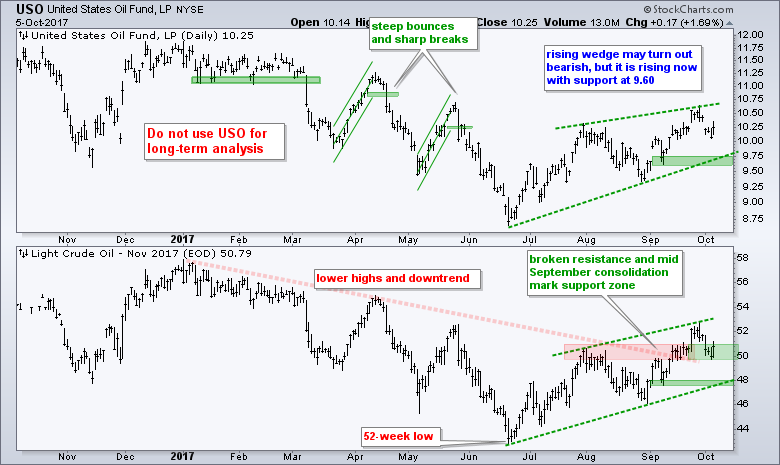
Oil Tests Breakout Zone
Oil fell back this week, but the trend since June remains up. Note that oil was up around 10% in September and entitled to a rest in October. The lower window shows November Crude (^CLX17) and the $50 area marking the first support zone. Notice that crude broke out there and then exceeded $52.5. A key tenet of technical analysis is that broken resistance turns first support and this is the first area to watch on a pullback. The decline back to $50 looks like a throwback and we may see a continuation higher soon.
Charting Notes
It is a big list this week with the first 20+ bullet points referring to the Art's Charts ChartList. The last five bullet points are just chart observations.
- ITB hit a new high and there is broad strength in housing stocks.
- XRT is holding just above its breakout zone.
- SKYY, FDN and SOXX hit new highs. Tech-related ETFs are still leading.
- HACK formed a flag in late September and broke out this week.
- IGN extended its bounce off support, which started in mid August.
- IGV formed a bull flag in late September and broke out last Friday.
- IAI and REM hit new highs to lead the finance sector.
- KIE is holding its breakout at 89.
- KRE is holding above its wedge breakout.
- IYR formed a higher low and turned up this week.
- ITA is leading the industrials sector with another new high.
- JETS surged and extended its mid September breakout.
- TAN surged off short-term support the last eight days.
- IYT hit a new high this week.
- XBI and IBB extended on their consolidation breakouts and hit new highs.
- IHF is trying to break out of a two month triangle.
- IHI turned back up with a short-term breakout this week.
- XES is challenging the summer highs and outperforming $WTIC.
- KOL and COPX turned up this week and broke short-term resistance.
- MOO hit a new high.
- GDX remains in pullback mode, but near the 61.8% retracement.
- XME broke out of a small wedge this week.
- SLX turned back up with a short-term breakout this week.
- IYZ surged to the April trend line with an oversold bounce.
- PALL (palladium) appears to be turning up after a brief pullback to the June high.
- JJU (alu) and DBB (base metals) hit new (closing) highs this week.
- JJC (copper) turned up after a short pullback.
******************************************************
ETF Master ChartPack - 300+ ETFs organized in a Master ChartList and in individual groups.
Follow me on Twitter @arthurhill - Keep up with my 140 character commentaries.
****************************************
Thanks for tuning in and have a good day!
--Arthur Hill CMT
Plan your Trade and Trade your Plan
*****************************************


