.... Comparing Global Treasury Yields
.... Watch Junk Bonds as a Leading Indicator
.... T-Mobile Fails to Hold Breakout
.... Merck Plunges to Potential Support
.... Two Discount Brokers with Bullish Charts
.... HACK and three Cyber Security Stocks ....
Today we will start with a view of global Treasury yields and show how the US remains head-and-shoulders above the rest of the world. I will then turn to the High-Yield Bond ETF (HYG) because junk bonds are very sensitive to changes in the economy and can be leading indicators. I do not see anything bearish in the Junk Bond market, but will show you what to look for. I will then follow up on T-Mobile US (TMUS) and Merck (MRK), two stocks that went against my analytical assessment. And finally, we will close with two discount brokers with bullish charts and three cyber security stocks holding their breakouts.
Comparing Global Treasury Yields
Tom Lee, head of research at Fundstrat Global Advisors, notes that European junk bond yields (2.1%) are below the US 10-yr T-Yield (2.37%). Lee calls this a "hard to explain" situation. I agree. It makes absolutely no sense that a questionable credit in Europe can borrow money for less than the US government. There is clearly more at work here because the German 10-yr Yield ($DET10Y) is currently at .367%, which is well below the borrowing rate for junk bond issuers in Europe. This makes sense. Thus, the interest rate differential between the US and Europe is the reason for this discrepancy. Even so, Lee has a point.
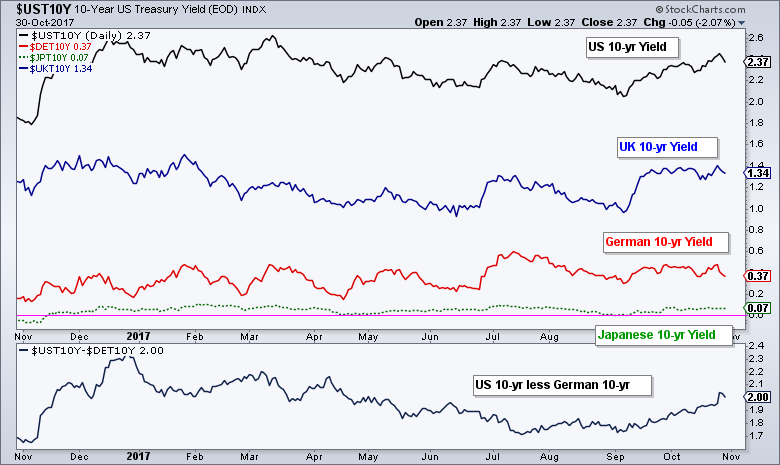
The chart below shows the 10-yr T-Yield ($UST10Y), the UK 10-yr Yield ($UKT10Y), the German 10-yr Yield ($DET10Y) and the Japanese 10-yr Yield ($JPT10Y) using the "price (same scale)" overlay. Notice that US yields are the highest, Japanese yields are the lowest and German yields peaked in July. Also notice that the US-German yield spread has widened since early September and this is positive for the Dollar.
Watch Junk Bonds as a Leading Indicator
Lee also noted that we should pay attention to the relationship between junk bonds and stocks. Junk bonds are the lowest credits in the bond market and the first to default in a downturn. This means they are like the canaries in the economic coal mine. Lee notes that the surge in the High-Yield Bond ETF (HYG) in February 2016 was a sign of confidence and this supported the rise in the stock market.
Before looking at the HYG chart, let's compare the dividend adjusted price chart with the unadjusted price chart. The chart below shows the adjusted HYG price in the top window and the unadjusted price in the bottom window (_HYG). Chartists can place an underscore in front of any symbol to see unadjusted prices (without dividends, distributions and corporate actions). Notice that adjusted HYG is hitting a new high because the dividends were added back into the prices. In contrast, unadjusted HYG remains below its 2014 highs. Thus, buyers near the 2014 high do not have any capital gains right now. They do, however, have dividend income and this income more than made up for the capital loss.

The next chart shows unadjusted HYG (_HYG), the S&P 500 and the PPO (5,200,0) for _HYG. The gray outline from September 2014 to April 2016 shows when the PPO was negative, which means the 5-day EMA was below the 200-day EMA for _HYG. Notice that the S&P 500 was largely flat during this time and suffered two big dips (August 2015 and January 2016). The PPO has been largely positive since May 2016 and the continued rise in junk bond prices is positive for stocks. Even though the unadjusted Junk Bond ETF (_HYG) has been flat for several months, I would not become concerned with the bull market in stocks unless the PPO turns negative.

T-Mobile Fails to Hold Breakout
I featured a bullish setup in T-Mobile US (TMUS) in Don’t Ignore this Chart on Saturday and the stock promptly fell 5.35% on Monday. How's that for gratitude. I usually avoid stocks with pending acquisitions, earnings or other corporate events, but I cannot time all news and I certainly cannot predict the news. Apparently, there is now less chance of a deal between T-Mobile and Sprint. The chart shows TMUS failing to hold the breakout and falling back into the support zone. Notice that this is the third high-volume move since July. The high volume points to a selling climax of sorts and the stock is still in a support zone. In the DITC article, I said I would re-evaluate on a close below 60. Given the high volume and the support zone, my re-evaluation is that a move below 59 would show downside follow through and make the bullish case untenable.

Craig Moffett, who may be related to Sam Malone (Cheers), talked about chances of a merger between T-Mobile and Sprint in this CNBC interview.
Merck Plunges to Potential Support
I highlighted Merck, Gilead and Amgen in DITC on October 18th and all three failed to break out of their corrective patterns. Instead, they fell the last two weeks and Merck plunged to a 52-week low. Apparently, Merck pulled a drug application in Europe and this is the end of the world for Merck. Maybe not. MRK fell around 15% and is already in a potential support zone. Notice the longest volume-by-price bar and the 62% retracement are around 54. Also notice that RSI is oversold for the first time since September 2015. Even though the plunge looks overdone, it may take time to forge a bottom. Note how RSI became oversold in August 2015, the stock bounced in October 2015 and then tested the low with a pullback into February 2016.

Here is a CNBC video with Umer Raffat of Evercore ISI. Raffat discusses volatility in biotech and pharma, as well as the situation with Merck.
Two Discount Brokers with Bullish Charts
Schwab (SCHW) broke out of a long trading range and remained largely above this breakout zone in October. There was a pullback to 42 in mid October and then a bullish breakout last week. E-Trade (ETFC) is in a long-term uptrend and short-term downtrend, which is deemed a pullback or small correction. Watch 44 for a breakout.

HACK and three Cyber Security Stocks
The next chart shows the Cyber Security ETF (HACK) with three components. HACK broke out in mid September and remains above this breakout zone. Fortinet (FTNT) just reported earnings and this caused a little volatility the last two days. Nevertheless, the wedge breakout is holding for the most part and remains bullish. ProofPoint (PFPT) pulled back within a rising channel and is near short-term support. Palo Alto Networks (PANW) formed a bull flag/wedge and remains above the breakout zone.

******************************************************
ETF Master ChartPack - 300+ ETFs organized in a Master ChartList and in individual groups.
Follow me on Twitter @arthurhill - Keep up with my 140 character commentaries.
****************************************
Thanks for tuning in and have a good day!
--Arthur Hill CMT
Plan your Trade and Trade your Plan
*****************************************


