.... Big Winners and Losers During Earnings Season
.... Automatically Charting Sector and Industry Group
.... Follow the Broader Market
.... De-selection is Part of the Selection Process ....
Big Winners and Losers During Earnings Season
Stock picking is a tough game, even in the best of times. Earnings season is still underway and we have seen our fair share of big winners and big losers. Earnings season started in mid October so I ran a "back of the envelope" scan to see how stocks in the S&P 500 are performing the last three weeks. The S&P 500 SPDR (SPY) is up around 1% over the last three weeks. Within the S&P 500, 370 stocks are up during this timeframe and 130 are down. Thus, around 3/4 of stocks in the S&P 500 are participating in the advance.
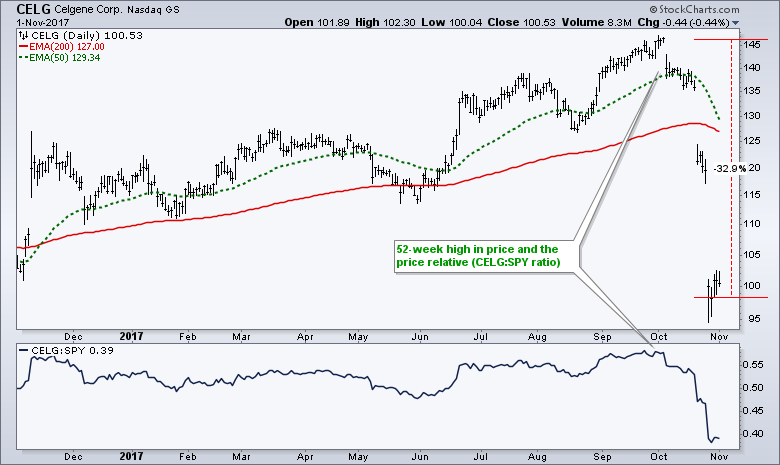
I further narrowed the results to isolate the big movers. 12 stocks are up more than 10% and 18 stocks are down more than 10%. There are more big losers than big winners. Some of the big losers are not surprising because they were already in downtrends (AGN, EVHC, ALK, GE, SCG, MAT, T, UAA, CMG, UAL). I consider the trend down when the 50-day EMA is below the 200-day EMA. Thus, 10 of the 18 biggest earnings losers (55%) were already in downtrends. Of course, this means 6 of the 18 were in uptrends and the reaction to earnings bucked the trend. We cannot win them all. Celgene (CELG) is perhaps the biggest surprise of the group as the stock went from a 52-week high to a 52-week low in less than a month with a 30+ percent decline.
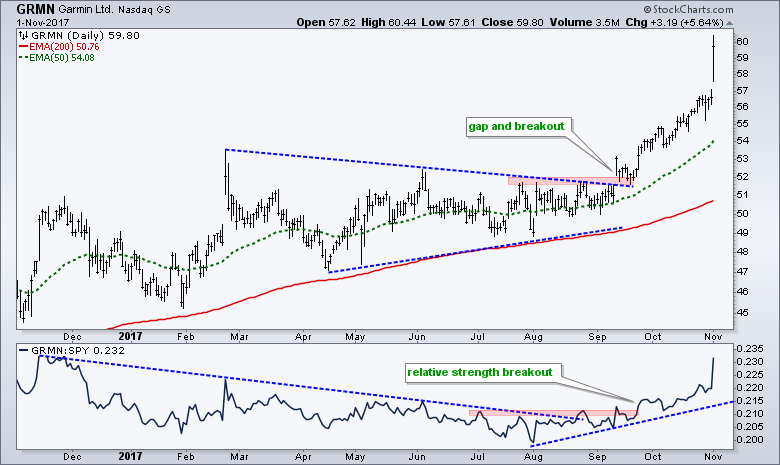
Of the 12 stocks with 10+ percent gains over the last three weeks, only two were in long-term downtrends (50-day EMA below 200-day EMA). WW Grainger (GWW) and Seagate Technology (STX) hit 52-week lows in August and were in long-term downtrends. This means 10 of the 12 stocks (83%) with the highest 15-day ROC in the S&P 500 were already in long-term uptrends (ALGN, INTC, ADBE, PHM, RMD, EL, AMZN, Q, ANTM, GRMN). The chart below shows Garmin (GRMN) with a price breakout and a relative strength breakout in mid September.
Automatically Charting Sector and Industry Group
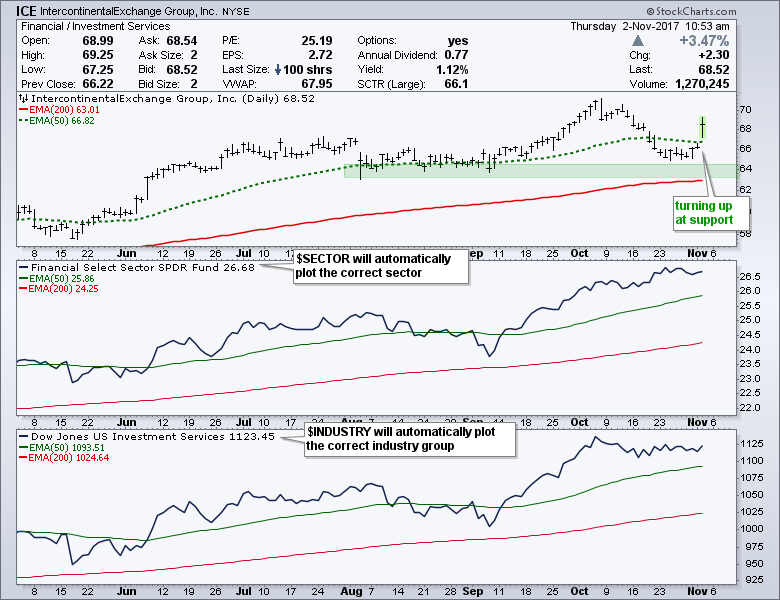
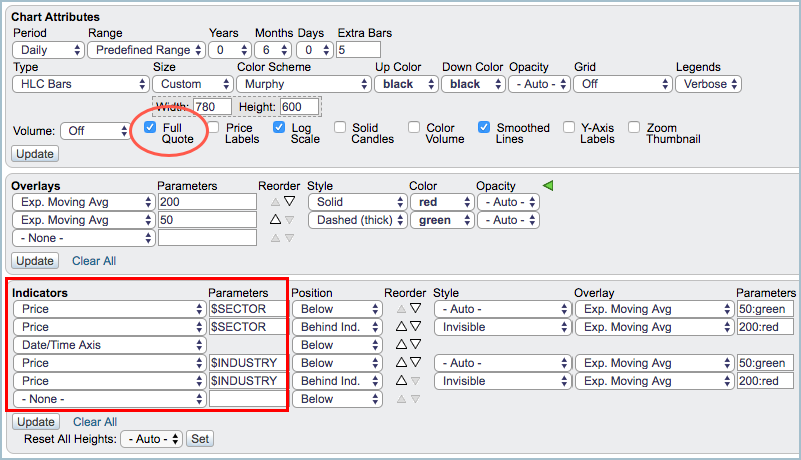
There are no sacred cows in technical analysis, but we can increase our odds by putting the trend in our favor. There are at least two trends that matter: the broad market trend and the trend for the stock. Chartists can also consider sector and industry group trends. The chart below shows Intercontinental Exchange Group (ICE) in full quote mode with the sector and industry group in the indicator windows. Chartists can check the "full quote" box under the chart to see detailed information. You can also use $SECTOR and $INDUSTRY as symbols to plot the sector and industry group. The image under the chart shows the settings.
Follow the Broader Market
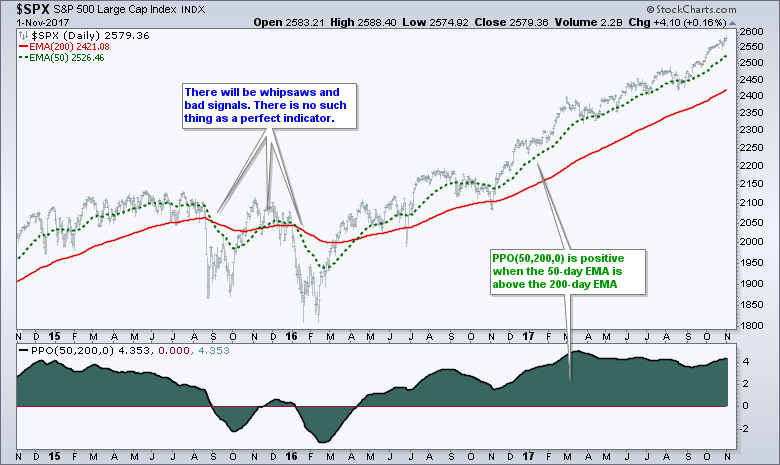
There are different indicators and techniques for measuring trends, as well as different timeframes. I am an end-of-day (EOD) trader and I use daily charts for most of my analysis. For broad market timing, I simply use the 50-day EMA and the 200-day EMA for the S&P 500 or the S&P 500 SPDR (SPY). The big trend is up when the 50-day EMA is above the 200-day EMA the down when the 50-day EMA is below the 200-day EMA. It does not make a big difference if you use exponential moving averages or simple moving averages. Sometimes EMAs work better and sometimes SMAs work better. I just prefer EMAs because they put more weight on recent prices. Note that Greg Morris just posted a great article on using the Zahorchak strategy for broad market timing.
De-selection is Part of the Selection Process
Returning to stocks in the S&P 500, I ran another scan measuring the current 15-day Rate-of-Change for stocks that were in long-term uptrends 15 days ago and long-term downtrends 15 days ago. There were 370 stocks in long-term uptrends 15 days ago and 294 of these (65%) were up over the last 15 days. There were 130 stocks in long-term downtrends and 68 (38%) of these were up over the last 15 days. Yes, I realize this is one data point and the differences are not earth-shattering, but chartists staying with the bigger trend would have increased their odds for success.
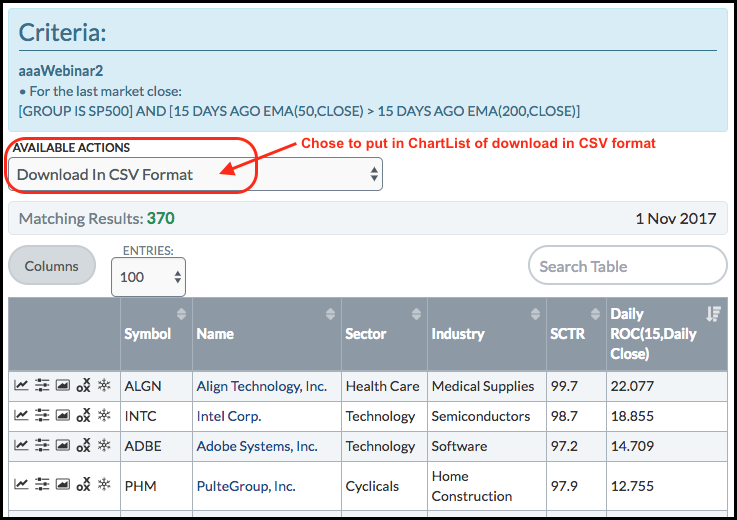
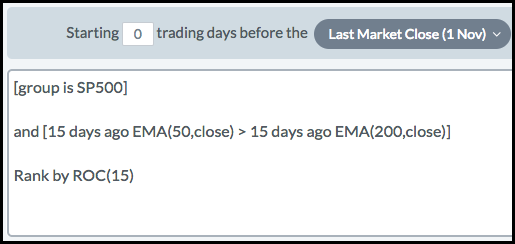
The image below shows the scan code used to scan for the exponential moving average 15 days ago and the current 15-day Rate-of-Change. Notice how the scan language is very simple and intuitive. Just preface the indicator with "15 days ago" to scan for the indicator value then. I then used the "Rank by" function to sort the results by the 15-day Rate-of-Change. The results can be exported to a ChartList or saved into a CSV file for further analysis.
Thus, all my scans start with a line of code to filter out stocks in long-term downtrends. Note that I do not even consider short positions when the S&P 500 is in a long-term uptrend. This simple trend filter would have kept me out of some of the big losers over the last three weeks, though not all. There is no such thing as the perfect indicator, but starting with the long-term trend is a good beginning.
******************************************************
ETF Master ChartPack - 300+ ETFs organized in a Master ChartList and in individual groups.
Follow me on Twitter @arthurhill - Keep up with my 140 character commentaries.
****************************************
Thanks for tuning in and have a good day!
--Arthur Hill CMT
Plan your Trade and Trade your Plan
*****************************************


