 |
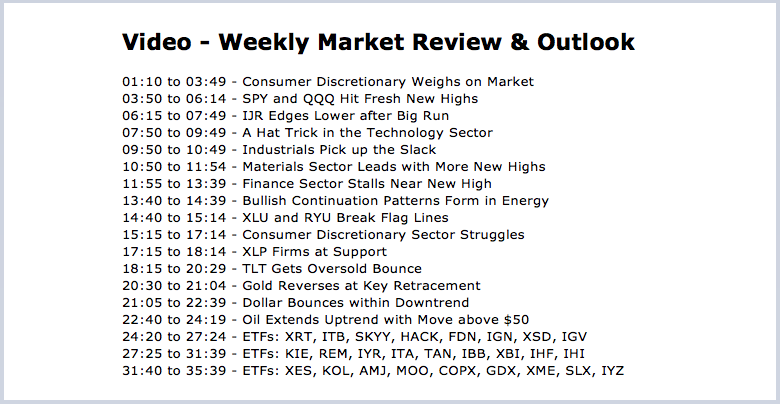
.... Consumer Discretionary Weighs on Market .... SPY and QQQ Hit Fresh New Highs .... IJR Edges Lower after Big Run .... A Hat Trick in the Technology Sector .... Industrials Pick up the Slack .... Materials Sector Leads with More New Highs .... Finance Sector Stalls Near New High .... Bullish Continuation Patterns Form in Energy .... XLU and RYU Break Flag Lines .... Consumer Discretionary Sector Struggles .... XLP Firms at Support .... TLT Gets Oversold Bounce .... Gold Reverses at Key Retracement .... Dollar Bounces within Downtrend .... Chartlist and Other Notes .... |
----- Art's Charts ChartList (updated October 13th) -----
Consumer Discretionary Weighs on Market
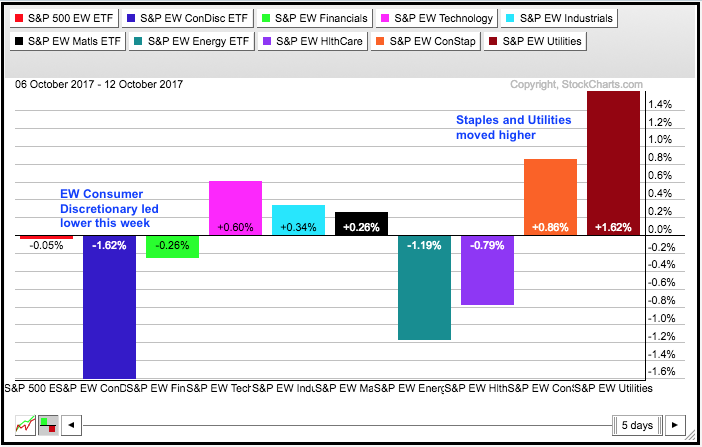
It has been a mixed week for the stock market with the consumer discretionary sector taking a hit and the defensive sectors, consumer staples and utilities, getting a bounce. Also note that small-caps are down this week. The S&P 500 SPDR and Nasdaq 100 ETF are trading near new highs after big run up since mid August and the market is looking defensive as we head into earnings season. I have no idea how earnings will unfold or the market's reaction to these earnings, but keep in mind that the major index ETFs are short-term overbought after big runs and ripe for some sort of rest. This could involve a pullback, a consolidation or a combination of the two (trading range).
SPY and QQQ Hit Fresh New Highs
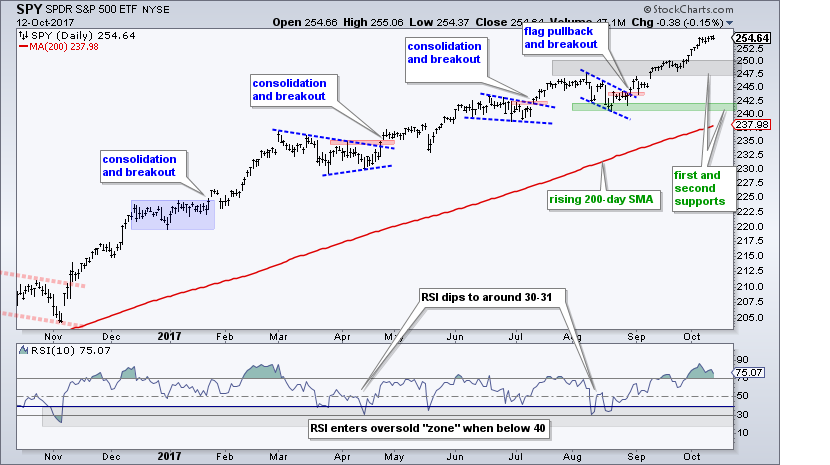
The S&P 500 SPDR (SPY) hit yet another new high this week, but did not move much the last five trading days. Keep in mind that SPY is up around 6% from its mid August lows (seven weeks) and ripe for a rest or a pullback. Broken resistance and the mid September stall mark first support in the 247-250 area, which is 2-3% from current levels. Key support remains in the low 240s.
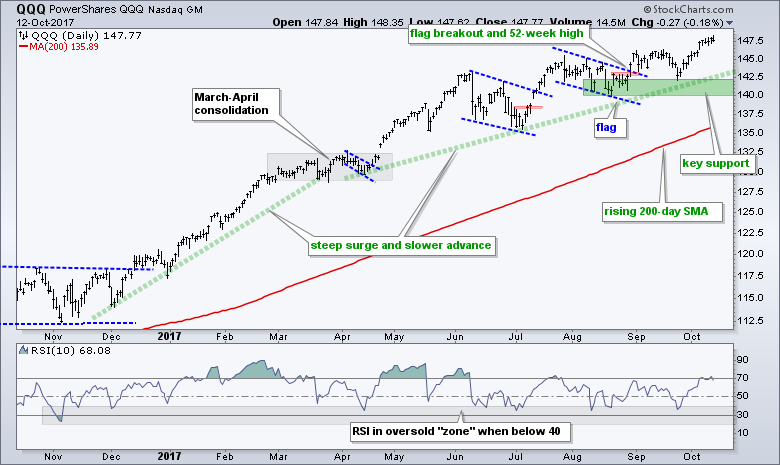
The Nasdaq 100 ETF (QQQ) also hit a new high and this simply affirms the underlying uptrend. Even though the advance appears to be slowing, there is a clear progression of higher highs and higher lows since summer. Momentum is not as strong as it was in late May, but there is clearly more upside momentum than downside momentum, and that is what really matters. Key support is set in the 140-142 area.
IJR Edges Lower after Big Run
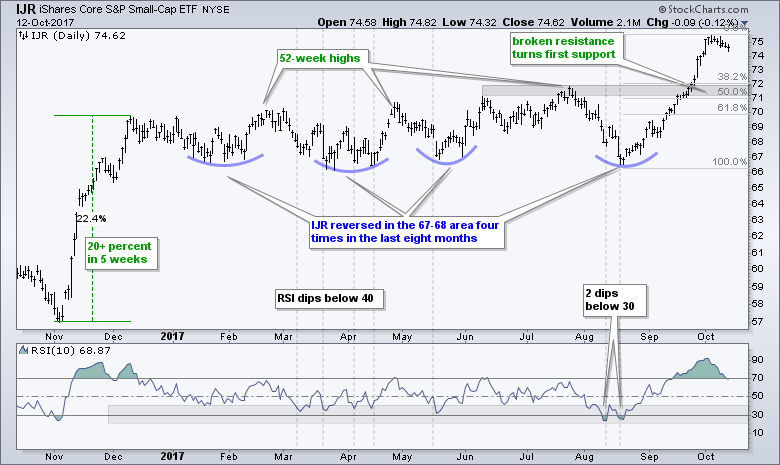
The S&P SmallCap iShares (IJR) fell back this week and did not hit a new high. IJR surged some 14% from the mid August low to the early October high and is still ripe for a rest. The June-July highs and the 38-50% retracement zone combine to mark the first support level to watch on a pullback. A move into the 71-72 area in IJR and RSI dip below 40 could set up the next opportunity.
A Hat Trick in the Technology Sector
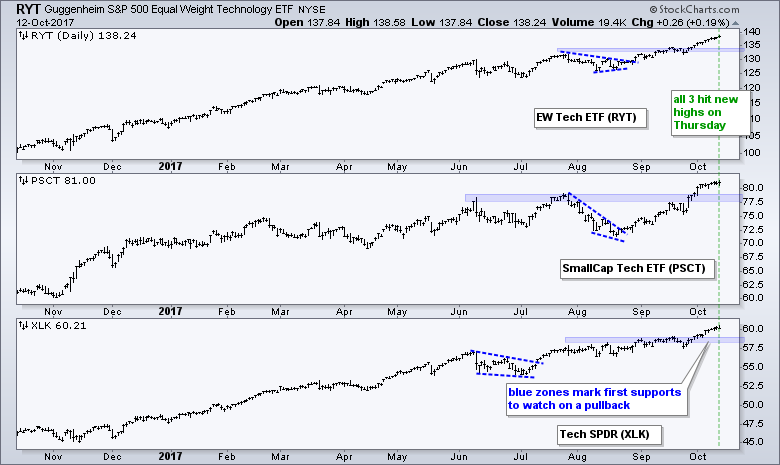
The technology and industrials sectors are the market leaders. Note that the SPDRs and equal-weight ETFs for technology and industrials hit new highs this week. These are the only two sectors with new highs in both versions. The Materials SPDR (XLB) hit a new high as well this week, but the EW Materials ETF (RTM) remains just short of a new high. The materials sector is by no means weak and remains in the top three. The chart below shows the Technology SPDR (XLK), EW Technology ETF (RYT) and SmallCap Technology ETF (PSCT) hitting new highs this week. I guess we can call this a technology hat trick.
Industrials Pick up the Slack
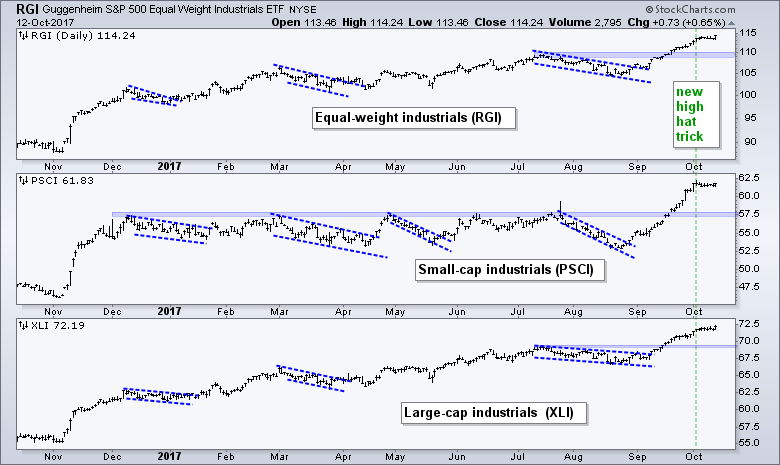
The industrials sector pulled a new high hat trick in early October when the Industrials SPDR (XLI), EW Industrials ETF (RGI) and SmallCap Industrials ETF (PSCI) hit new highs. XLI and RGI hit new highs again this week, but PSCI stalled out. All three are quite extended after big advances from late August to early October. The blue zones mark support from the broken resistance zone. These are the first areas to watch on a pullback.
Materials Sector Leads with More New Highs
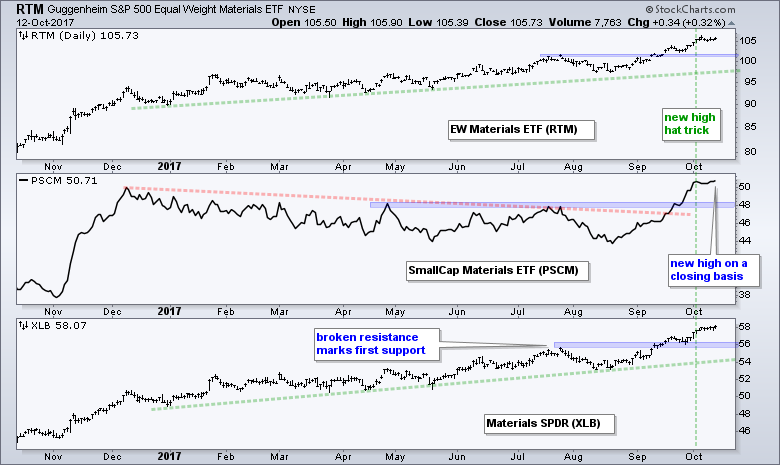
The materials sector scored a new high hat trick in early October when the EW Materials ETF (RTM), SmallCap Materials ETF (PSCM) and the Materials SPDR (XLB) hit new highs simultaneously. Note that the equal-weight and small-cap sector ETFs often have low volume and not well suited for trading. This does not, however, mean we cannot use them for analysis. The true strength of a sector can be measured by looking at these three versions. I elected to show close-only prices for PSCM because of the spike highs in December (not shown).
Finance Sector Stalls Near New High
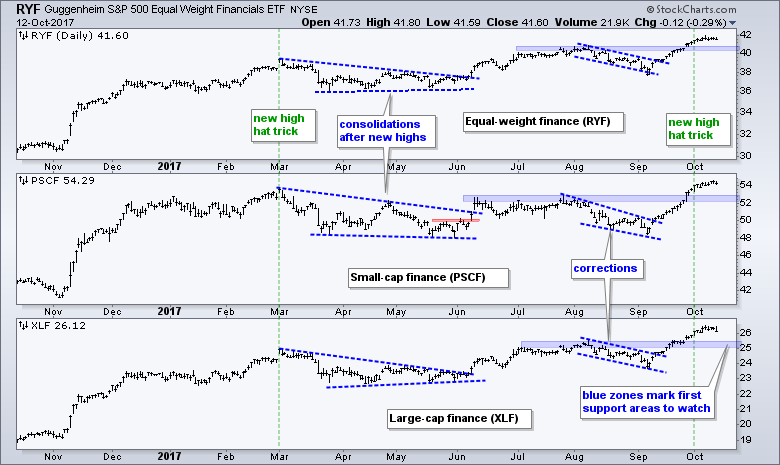
The Financials SPDR (XLF), EW Finance ETF (RYF) and SmallCap Financials ETF (PSCF) all hit new highs in early October and this is one of the stronger sectors in the market right now. As with the broader market, these finance ETFs are a little extended after sharp advances. This does not guarantee a pullback, but I am using broken resistance to mark first support.
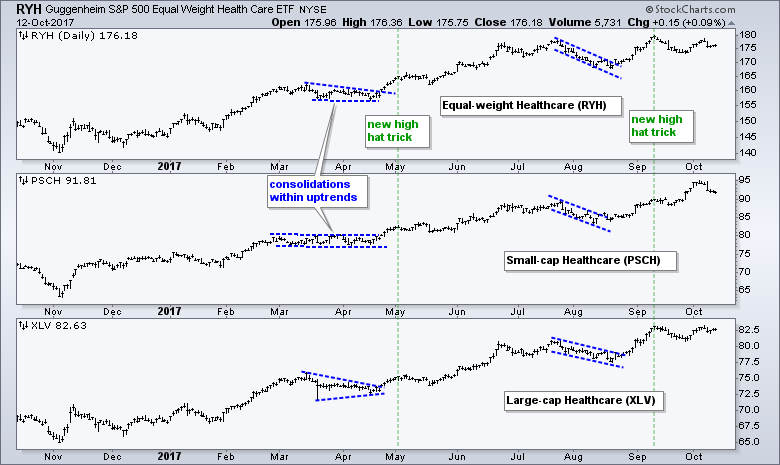
The healthcare sectors split over the last few weeks as the SmallCap HealthCare ETF (PSCH) hit a new high in early October, but the EW Healthcare ETF (RYH) and Health Care SPDR (XLV) fell just short of new highs. The overall trends for all three are up so I would not read too much into these non-confirmations just yet.
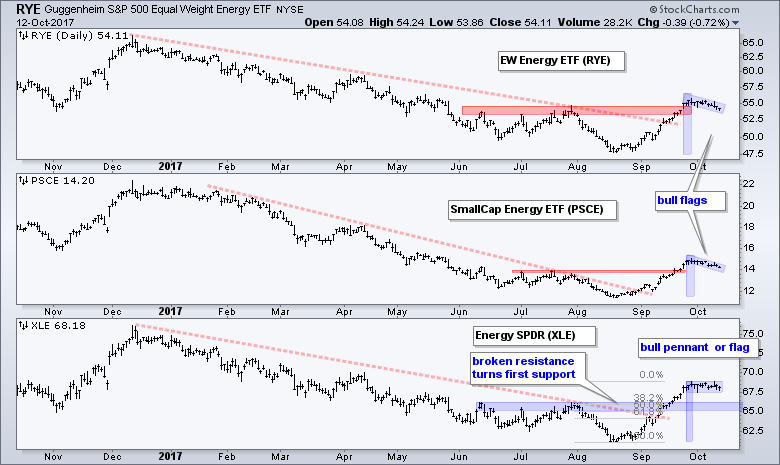
Bullish Continuation Patterns Form in Energy
The EW Energy ETF (RYE), SmallCap Energy ETF (PSCE) and Energy SPDR (XLE) all surged from mid August to late September and then stalled over the last two weeks. RYE and PSCE formed bull flags, while XLE formed a bullish pennant. These are short-term continuation patterns and upside breakouts would signal a continuation of the prior advance. I thought XLE might pullback to the breakout zone around 66, but a pullback is never guaranteed. I would expect energy stocks and ETFs to continue higher as long as oil holds its uptrend.
XLU and RYU Break Flag Lines
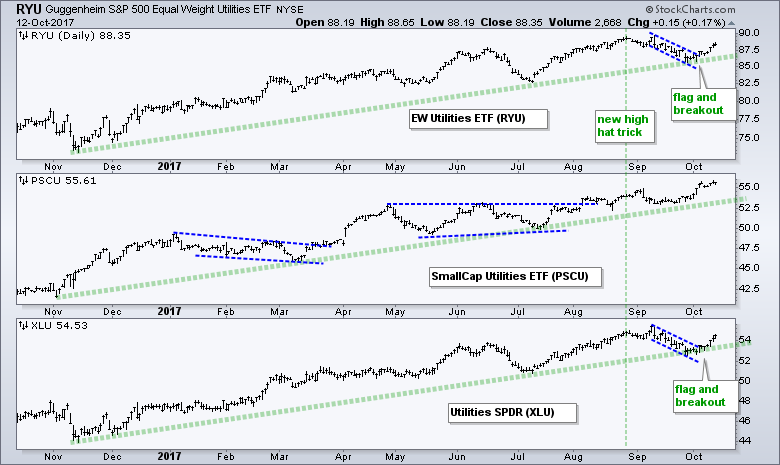
The EW Utilities ETF (RYU), SmallCap Utilities ETF (PSCU) and Utilities SPDR (XLU) are in long-term uptrends with all three hitting new highs in early September. The last new high hat trick was in late August. PSCU hit a new high this week as small-cap utilities led. RYU and XLU formed bull flags into early October and broke out with upturns over the last seven days.
Consumer Discretionary Sector Struggles
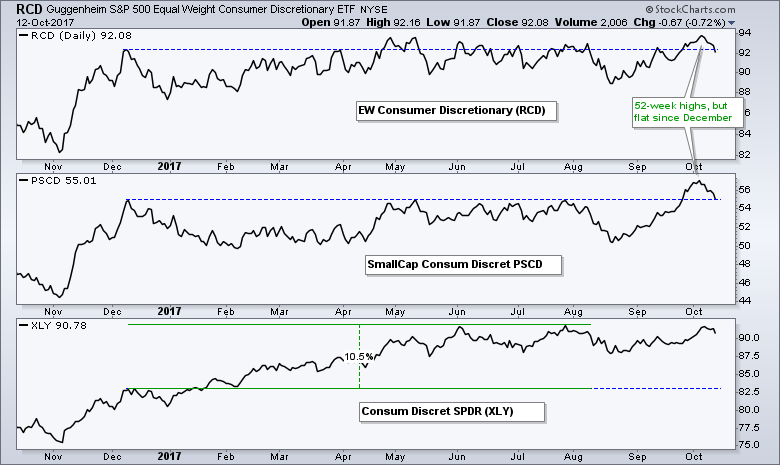
The EW Consumer Discretionary ETF (RCD) and the SmallCap Consumer Discretionary ETF (PSCD) have struggled all year. The Consumer Discretionary SPDR (XLY) has struggled since summer. Even though RCD and PSCD hit new highs in early October, they fell back and are trading near their December highs. In other words, they have nothing to show since December - 10 months ago. We can blame retail, restaurants, publishing and broadcasting.
While it sounds logical to consider underperformance in the consumer discretionary sector a negative for the broader market, the connection is not that clear. RCD is flat since December, but IJR is 7% above its December high and SPY is 14% above its December high. Underperformance in the consumer discretionary sector tells me that there are weak pockets in the market right now and these should be avoided. It also tells me to be VERY selective when picking stocks in this sector. Homebuilders, auto manufacturers, home improvement retailers, hotels and gambling are the bright spots in the sector.
XLP Firms at Support
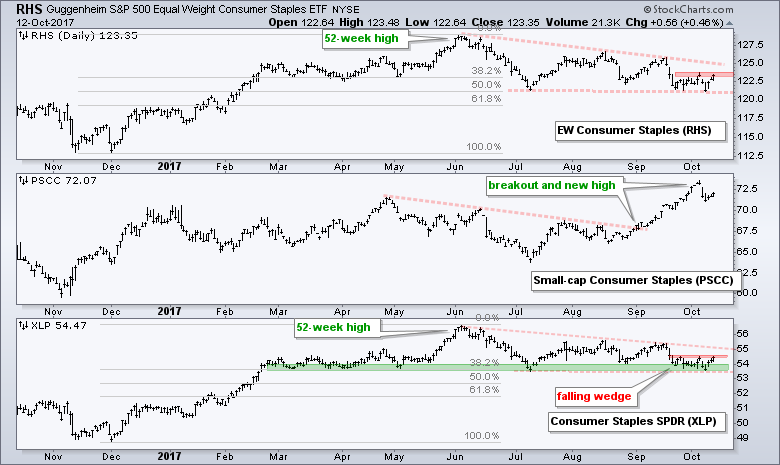
The SmallCap Consumer Staples ETF (PSCC) surged to a new high in early October and represents the strong area of the consumer staples sector. The EW Consumer Staples ETF (RHS) and Consumer Staples SPDR (XLP), on the other hand, peaked in early June and fell the last four months. These two are the weakest sectors since August. Despite underperformance since June, both formed falling wedge patterns and retraced around 50% of the prior advance (December to June). The retracement and the pattern are both typical for corrections within a bigger uptrend. Both ETFs firmed the last three weeks and breaks above the red resistance zones would be bullish here.
TLT Gets Oversold Bounce
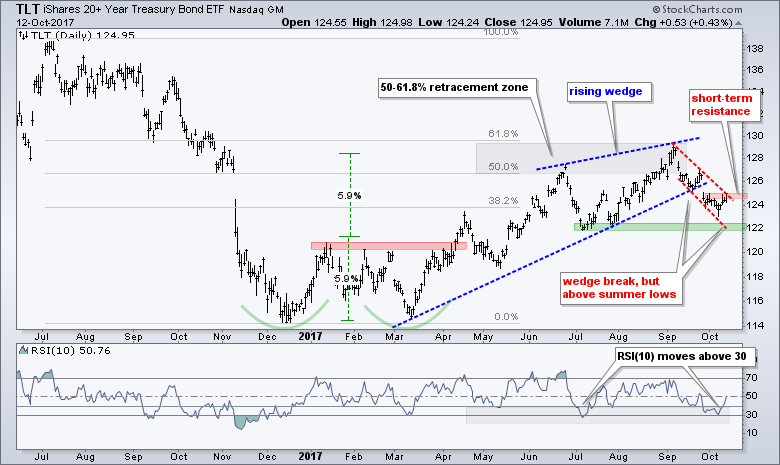
The 20+ YR T-Bond ETF (TLT) remains between a rock and a hard place. Long-term, the ETF reversed near the 61.8% retracement and broke the wedge trend line. The summer lows mark key support and the ETF bounced just above this support zone over the last few days. Thus, the long-term trend reversal has been put on hold. Short-term, the ETF remains within a downswing with resistance marked at 125. A breakout here would reverse the short-term downtrend and argue for a continuation of the 2017 uptrend. Notice that RSI became oversold and moved back above 30 this week. This is a short-term bullish signal for mean-reversion traders.
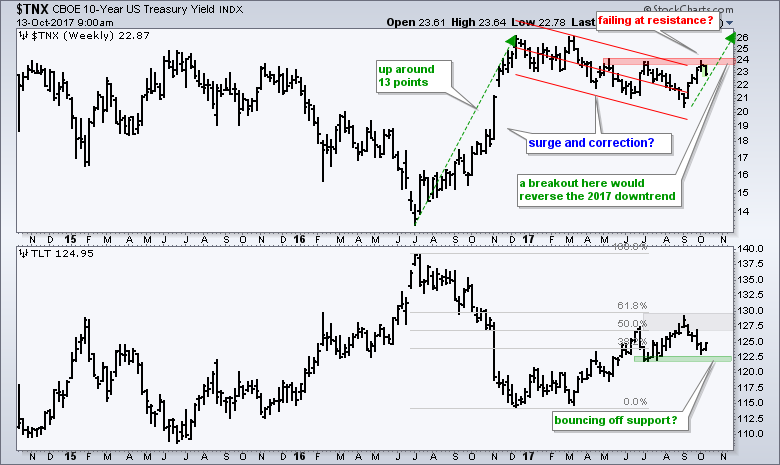
TLT is clearly at an important area right now. An upturn would be bullish and point to lower Treasury yields. This would be positive for utilities and gold, but negative for banks. A breakdown at 122 would be quite bearish and point to higher Treasury yields. This would be negative for utilities and gold, but positive for banks.
Gold Reverses at Key Retracement
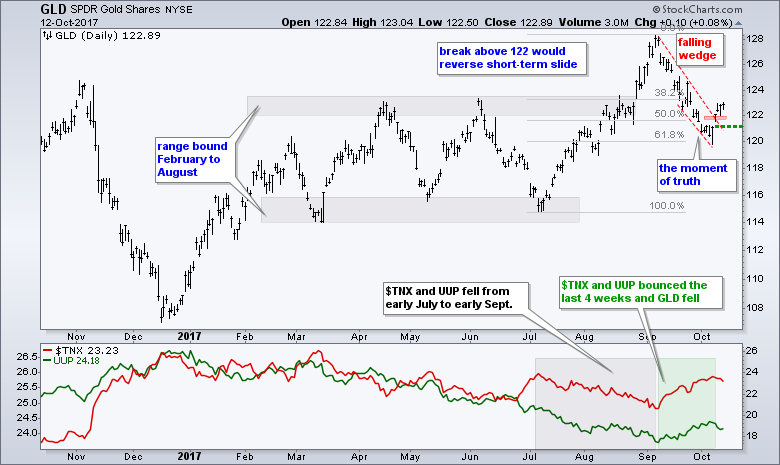
The Gold SPDR (GLD) surged above 122 for a breakout. Overall, the ETF broke out with a move to 128 in September and then retraced 62% of the move with a decline back to 120. A falling wedge took shape and GLD broke wedge resistance with the surge above 122. A close below 121 would negate this breakout and call for a re-evaluation.
Dollar Bounces within Downtrend
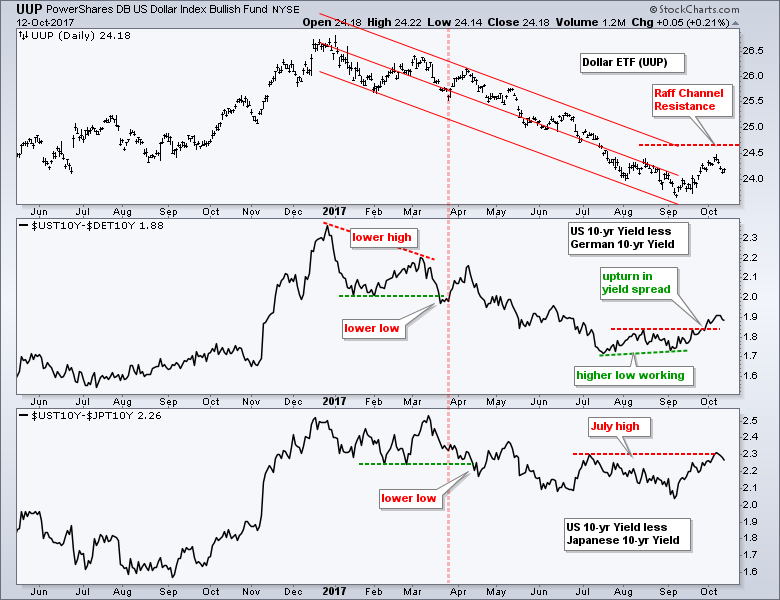
The US Dollar ETF (UUP) remains in a downtrend overall and I am now using a Raff Regression Channel to define this downtrend. I think the mid August high is not important enough to be considered a serious resistance level. The upper line of the Raff Regression Channel ends around 24.7 and this defines the downtrend. A break above this level would argue for a trend reversal. The middle window shows the spread between the German 10-yr yield and US 10-yr yield breaking above its mid August high and widening. This is a positive development for the Dollar, as long as it holds.
Oil surged back above $50 on Tuesday and is up around 2% in early trading on Friday. After a rather short and sharp pullback below $50 in early October, this bounce is bullish and keeps the overall uptrend alive. I am now raising key support to 9.75 for USO and 48 for November Crude (^CLX17). I am concerned that the advance from June may be a counter trend bounce, but the trend is clearly up as long as these supports hold.
Chartlist and Other Notes
The first 11 bullet points (up to XME) are for charts in the Art's Charts ChartList. The remaining bullet points are just chart observations.
- XRT failed to hold the break above the summer highs and broke upswing support.
- HACK pulled back to the flag breakout, which may offer support.
- Techs Rock: XLK, SKYY, FDN, SOXX, XSD and IGV hit new highs this week.
- KRE is still lagging year-to-date because it did not exceed its February high.
- Like clockwork, IYR formed a higher low and turned up at the channel trend line.
- Industrials also rock as XLI, ITA and IYT hit new highs. JETS could be next.
- IBB and XBI are holding above their wedge-flag breakouts.
- IHF did not hold the triangle breakout and is testing support.
- XES hit resistance at the summer highs. Watch the breakout zone for first support.
- GDX held the breakout zone and 50-62% retracement, and turned up.
- XME is struggling to hold the wedge breakout. Watch support at 31.
- Over 70% of stocks in $SPX, $MID and $SML are above their 200-day EMAs
- The US Gasoline ETF ($UGA) has a falling wedge working since early Sept. Watch 29 for a breakout.
- The US Brent Oil ETF (BNO) has a bull flag working since late September.
- The Base Metals ETF (DBB) hit a new high. The Copper ETN (JJC) and Aluminum ETN (JJU) are close to a new highs.
- PFPT has a bullish ascending triangle working from June to October.
******************************************************
ETF Master ChartPack - 300+ ETFs organized in a Master ChartList and in individual groups.
Follow me on Twitter @arthurhill - Keep up with my 140 character commentaries.
****************************************
Thanks for tuning in and have a good day!
--Arthur Hill CMT
Plan your Trade and Trade your Plan
*****************************************

