.... Microsoft Leads Fab Five with New High
.... Alphabet Breaks Triangle Line
.... Apple Reverses after Oversold Reading
.... Amazon Breaks Wedge Line
.... Avago Pattern Evolves into Ascending Triangle
.... Cornerstone OnDemand Forms Double Bottom
.... Universal Display Firms at Support and Zoetis Turns Up
.... Understanding Cryptos and Blockchain
.... Bitcoin Index Hits New High ....
Microsoft Leads Fab Five with New High
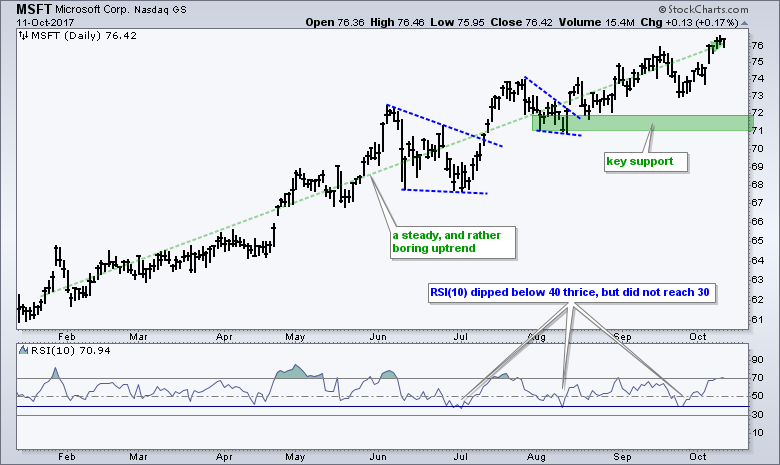
Today will start with the five largest stocks in the Nasdaq 100 ETF (QQQ). One is leading with a new high, two are less than 2% from a new high and two appear to be coming out of corrections. Microsoft continues to lead the Fab Five with fresh new highs this week. As the chart below shows, it is just a steady and boring uptrend. Not much else to add.
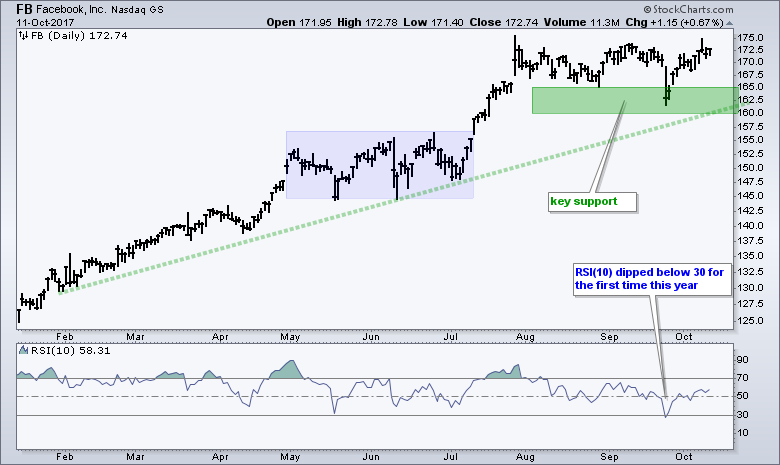
Facebook (FB) is the next strongest because it has consolidated near 52-week highs over the last two months. Notice how the stock seemed to break down with the sharp decline below 165 in late September, but bounced right back and is now challenging the prior highs. More often than not, a short-term oversold condition is an opportunity to partake in the uptrend, not a threat to derail it.
Alphabet Breaks Triangle Line
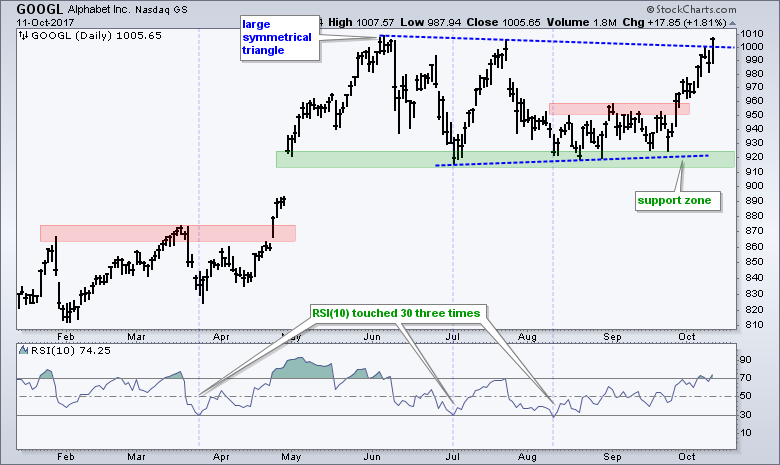
I featured Alphabet (GOOGL) in DITC on October 4th as it bounced off support with good volume. This bounce extended and GOOGL just broke the upper line of a symmetrical triangle. In addition, GOOGL is close to recording a 52-week high. Notice that the three dips to the 30 area in RSI marked short-term oversold conditions that presented an opportunity.
Apple Reverses after Oversold Reading
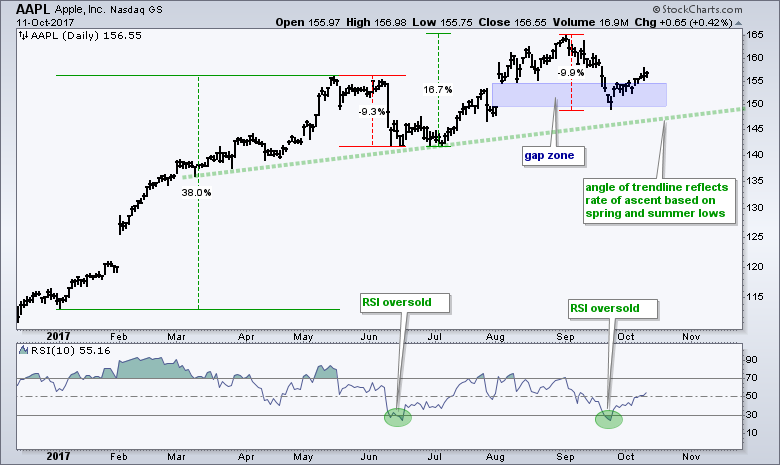
Apple is turning back up after falling around 10% from its early September high. I last wrote about Apple and the Fab Five on September 7th. FB and GOOGL did not quite go as forecast, but AAPL is sticking to the script - so far. I marked the blue support zone then and suggested that AAPL could pull back to this gap zone. The stock did dip into this zone and RSI(10) dipped below 30 to become oversold for the second time this year. AAPL subsequently turned up with a small gap on 26-Sep and I think this signals an end to the pullback. The bigger trend is up so I would expect a continuation of this trend to produce new highs in Apple before yearend.
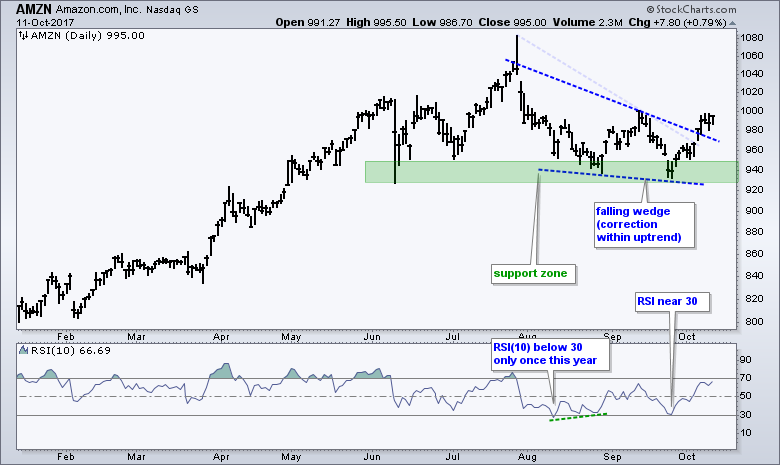
Amazon Breaks Wedge Line
Amazon is the weakest of the Fab Five because it is the furthest below its 52-week high. Nevertheless, the long-term trend is up and the stock just broke out of a falling wedge. The falling wedge represents a correction within the bigger uptrend and the breakout indicates that this correction has ended.
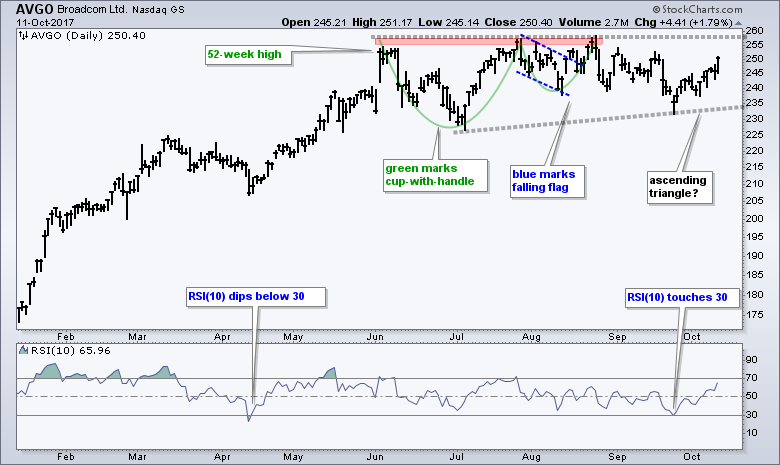
Avago Pattern Evolves into Ascending Triangle
I featured Avago (AVGO) in late August as the cup-with-handle took shape and the stock broke flag resistance. The breakout did not turn out as expected and the stock did not break rim resistance. Despite dipping below 235, I still think the chart is bullish with a long-term uptrend and an extended consolidation. The gray lines show a possible ascending triangle taking shape and an upside breakout would signal a continuation higher. Notice that RSI(10) touched 30 in late September and this provided a nice opportunity dip.
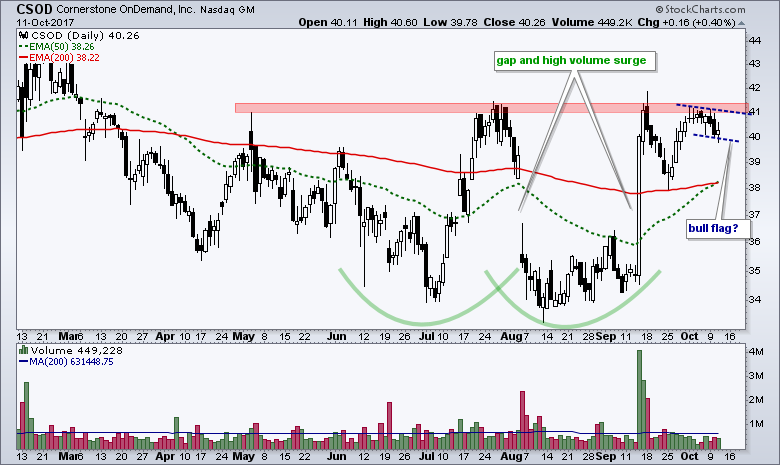
Cornerstone OnDemand Forms Double Bottom
CSOD has a double bottom working with support in the 34 area and resistance in the 41 area. The stock gapped down in early August and then filled the gap with a high-volume surge in mid September. A small falling flag is taking shape now and a breakout at 41 would likely lead to a double bottom breakout.
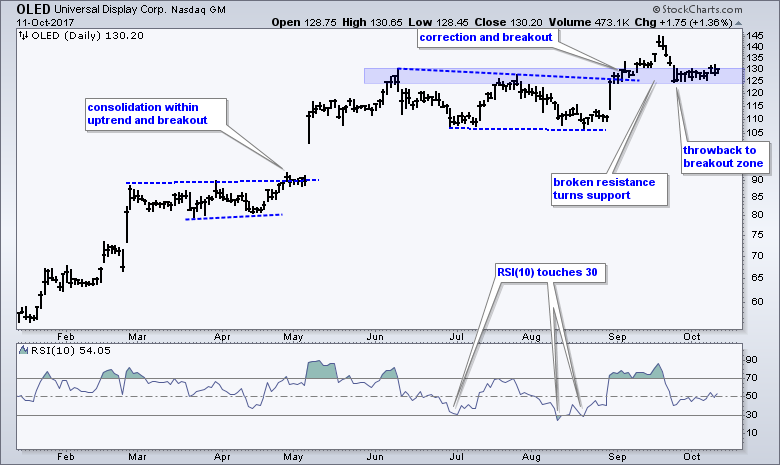
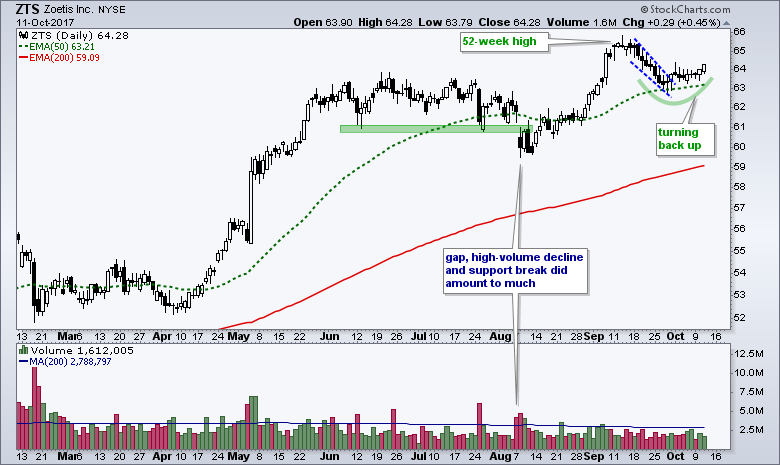
Universal Display Firms at Support as Zoetis Turns Up
Understanding Cryptos and Blockchain
In this video, James Disney, head of Blockchain at Credit Suisse, shares how this investment bank can use Blockchain technology to significantly speed up the LBO process (leveraged buy outs). Also note that Fidelity became active in the space this year and Japan has officially recognized Bitcoin exchanges. It may seem like a stampede, but we are still in the early innings and a lot can happen (change).
Patrick O'Shaughnessy of InvestorFieldGuide.com just completed an excellent three-part podcast on Blockchains & Crytocurrencies. Blockchain is complicated stuff, but the possibilities are fascinating and it looks like this technology is here to stay. In fact, the technology behind blockchain could revolutionize a number of business and processes. Blockchain is the key word here, not Bitcoin.
One guest compared crytocurrencies to email services in the early days of the internet. Blockchain represents the internet in this story and Bitcoin represents an email service. Lots of email services sprung up in the early days of the internet, but most of them ultimately failed.
This got me to thinking because the same goes for the internet portals and the first social sites. Anyone remember Altavista, CompuServe, Excite, Lycos, Geocities, Prodigy, Friendster or MySpace? Anyone still use them?! Facebook and Google did not even exist back then and they are the current leaders. Personally, I do not know enough about Bitcoin, Ethereum and the other crytocurrencies to pick the winners and the losers. It is a special space that one should fully understand before considering an investment.
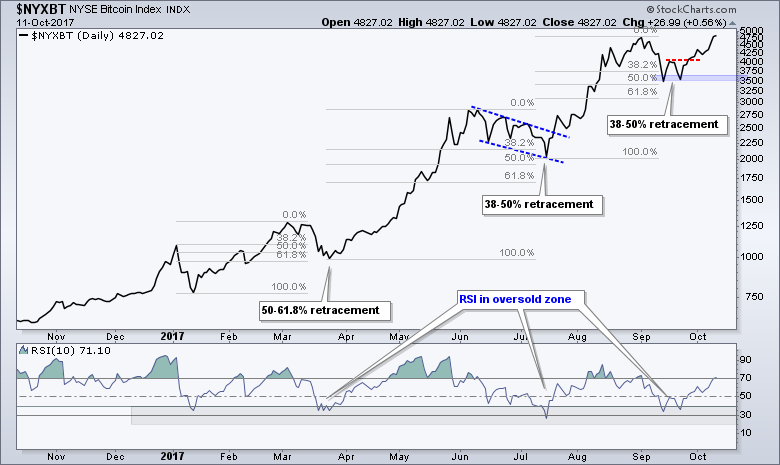
Bitcoin Index Hits New High
On the price chart, the NYSE BitCoin Index ($NYXBT) hit a new high this week and extended its uptrend. I highlighted this index on 15-Sep as it neared the 50% retracement and RSI entered the oversold zone (20-40). The index tested the 3500 area twice and broke above the mid September high. The trend is clearly up on this chart with the September lows marking key support around 3500, which is 28% lower than current prices. Yep, that is a long way off and highlights the risk associated with BitCoin. I do NOT plan to cover Bitcoin on a regular basis, but will periodically check in on the chart.
******************************************************
ETF Master ChartPack - 300+ ETFs organized in a Master ChartList and in individual groups.
Follow me on Twitter @arthurhill - Keep up with my 140 character commentaries.
****************************************
Thanks for tuning in and have a good day!
--Arthur Hill CMT
Plan your Trade and Trade your Plan
*****************************************


