.... A Raging Battle in the Bond Market
.... Junk Bond Update
.... Big Banks Shrug off Yield Plunge
.... Copper Corrects with Bullish Wedge
.... And then there were Three
.... Biotech SPDR Becomes Oversold Again
.... Competition Increasing for NetFlix
.... Disney Goes for Lift Off ....
A Raging Battle in the Bond Market
There is a big battle raging in the bond market because the long-term bonds are diverging from medium-term bonds. Keep in mind that markets are forward thinking beasts and current price action reflects what will happen in the coming months (economy, inflation, Fed policy). The 20+ YR T-Bond ETF (TLT) represents the long end of the yield curve and the 7-10 YR T-Bond ETF (IEF) represents the belly, or middle, of the yield curve. Bonds with longer maturities have the longest durations, which reflects their sensitivity to changes in interest rates. For example, a 30-yr Bond will be much more sensitive to a change in interest rates than a 5-yr Bonds. This is why the long end of the curve is important to watch.
The chart below shows unadjusted prices for the 20+ YR T-Bond ETF (_TLT) and the 7-10 YR T-Bond ETF (_IEF). I am using unadjusted prices to show the capital gain/loss in holding a position (without dividends). The adjusted price, in contrast, includes the monthly payouts and reflects the total return for holding this ETF. Chartists can plot unadjusted prices by preceding the symbol with an underscore (_TLT). Unadjusted IEF bounced off the 61.8% retracement and support zone on Wednesday, but has yet to break above its mid October high (red zone).
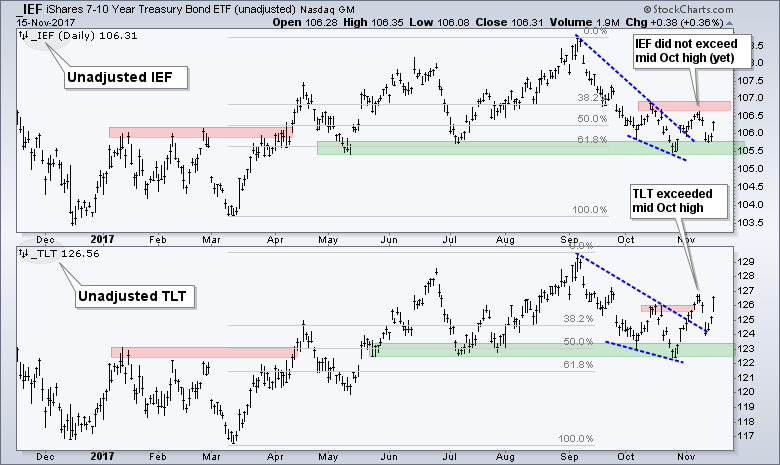
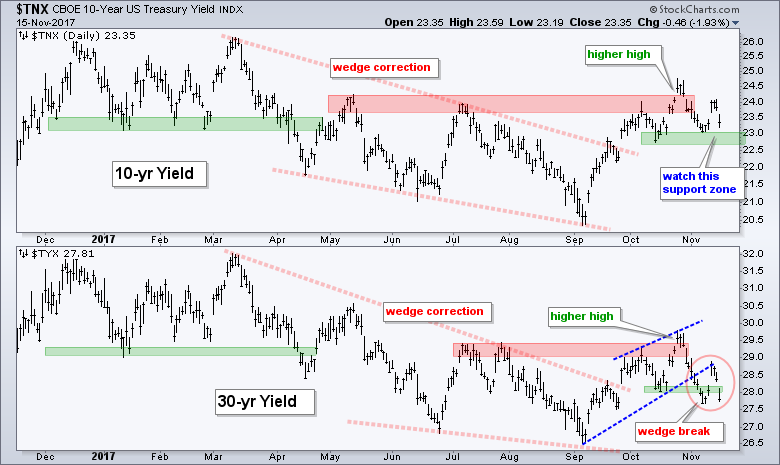
Unadjusted TLT, on the other hand, broke above its mid October high in early November and surged back above the breakout zone on Wednesday. The falling wedge in Unadjusted TLT reversed with the breakout in November, but Unadjusted IEF remains short of a full reversal. Look for a breakout at 107 to complete this reversal. Such a move would be very bullish for long-term bonds and point to lower Treasury yields. The next chart shows the 10-yr T-Yield ($TNX) above the mid October low and the 30-yr T-Yield ($TYX) below the mid October low. $TYX broke wedge support and appears headed lower. Let's see if $TNX follows suit.
Programming Note:
I will be taking some vacation next week and Art's Charts will not be published from 20 to 24 November. I will return the week after Thanksgiving. Happy Turkey Day!
Junk Bond Update
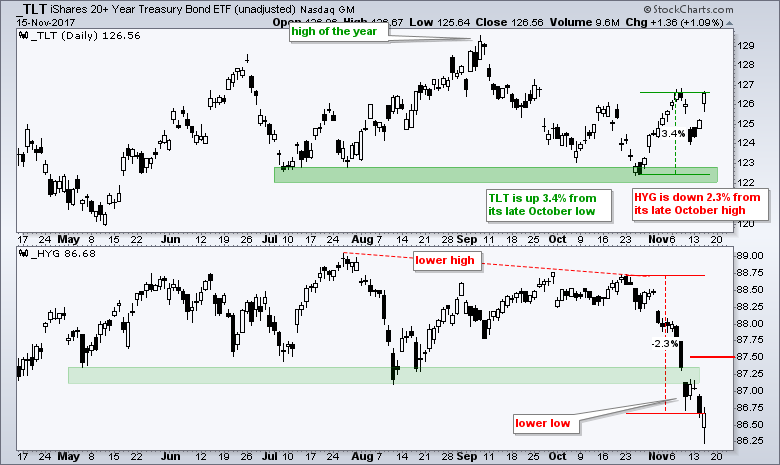
The Unadjusted High-Yield Bond ETF (_HYG) fell further this week and is now down around 2.3% from its late October high. In contrast, Unadjusted TLT is up around 3.4% from its late October low. This shows a clear preference for safety over risk in the bond market. _HYG managed to close off its low of the day and near the high of the day. This could have sparked the recovery seen in financial stocks on Wednesday (see below). I am not going to read too much into a one-day oversold recovery though. The junk bond ETF formed a lower high in October and broke the August lows. As far as I am concerned, the ETF needs to surge back above 87.50 negate this break down.
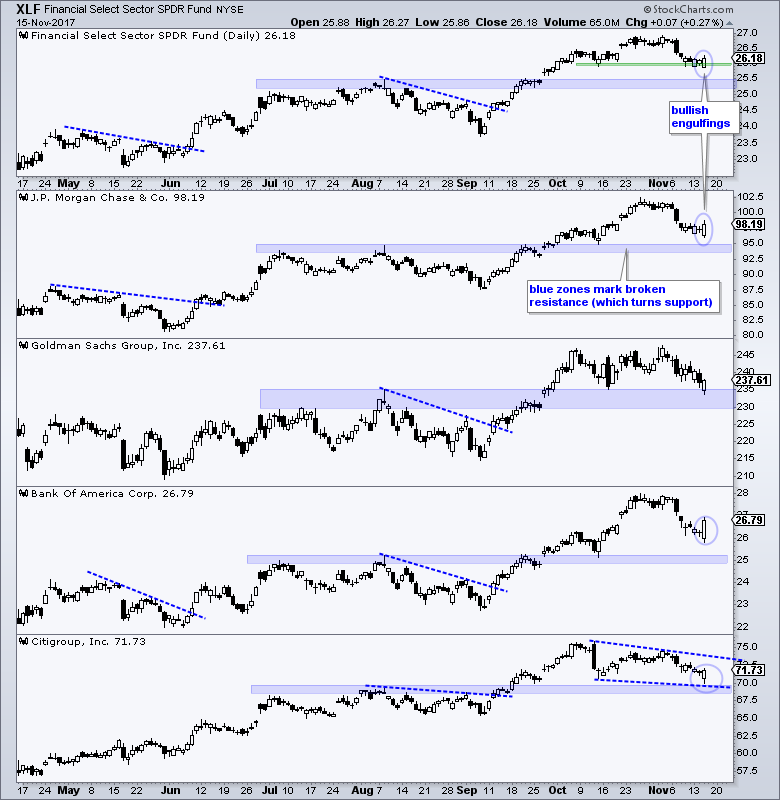
Big Banks Shrug off Yield Plunge
Banking stocks shrugged off the plunge in Treasury yields and closed strong on Wednesday. The Financials SPDR (XLF) was up .27% and closed off its lows as the 10-yr T-Yield fell from 2.38% to 2.33%. Banks have been positively correlated to Treasury yields this year so Wednesday's action is a bit of a surprise. Let's see if it holds. The chart below shows the Financials SPDR (XLF) forming a bullish engulfing near the October lows (support zone). A follow through above 26.5 would be short-term bullish for XLF. The second window shows JP Morgan Chase (JPM) forming a bullish engulfing just above the broken resistance zone, which turns into a support zone. The third window shows Goldman Sachs (GS) testing the broken resistance zone. The fourth window shows Bank of America (BAC) with a big bullish engulfing and the biggest gain of the group. And finally, the last window shows Citigroup with a bullish engulfing near broken resistance.
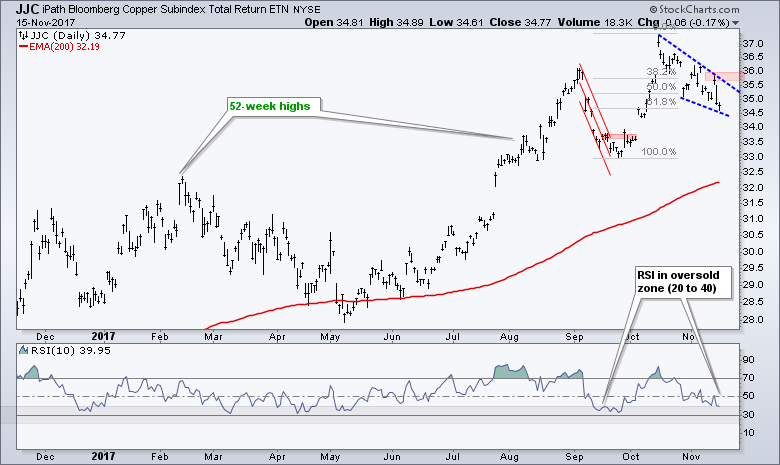
Copper Corrects with Bullish Wedge
The Copper ETN (JJC) is up over 20% year-to-date and in a long-term uptrend. The ETF hit new highs in February, August, September and October. JCC corrected after the most recent high with a falling wedge that retraced 61.8% of the prior advance. Both the wedge and the retracement amount are typical for corrections. RSI also dipped below 40 on Wednesday (39.95%). Thus, JJC is also mildly oversold. The combination makes JJC ripe for a bounce so chartists should be on alert for some sort of short-term bullish catalyst.
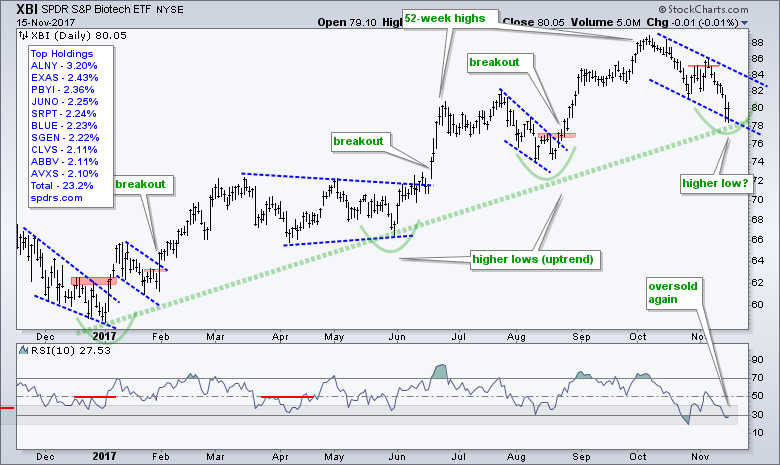
Biotech SPDR Becomes Oversold Again
IBD has an interesting take on the reason for the decline in biotechs. In short, bigger companies are opting for partnerships with smaller companies instead of simply buying them out. This is taking the merger premium out of smaller biotechs. Not sure if I buy it, but it is an interesting observation.
According to the SPDR website, there are 100 stocks in the Biotech SPDR (XBI). Of these, 19 are up over the last six weeks and 81 are down. The average gain for the 19 advancers is 15.16% and the average loss for the 81 decliners is 17.64%. 31 of the 100 stocks are down 20% or more since early October. Talk about some serious carnage.
The chart below shows the Biotech SPDR (XBI) falling around 10% over the last six weeks. This 10% decline, however, is after a 20% advance from early August to early October. Thus, XBI still has the two steps forward and one step backward uptrend working. I thought XBI was poised to bottom in late October, but the mini breakout failed and the ETF fell back to the 80 area. XBI is still considered a valid mean-reversion setup because the long-term trend is up and RSI(10) is oversold.
And then there were Three
S&P Dow Jones Indices announced that they will revamp their GICS structure and changed the Telecommunications Services Sector ($SPTS) to the Communications Services Sector. Note that $SPTS only has three stocks: AT&T (T), Verizon (VZ) and CenturyLink (CTL). Accordingly, "the renamed Sector will include the existing telecommunication companies, as well as companies selected from the Consumer Discretionary Sector currently classified under the Media Industry Group and the Internet & Direct Marketing Retail Sub-Industry, along with select companies currently classified in the Information Technology Sector." This could include FB, AMZN, GOOGL, NFLX, T and DIS. Don't expect this anytime soon though. In true bureaucratic fashion, they will roll this out in September 2018.
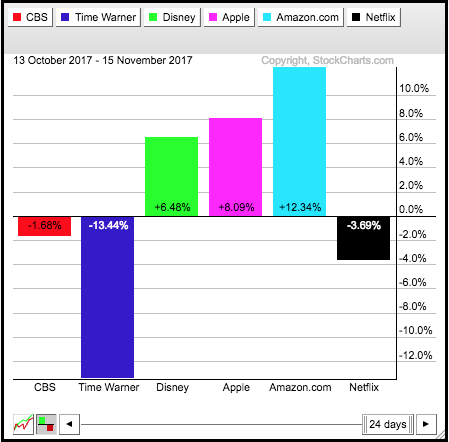
Competition Increasing for NetFlix
IBD reports that Netflix is still the king of streaming, but we can expect a lot more competition in 2018. In addition to other players ramping up their offerings, expect Apple to enter the fray next year. The PerfChart below shows one month performance for six players: CBS, TWX, DIS, AAPL, AMZN and NFLX). Netflix is the only pure play here because the others are more diversified in their offerings. Of note, Netflix (NFLX) is down a little over the past month and Disney has come to life.
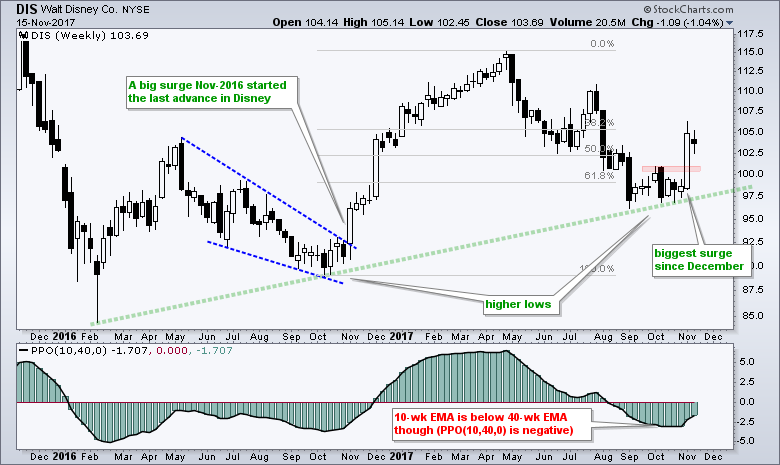
Disney Goes for Lift Off
The chart below shows Disney (DIS) surging above resistance from the mid October high with the biggest weekly gain since early December. The case can be made for a big uptrend since early 2016 with a higher low in October 2016, a 52-week high in April and a higher low in September-October 2017. Notice how the stock firmed in the 97-100 area for two months and this area also marks a 61.8% retracement of the prior advance. The surge and breakout look bullish and the breakout zone around 101 is the first area to watch on a pullback.
******************************************************
ETF Master ChartPack - 300+ ETFs organized in a Master ChartList and in individual groups.
Follow me on Twitter @arthurhill - Keep up with my 140 character commentaries.
****************************************
Thanks for tuning in and have a good day!
--Arthur Hill CMT
Plan your Trade and Trade your Plan
*****************************************


