.... Medical Devices Group Leads Healthcare
.... Medtronic Bids to End Correction
.... Abbot Labs Leads Medical Device Group
.... Boston Scientific Bounces from Oversold Levels
.... Four Medical Device Stocks (WAT, VAR, ALOG, CMD)
.... First Oversold Readings Since Breakouts (BMY, BIIB)
.... Discount Brokers Consolidate within Uptrends
.... Banks, Utilities, Gold and the 10-yr T-Yield ....
Medical Devices Group Leads Healthcare
The Medical Devices ETF (IHI) is very close to a new high and one of the leading industry group ETFs this year. Note that volume averages around 120,000 shares and this is not one of the most active ETFs. Nevertheless, we can use this ETF as a litmus test for the industry group. Chartists can also easily access the components and the weightings for this ETF by going to the iShares website (ishares.com). This is very important when analyzing any index or ETF. We need to know the components AND their weightings to determine the key drivers. IHI has 51 stocks and the top ten stocks account for 62.8% of the ETF. As with most indexes and ETFs, IHI is clearly top heavy with the largest stocks dominating.
The chart below shows IHI with a steady uptrend since December and a new (closing) high last Thursday. The top window shows the PPO(50,200,0) in positive territory over the past year. The new highs and positive PPO establish the trading bias, which can only be bullish when the long-term trend is up. The blue dashed lines mark small pullbacks along the way.
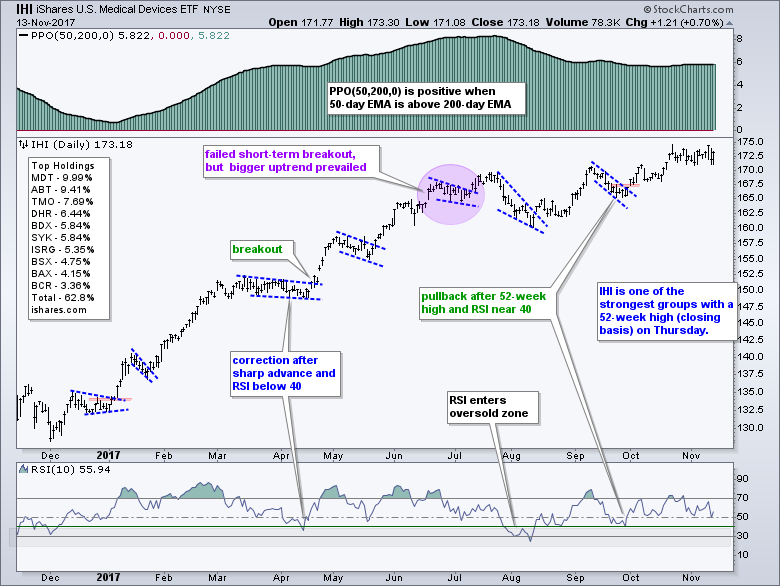
The bottom window shows RSI(10) moving below 40 only twice this year. Thus, traders using RSI to time short-term oversold conditions would have had just two opportunities. The blue dashed lines show seven small pullbacks that also offered opportunities. The blue circle highlights a failed breakout that did NOT result in a long-term trend reversal. My testing shows that stop-losses do not improve performance when the bigger trend is up. This breakout failure was short-term negative, but the long-term uptrend eventually prevailed and the ETF moved to new highs. Even though there will always be exceptions, my testing suggests that profit targets and risk-of-ruin stops work best. For example, chartists should consider taking profits after a 10-15% gain and/or exit when the long-term trend reverses (close below 200-day SMA or 50-day EMA moving below 200-day EMA). One is not always better than the other. This is simply a fielder's choice.
Medtronic Bids to End Correction
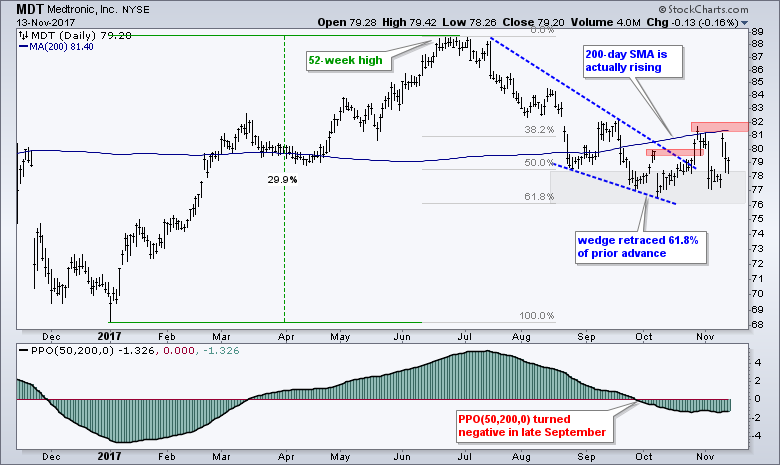
Medtronic (MDT) is the biggest component (9.99%) in IHI, but it is clearly not keeping pace with the ETF. IHI is near a 52-week high and MDT could be considered in a downtrend because the 50-day EMA is below the 200-day EMA (PPO(50,200,0) is negative). Nevertheless, when I stand back and look at the chart, the decline from July to October looks like a big correction. This decline retraced around 61.8% of the prior advance, which was 30%. A falling wedge formed and MDT broke out with a surge in late October. The stock fell back after the breakout, but surged with a gap after earnings last week. A trend reversal could be in the making here and a second breakout at 82 would be very bullish.
Abbot Labs Leads Medical Device Group
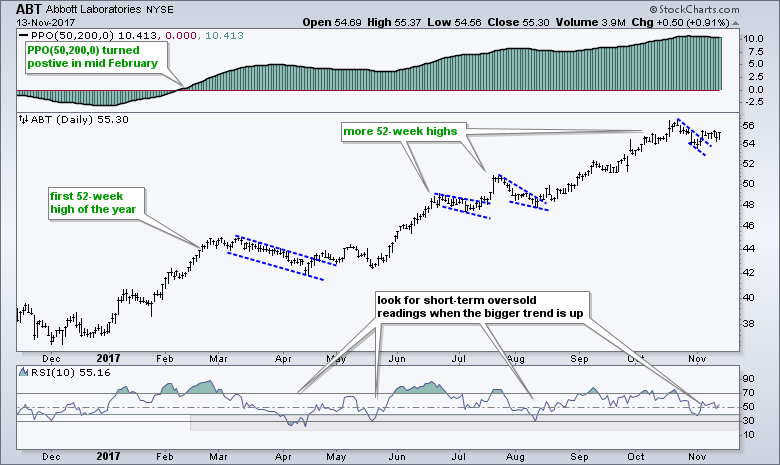
Abbot Labs (ABT) is the second largest component in IHI and weighs (9.41%) about as much as Medtronic. ABT hit its first 52-week high in late February and the 50-day EMA crossed above the 200-day EMA in mid February. RSI(10) dipped into the oversold zone (20-40) four times since then. The most recent dip was in early November and ABT broke out of a small flag last week.
Boston Scientific Bounces from Oversold Levels
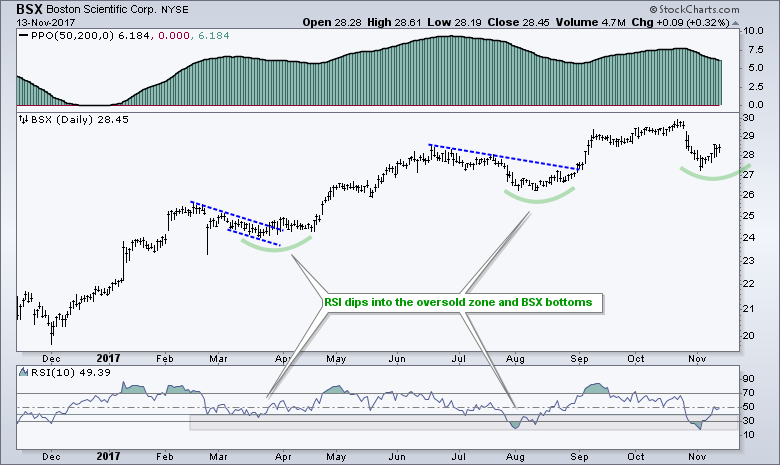
The next chart shows Boston Scientific (BSX) in a long-term uptrend and RSI dipping into the oversold zone in late October and early November. The last two dips foreshadowed price lows as the stock turned back up in late April and late August.
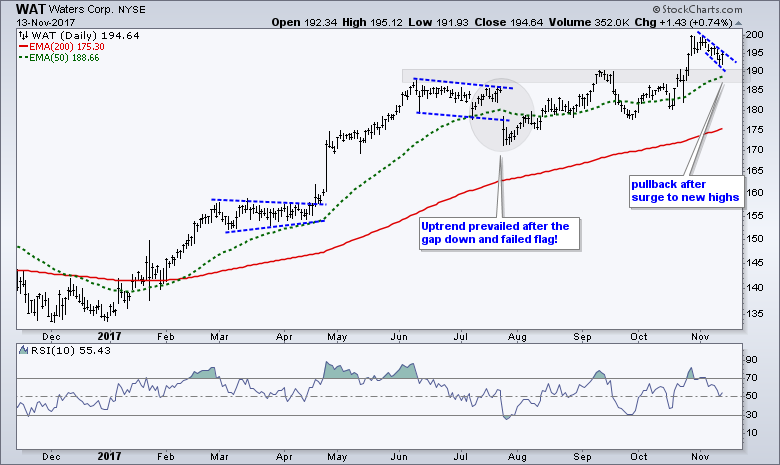
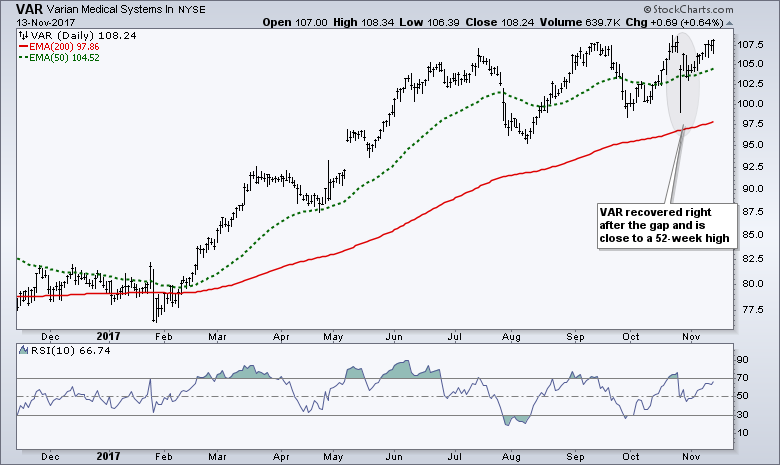
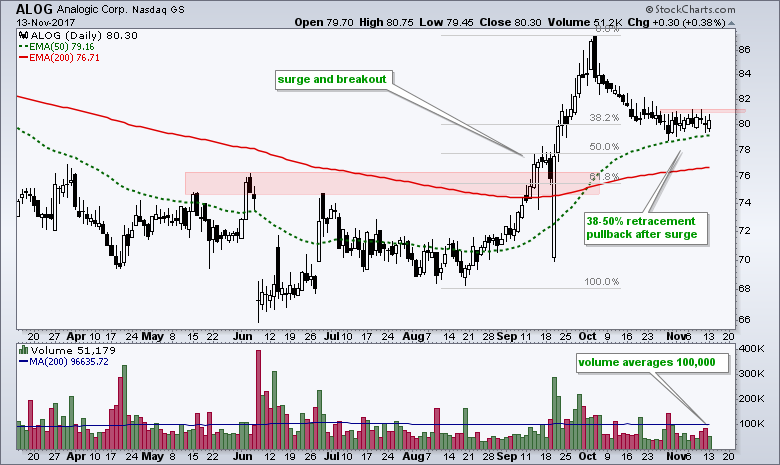
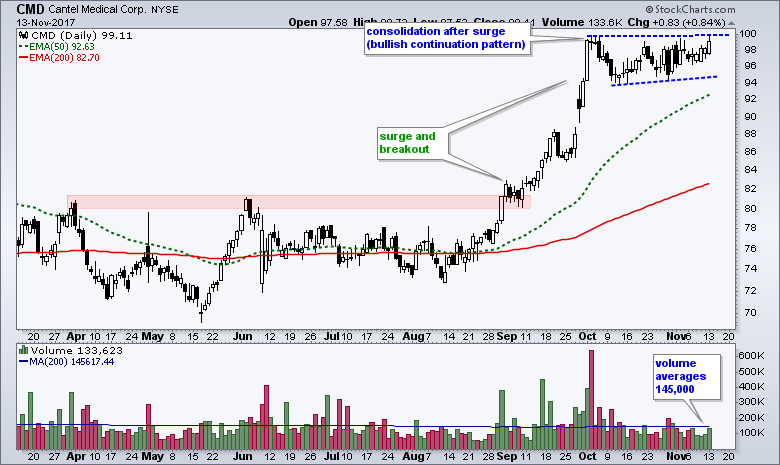
Four Medical Device Stocks (WAT, VAR, ALOG, CMD)
The next charts show four other stocks from the Medical Devices ETF. The last two (ALOG and CMD) are small-caps with average volume below 150,000 shares. This means they carry a little extra risk (volatility).
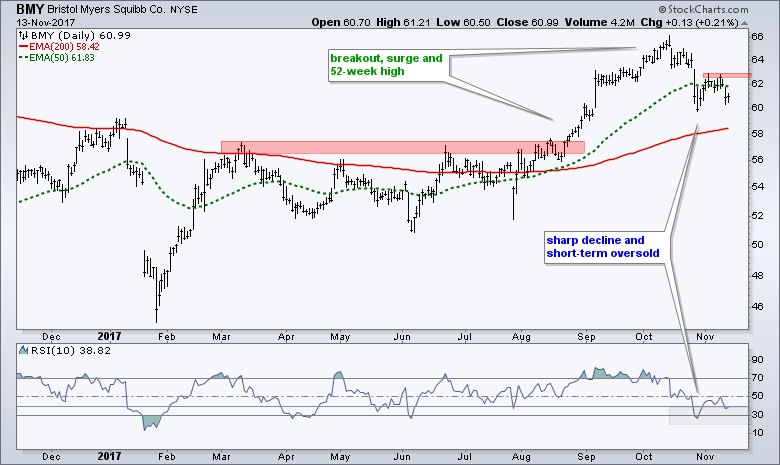
First Oversold Readings Since Breakouts (BMY, BIIB)
I read an article in Barron's suggesting that Bristol-Myers (BMY) and Biogen (BIIB) were possible takeover targets for Pfizer (PFE). I also have a hot tip to pass along: don't take any tips! Look at the charts for information. BMY and BIIB were on my radar anyway because both pulled back within uptrends. BMY is a big pharmaceutical that accounts for 3.22% of Health Care SPDR and BIIB is a large biotech that accounts for 8.67% of the Biotech iShares. The first chart shows BMY with the first oversold reading since the 50-day EMA crossed the 200-day EMA. The stock bounced back above 62 after becoming oversold, but fell back with a gap on Friday. A move back above 63 would fill this gap and put the uptrend back in play.
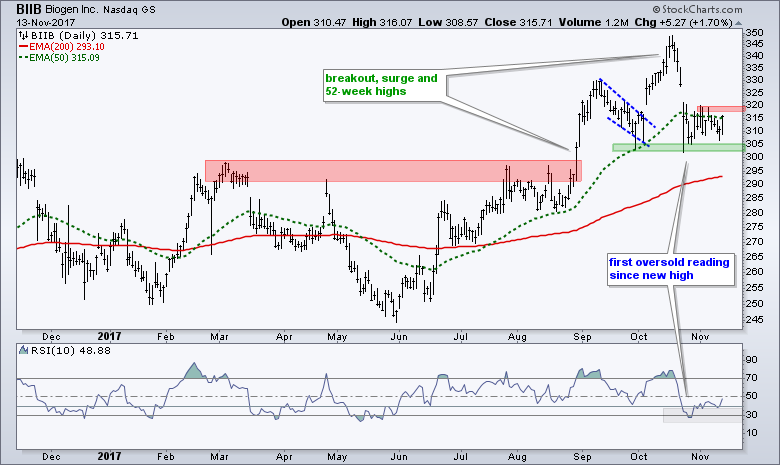
The next chart shows Biogen breaking out in late August and hitting new highs with a surge to the 350 area. The stock fell back with a gap down in late October, but firmed near the September lows and RSI became oversold. Note that this is the first oversold reading since the new high. BIIB surged on Monday and a follow through break at 320 would suggest that this pullback has reversed.
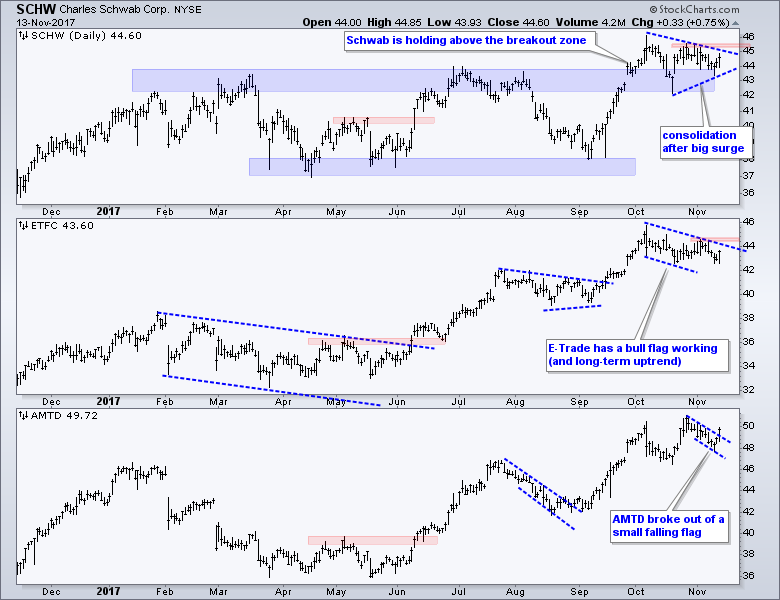
Discount Brokers Consolidate within Uptrends
The next chart shows the three discount brokers, Schwab (SCHW), E-Trade (ETFC) and TD Ameritrade (AMTD). Note that all three broke resistance zones (red) with surges in June and recorded 52-week highs in July, and in early October. AMTD new a new high again in late October and is leading the three. SCHW formed a triangle after its surge and ETFC pulled back with a falling flag of sorts. Consolidations after a sharp advance are bullish continuation patterns and this means I would expect the uptrends to continue at some point.
Banks, Utilities, Gold and the 10-yr T-Yield
Chartists can watch the 10-yr T-Yield ($TNX) for clues on brokers, banks, utilities and gold. The next chart shows the 10-yr T-Yield breaking out with a big move from early September to late October. $TNX fell back to the 23 area (2.3%) twice and then surged off this level last Thursday. It looks like the breakout is holding and I would expect yields to rise (bonds to fall). A close below the October low would call for a re-assessment. John Murphy has been right on the 10-yr T-Yield over the last few weeks. John noted the breakout in the 10-yr T-Yield back on October 25th and the upturn in global yields.
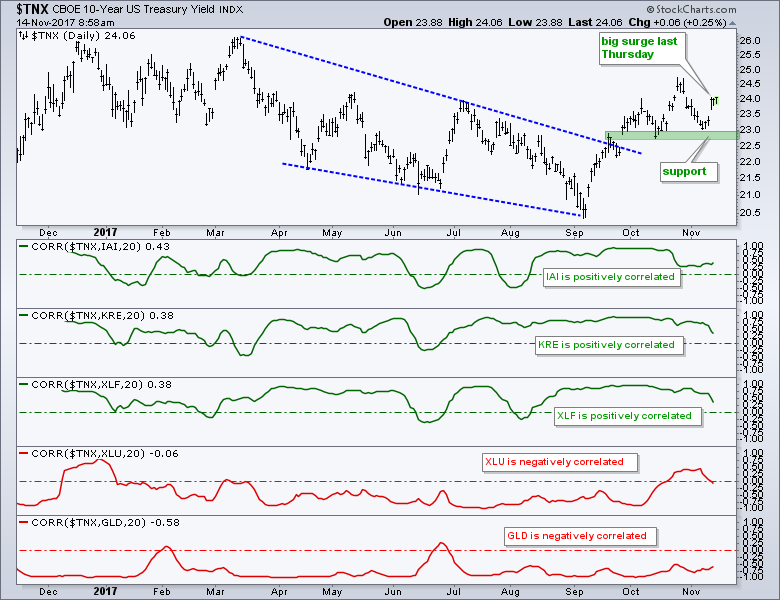
The indicator windows show the Correlation Coefficients for the 10-yr T-Yield and five ETFs (Broker-Dealer iShares (IAI), Regional Bank SPDR (KRE), Financials SPDR (XLF), Utilities SPDR (XLU) and Gold SPDR (GLD)). The first three are mostly positively correlated and this means a rise in the 10-yr would be bullish for IAI, KRE and XLF. The last two are negatively correlated and this means a rise in the 10-yr yield would be bearish for XLU and GLD.
ETF Master ChartPack - 300+ ETFs organized in a Master ChartList and in individual groups.
Follow me on Twitter @arthurhill - Keep up with my 140 character commentaries.
****************************************
Thanks for tuning in and have a good day!
--Arthur Hill CMT
Plan your Trade and Trade your Plan
*****************************************


