 |
.... Those Pesky Timeframes .... SPY Notches another New High .... Broad Advance Lifts QQQ to New Highs .... IJR Fluctuates within Bullish Consolidation .... Finance and Technology Lead .... Consumer Discretionary Struggles Internally .... Utilities and Materials are Close to 52-week Highs .... Industrials and Healthcare Pull Back within Uptrends .... XLE Breaks Flag Resistance as Oil Hits New High .... XES Bounces off Key Retracement .... Oversold Conditions for IBB and XBI .... KRE and IAI Hold Flag Breakouts .... TLT Surges off 200-day SMA .... Gold Hits Key Retracement .... Dollar Holds above Breakout Zone .... Art's Charts ChartList Notes .... |
----- Art's Charts ChartList (updated November 3rd) -----
Those Pesky Timeframes
Small-caps are lagging on the one-month and six-month timeframes, but leading on the three-month and twelve month timeframes. What are we to believe? There are many differing opinions on the state of the stock market and I suspect that many of these are timeframe related. One could be bearish on small-caps because the Russell 2000 iShares (IWM) peaked on October 5th (closing basis) and has been trending lower the last four weeks. One could be bullish on small-caps because IWM hit a 52-week high in early October.
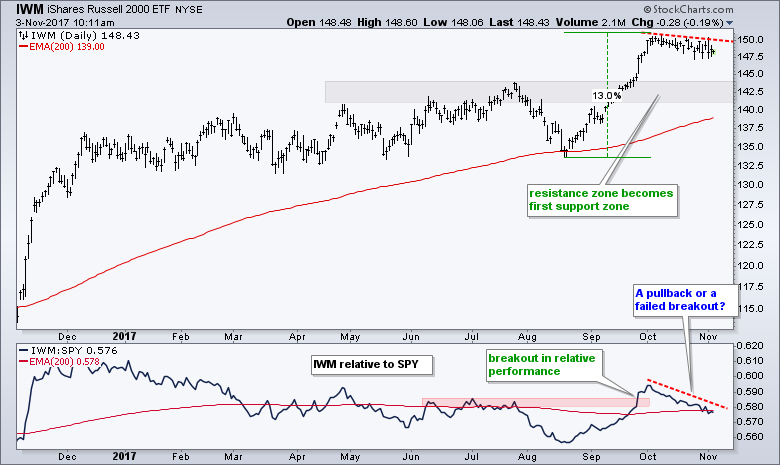 The chart above shows IWM with a 13% surge and a 2% pullback. It is not much of a pullback thus far, but could extend to the 142.5 area, which marks a broken resistance zone. The indicator window shows the price relative (IWM:SPY ratio) breaking out in late September as small-caps made a bid to start outperforming. IWM underperformed SPY in October and relative strength in small-caps has been put on hold. Look for an upturn in the price relative to signal a return to small-cap leadership.
As far as I am concerned, the weakness in small-caps is a short-term issue and not enough to derail the bull market. Small-caps account for less than 10% of the total stock market, which makes them the tail, not the dog. I would use the short-term pullback on the price chart and the price relative to determine when and if to return to small-caps. Upside breakouts in both would provide such a signal.
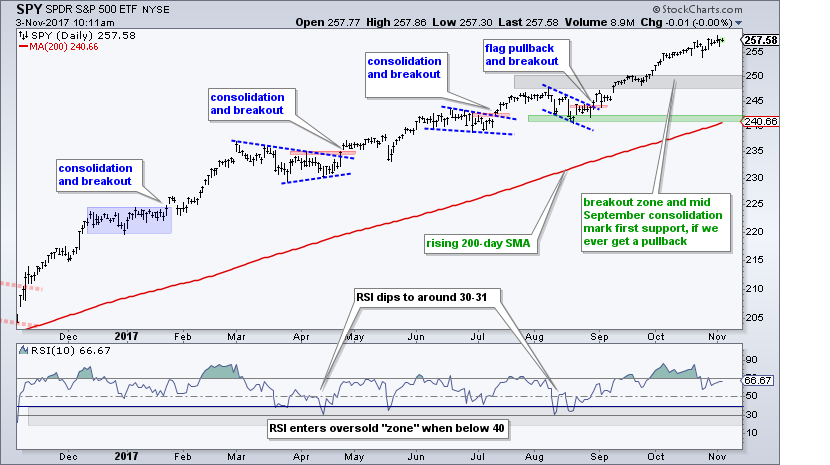
SPY Notches another New High
The S&P 500 SPDR (SPY) hit a 52-week high intraday on Wednesday and remains in a clear uptrend. As usual, we can speculate on the need for a correction and overbought conditions after a 7% advance in ten weeks, but this would just detract from the main point. The big trend is up and nobody knows when a pullback will occur. A pullback or consolidation will occur at some point, just as in December-January, March-April, July and August. Once we get a correction, I will watch RSI for a dip into the oversold zone and the 250 area for support.
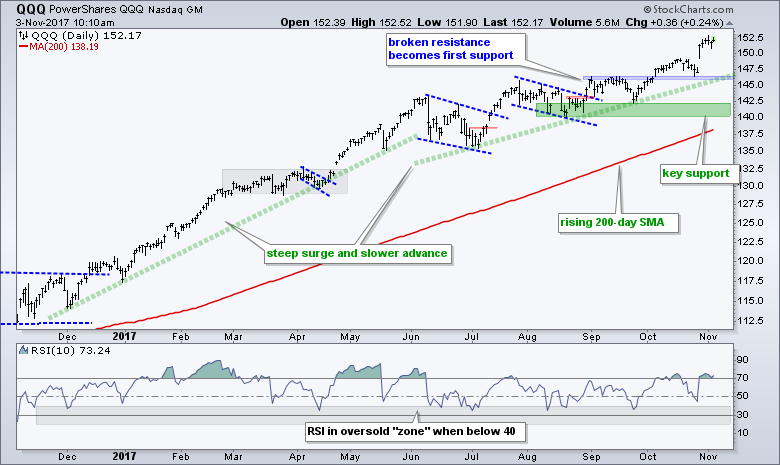
Broad Advance Lifts QQQ to New Highs
QQQ also hit a new high this week and is up around 8% over the last ten weeks. The advance slowed from June to Now, but an advance is still an advance and buying pressure is still evident. For those who think this advance is just because of five big stocks, note that 70 of the 100 stocks in the Nasdaq 100 are up over the last ten weeks and 52 are up more than 5%. Facebook, Amazon, Apple, Alphabet and Microsoft may account for 45% of the ETF, but they are clearly not the only tech stocks with big gains.
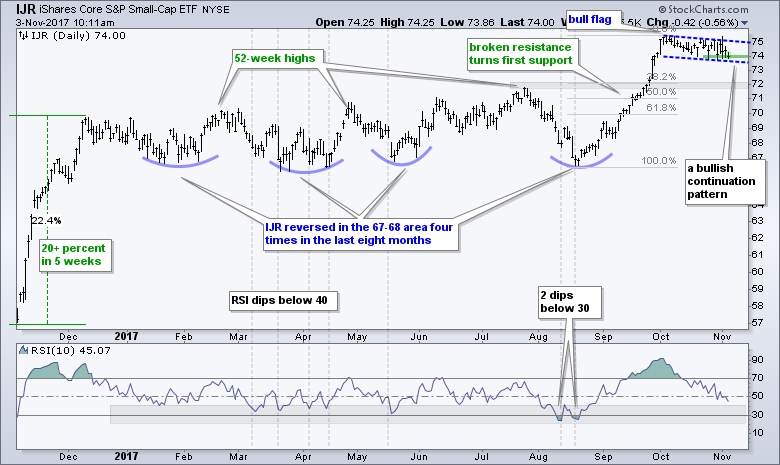
IJR Fluctuates within Bullish Consolidation
Small-caps and the S&P SmallCap iShares (IJR) are the clear laggards over the last four weeks. IJR led the market from 22-August to 3-October with a 13% advance and then consolidated with a falling flag. It is not a perfect flag, but it is clearly a consolidation after a sharp advance and this makes it a bullish continuation pattern. Trading is quite choppy within the pattern. IJR surged last Thursday-Friday, gave it all up on Monday, rebounded on Tuesday and fell back on Wednesday. A close above 75 would break the flag line and argue for a continuation of the bigger uptrend.
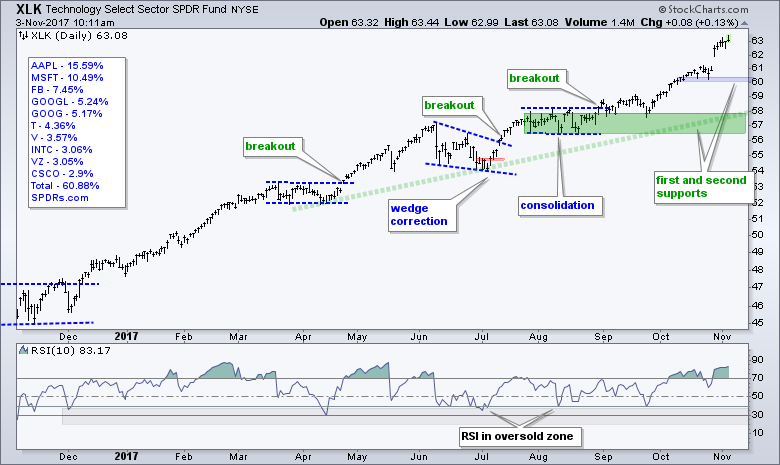
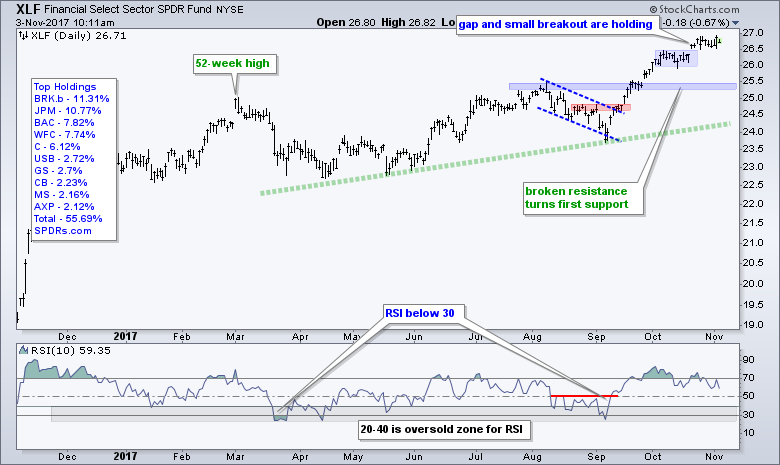
Finance and Technology Lead
The Financials SPDR (XLF) and the Technology SPDR (XLK) are leading the market this week with fresh 52-week highs. XLF broke out of a small consolidation with a gap-surge above 26.5 and this breakout is holding. XLF also led the nine sectors with a 1% gain on Thursday.
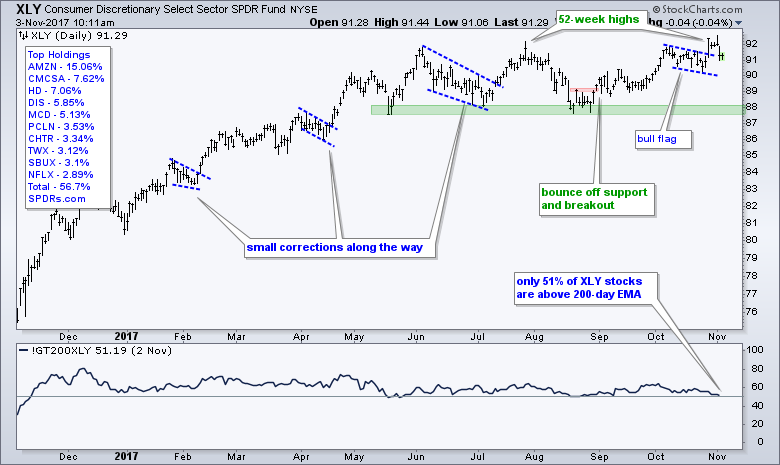
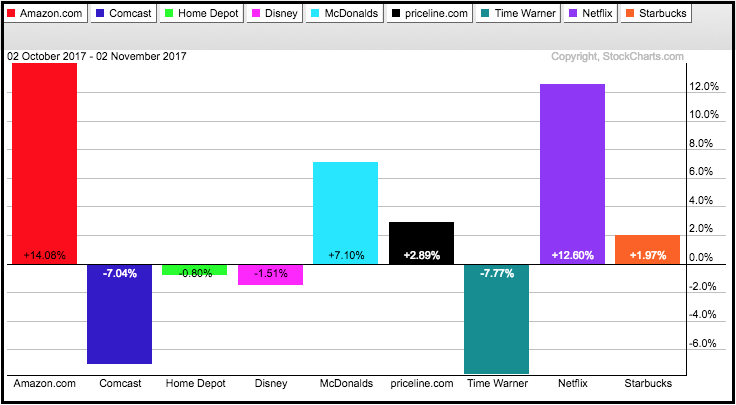
Consumer Discretionary Struggles Internally
The Consumer Discretionary SPDR (XLY) hit a new high on Wednesday, but fell back rather hard on Thursday. This, however, does not affect the overall uptrend because XLY forged new highs in June, August and now November. XLY is outperforming the EW Consumer Discretionary ETF (RCD) because heavy weights like Amazon (+14%), McDonalds (+7%) and Netflix (+12%) are up strong over the past month. The indicator window shows that only 51% of the stocks in the consumer discretionary sector are above their 200-day EMAs. Thus, half are in long-term uptrends and half in long-term downtrends.
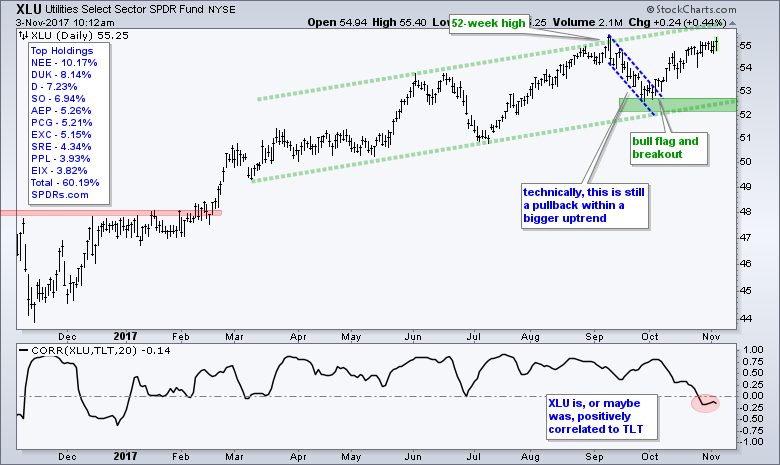
Utilities and Materials are Close to 52-week Highs
The Utilities SPDR (XLU) is in an uptrend overall and near a 52-week high. Note that TLT got a strong bounce the last five days and utility stocks act as bond proxies. The correlation between XLU and TLT did turn negative recently, but this might just be a short-term fluke.
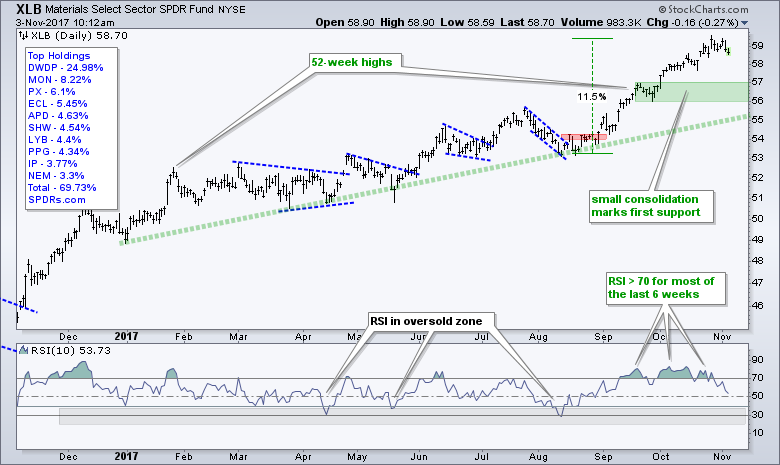
 The Materials SPDR (XLB) did not hit a fresh high this week, but remains very close to its 52-week high.
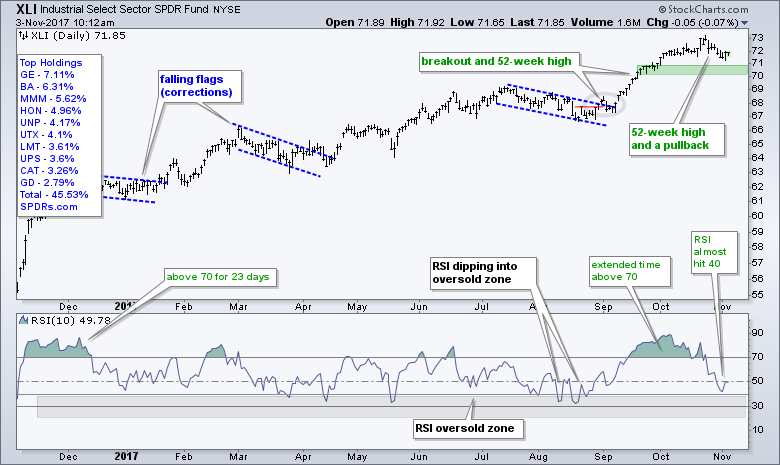
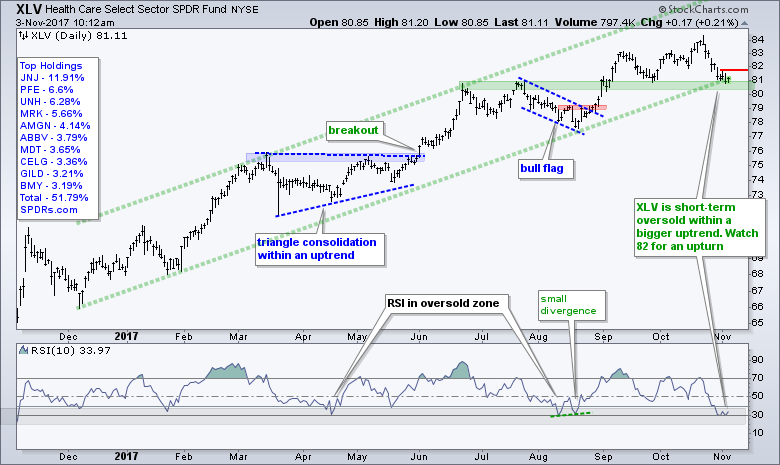
Industrials and Healthcare Pull Back within Uptrends
The Industrials SPDR (XLI), Health Care SPDR (XLV) and Consumer Staples SPDR (XLP) are the only three sector SPDRs with losses over the last two weeks. XLP is not a surprise because it is the weakest sector of the nine and in a downtrend since summer. XLI and XLV, on the other hand, hit 52-week highs in October and these declines are deemed pullbacks within the uptrend. A pullback within an uptrend is not a threat, but rather a potential opportunity. Admittedly, the pullback is XLI is rather shallow and RSI has yet to dip into the oversold zone (20-40). We never really know how far or how long a pullback will extend, but I will be watching these two closely for signs that the pullbacks are ending.
XLE Breaks Flag Resistance as Oil Hits New High
The Energy SPDR (XLE) fell back in the second half of October and broke out of a flag with a surge on Monday. Notice that the breakout zone around 66 held as RSI dipped into the oversold zone (20-40). It looks like XLE is ready to continue its uptrend and chartists can watch 67 for the first signs of a failure. A close below this level would negate the breakout.
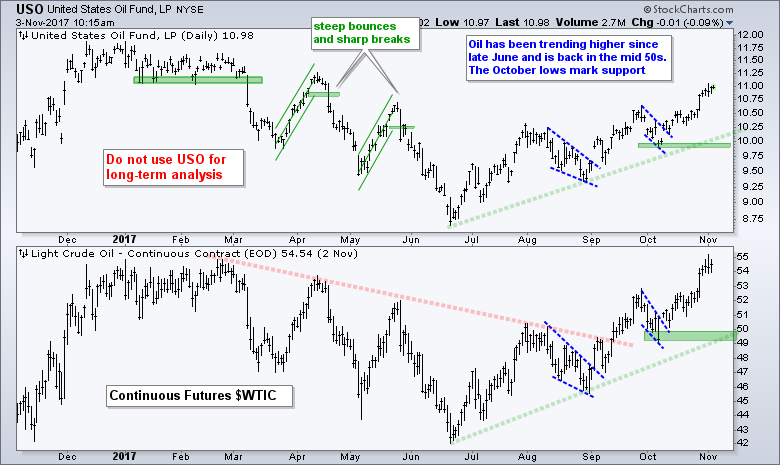
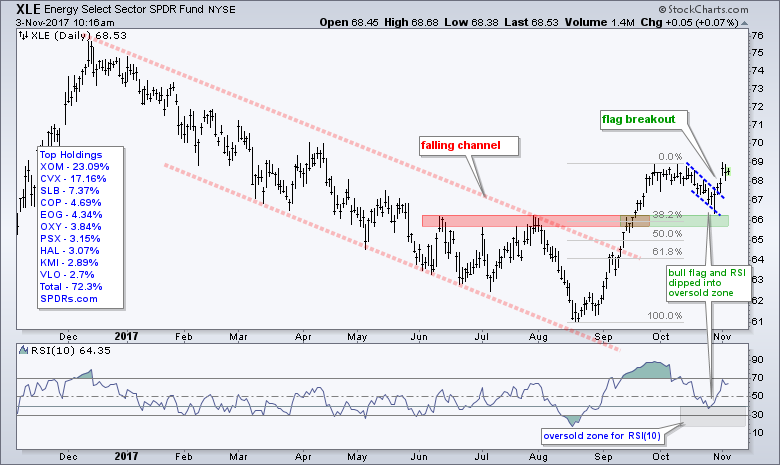 The chart below shows the Light Crude Continuous Contract ($WTIC) hitting its highest level in over a year with an intraday high above 55 this week. I switched to $WTIC because this best captures the spot crude price and spot crude hit a new high this week as well. December Crude (^CLZ17) is good for short-term analysis, but it remains well below its 2017 high and does not reflect strength in the spot market. The uptrend in Crude is positive for energy-related stocks and I am marking support in the 49-50 area.
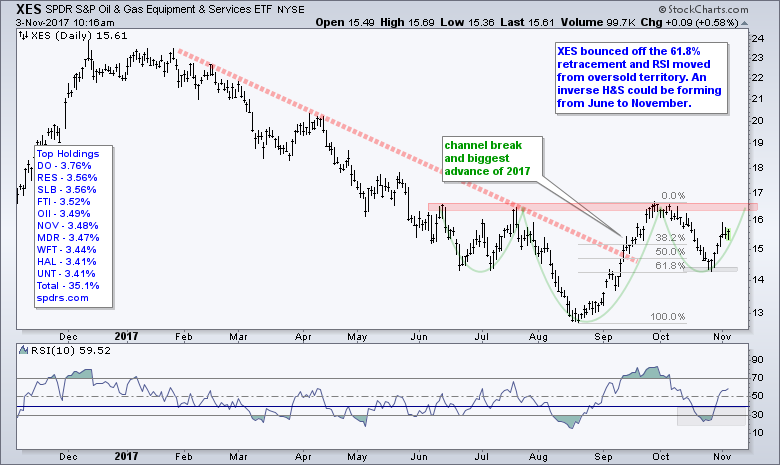
XES Bounces off Key Retracement
The Oil & Gas Equip & Services SPDR (XES) got a nice bounce this week and I will now entertain the possibility of an inverse head-and-shoulders pattern. This pattern, however, is far from complete because XES is not even testing neckline resistance in the 16.50 area. A break above the June-October highs is needed to complete the pattern. For now, I noted the 61.8% retracement and oversold RSI last week. XES bounced off this retracement and RSI moved out of its oversold zone. This is the first sign of an upturn and a continuation of the August-September advance.
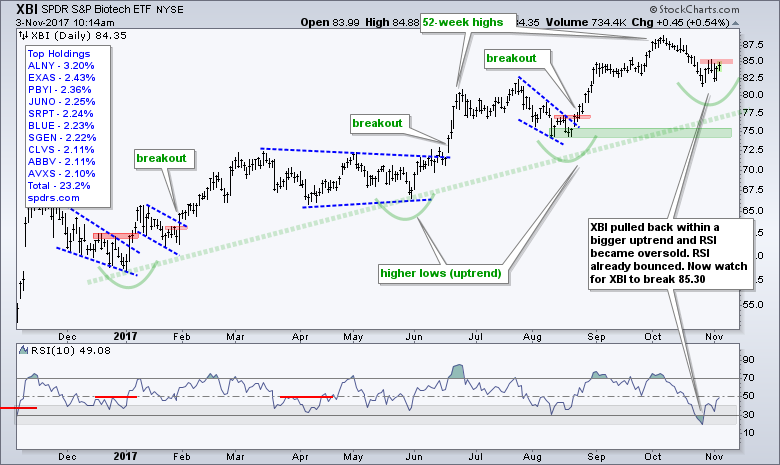
Oversold Conditions for IBB and XBI
A pullback within an uptrend provides an opportunity to partake in the uptrend at a discount (lower price). There is no guarantee that the pullback will reverse and that the uptrend will continue. The theory is based on the assumption that the uptrend will continue, not reverse. This assumption will one day be proven wrong, but the odds favor trend continuation over trend reversal. The charts below show the Biotech iShares (IBB) and the Biotech SPDR (XBI) with pullbacks over the last few weeks. Even though the pullback in IBB looks deeper, note that both fell around 8% from their highs. RSI moved below 30 for both, but RSI has already moved out of oversold territory for XBI, which suggest that it is the stronger of the two. The red zones mark first resistance and breakouts here are needed to fully reverse the short-term downtrends.
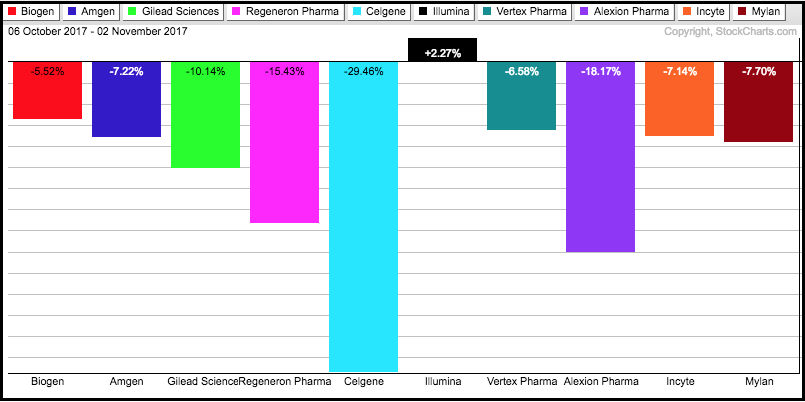
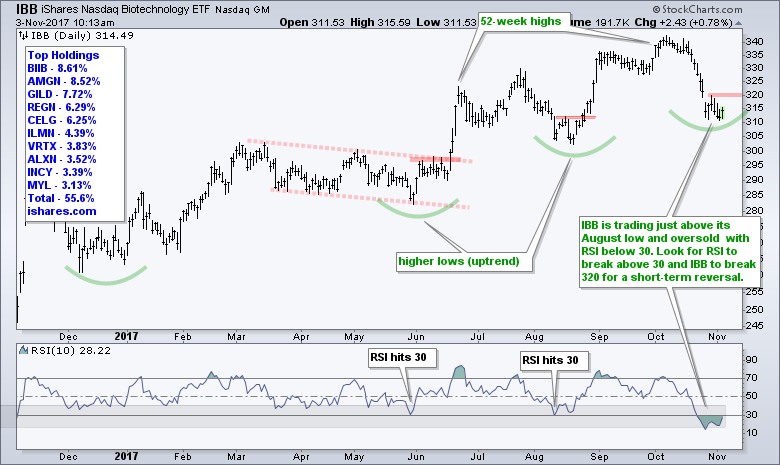 A look at the holdings shows IBB with a concentration of large-caps and XBI with a more evenly weighted component list. The top ten components in IBB account for 55% of the ETF, while the top ten stocks in XBI account for just 22%. The PerfChart below shows GILD, REGN, CELG and ALXN weighing heavily on IBB with double digit declines this month. ILMN is the only one holding up.
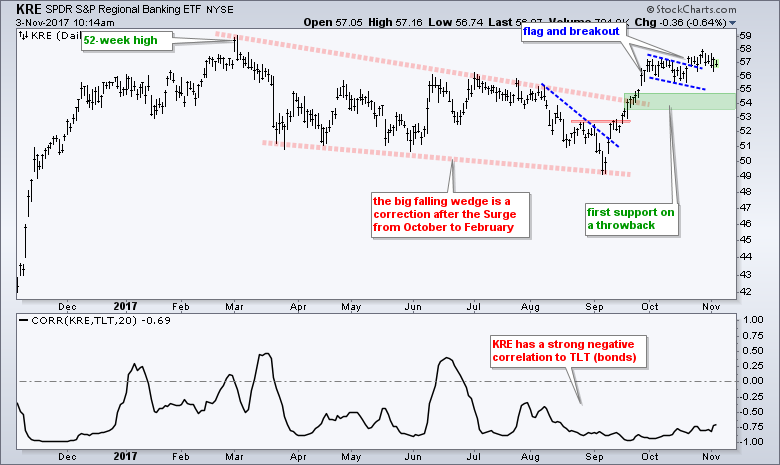
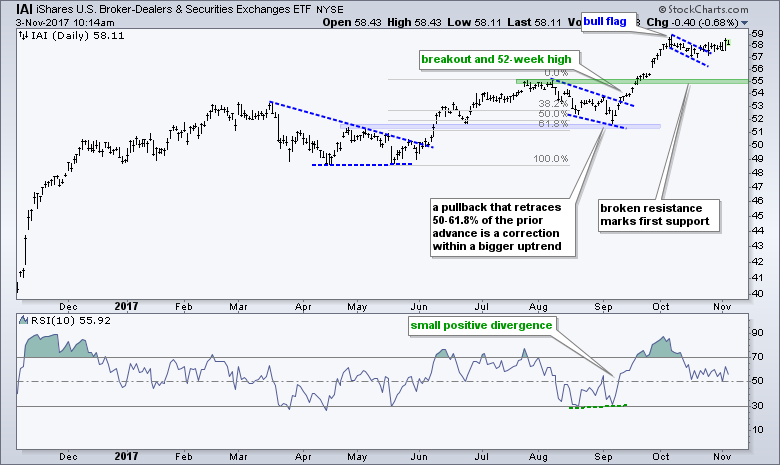
KRE and IAI Hold Flag Breakouts
The 20+ YR T-Bond ETF (TLT) surged 2.5% this week and the 10-yr T-Yield ($TNX) fell back below 2.4%. This is not enough to reverse the advance that began in early September, but I was impressed with the Regional Bank SPDR (KRE) and the Broker-Dealer iShares (IAI). Despite a pretty big decline in the 10-yr yield, IAI is up around 1% the last five days and KRE is down just .50%. On the price charts, IAI and KRE broke out of consolidations two weeks ago and these breakouts are holding. I would still keep an eye on TLT because an upside breakout at 126 could weigh on KRE and IAI.
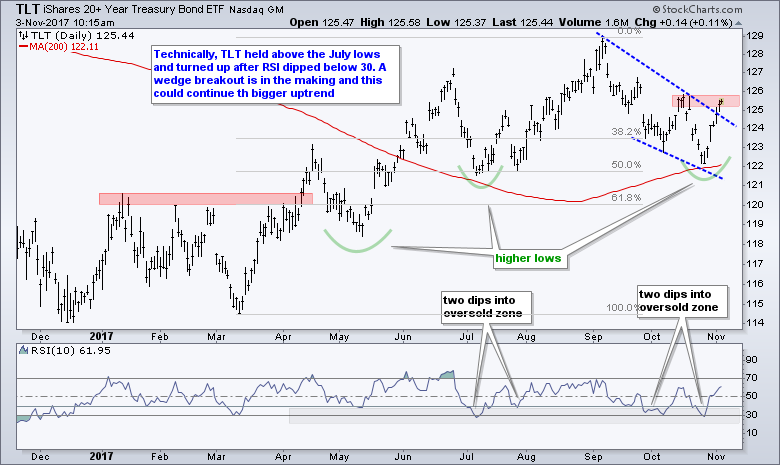
TLT Surges off 200-day SMA
I cleared my TLT chart and started annotating with a clean slate. Technically, the long-term trend is up with a breakout in April, a higher high in June and a 2017 high in early September. The decline into late October formed a falling wedge and TLT broke above the upper trend line with a five day surge. Also notice that TLT held above the July low in October (slightly higher low). The five day surge puts TLT at a moment-of-truth (resistance from the mid October high). A follow through breakout at 126 would be bullish for Treasury bonds and bearish for yields.
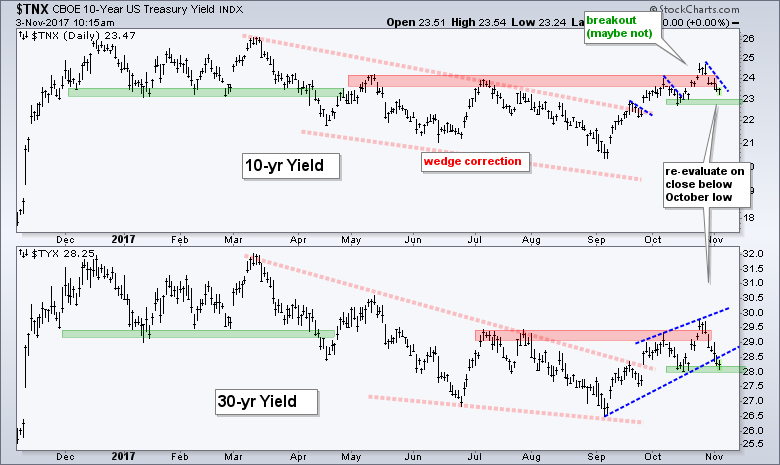
 The next chart shows the 10-yr T-Yield ($TNX) breaking above 24 (2.4%) and then falling back the last five days. This could be just a small pullback within a bigger uptrend that began in September. Look for a move back above 24 to put the breakout back in play. The green zones mark support from the February lows and breaks here would be quite bearish for yields.
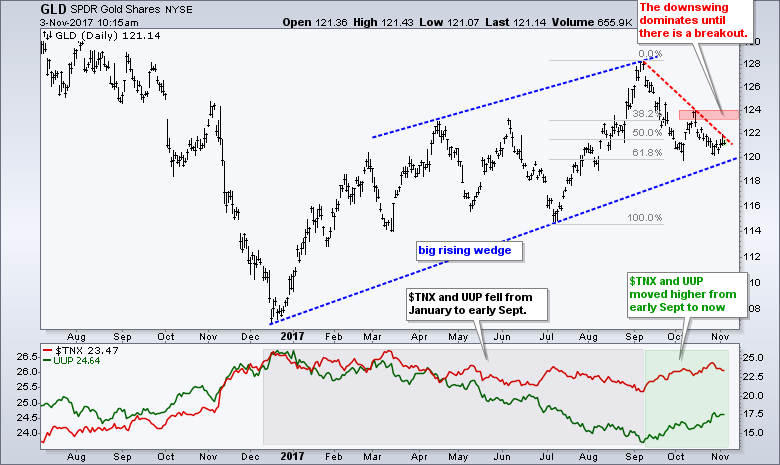
Gold Hits Key Retracement
Treasuries surged this week and the Gold SPDR (GLD) did not. These two are positively correlated and the inability of gold to bounce is negative for bullion. Blame the Dollar, which has been trending higher since early September. On the price chart, one could argue for an uptrend since December with the big rising wedge. GLD is also trying to firm at the 61.8% retracement and above the wedge trend line. Even so, I need to see a surge to affirm support or a breakout to reverse the downswing.
Dollar Holds above Breakout Zone
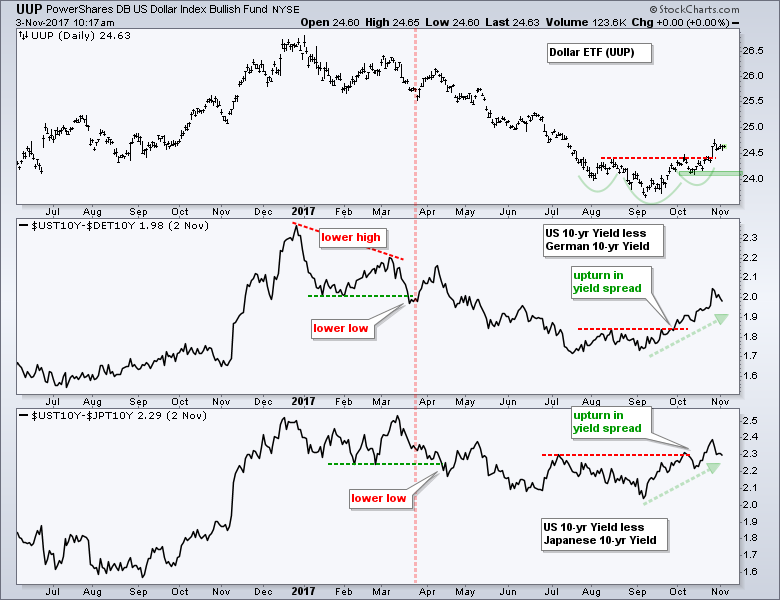
There is no change in the US Dollar ETF (UUP), which broke the red resistance line last week and remains in an uptrend since early September. The October lows mark key support. The US-German yield spread fell back below 2 this week, but the uptrend remains and this means US yields are distancing themselves from German yields, which is positive for the Dollar.
Art's Charts ChartList Notes
- The notes below pertain to some of the annotated charts in my ChartList (click here).
- The Home Construction iShares (ITB) was hit hard on Thursday as the GOP released its tax plan. The big trend is still up and the tax plan release is like the opening pitch in a baseball game. A lot can still change. The big trend is up and I marked the first support zone using the Fibonacci Retracements Tool.
- The Retail SPDR (XRT) pulled back with a falling wedge after the big surge and this could be a correction. Watch 41 for a breakout.
- Tech continues to rock as SKYY, FDN, SOXX, XSD and IGV hit 52-week highs this week.
- The Cyber Security ETF (HACK) continues to struggle, but remains in an uptrend with support marked at 29.50.
- The Networking iShares (IGN) is the weakest of the tech-related ETFs after a support break on Friday.
- The Broker-Dealer iShares (IAI) broke flag resistance in mid October and surged on Thursday.
- Mortgage REIT ETF (REM) failed to bounce off support, but remains oversold within an uptrend. Look for a move back above 40 in RSI to signal a bounce.
- The Regional Bank SPDR (KRE) is holding its flag breakout.
- The REIT iShares (IYR) became short-term oversold last week and bounced off support from the December trend line and September low.
- The iShares Aerospace & Defense ETF (ITA) formed a flat consolidation after a sharp advance and surged off the consolidation lows.
- The Airline ETF (JETS) formed a lower high in mid October and broke channel support with a sharp decline the last two weeks.
- The Oil & Gas Equip & Services SPDR (XES) bounced off the 61.8% retracement and RSI moved from oversold territory. An inverse H&S could be forming from June to November.
- The Copper Miners ETF (COPX) corrected within a long-term uptrend and RSI dipped into the oversold zone. A breakout could be in the making with this week's bounce.
- ******************************************************
ETF Master ChartPack - 300+ ETFs organized in a Master ChartList and in individual groups.
Follow me on Twitter @arthurhill - Keep up with my 140 character commentaries.
****************************************
Thanks for tuning in and have a good day!
--Arthur Hill CMT
Plan your Trade and Trade your Plan
*****************************************


