 |
.... Risk-on versus Risk-off on One PerfChart |
----- Art's Charts ChartList (updated November 10th) -----
Risk-on versus Risk-off on One PerfChart
The market took a risk-off turn this week as the defensive sectors bounced and the risky areas of the market fell. The PerfChart below shows this week's performance for five risk-off (defensive) symbols and five risk-on (offensive) symbols. The Consumer Staples SPDR (XLP), Utilities SPDR (XLU), REIT iShares (IYR), Health Care SPDR (XLV) and 20+ YR T-Bond ETF (TLT) represent the risk-off players, while the High-Yield Junk Bond SPDR (JNK), Momentum Factor ETF (MTUM), S&P 500 High Beta ETF (SPHB), S&P 500 SPDR (SPY) and S&P SmallCap iShares (IJR) represent the risk-on players. Notice that all five risk-off ETFs are up with IYR leading the way. Conversely, all five risk-on ETFs are down with the High Yield Bond SPDR (JNK) leading the way.
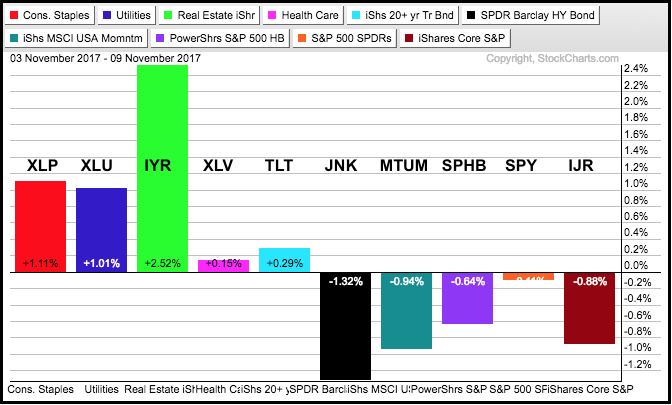
The Utilities SPDR and REIT iShares are bond proxies that moved higher along with the 20+ YR T-Bond ETF, which is the ultimate safe-haven. Both XLU and IYR hit new highs this week. The High-Yield Junk Bond ETF is more tied to the stock market and represents the riskiest bonds in the market place. As their name implies, junk bonds have the highest risk of default should the economy soften. The combination of weakness in Junk Bonds and strength in Treasury bonds could be negative for the stock market.
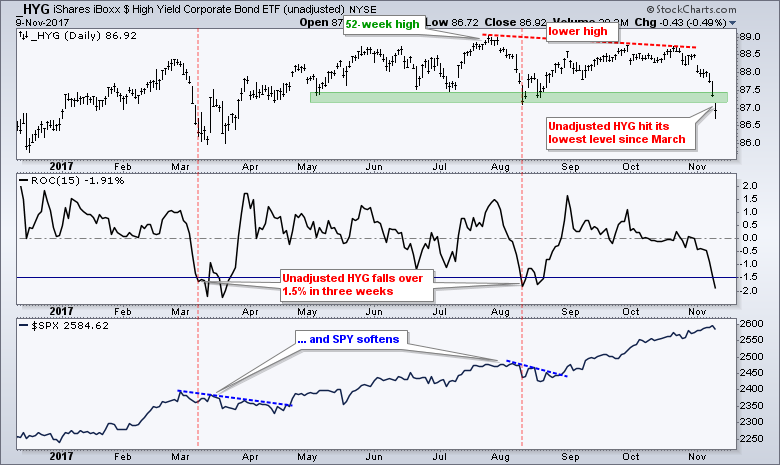
Junk Bond ETFs Falls the Most Since August
I try my best to ignore bearish signals when the bigger trend is up, but I am seeing some warning signs outside the stock market that may lead to a correction in stocks. As noted on October 31st and November 9th, the High-Yield Bond ETF (HYG) should be watched closely. The chart below shows the unadjusted HYG (_HYG) moving to its lowest level since April with a 1.91% decline the last 15 days. Add an underscore (_HYG) before the symbol to see prices that are NOT adjusted for dividends and distributions. I am showing the unadjusted version because this shows the capital gain or loss associated with a position (sans dividends). Unadjusted HYG formed a lower high from July to September and broke the August low this week. This is the third such decline this year and the S&P 500 softened for four to six weeks after the first two.
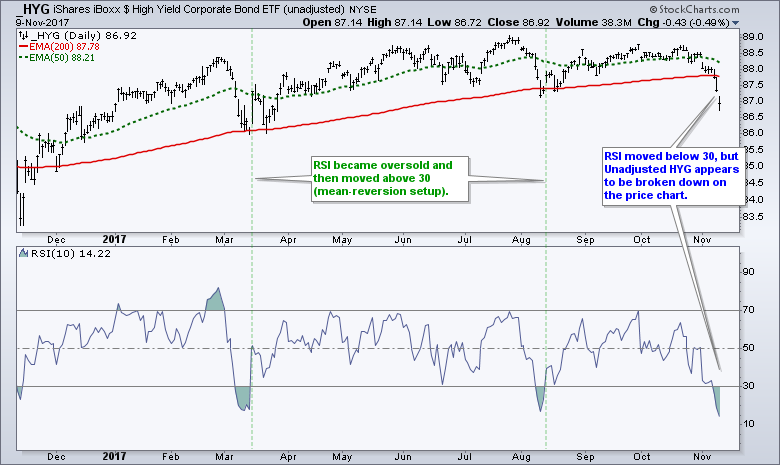
The Oxymoronic Nature of Technical Analysis
Technical analysis is open to interpretation and this can produce contradictory assessments. One trader's break down and sell signal can be another trader's mean-reversion setup for a bullish trade. The unadjusted High Yield Bond SPDR (_JNK) sports a lower high and a break down, but the 50-day EMA is still above the 200-day EMA and RSI is short-term oversold. Do we respect the former (breakdown) or the latter (oversold)? This is where we need to make a judgment (educated guess). While oversold conditions within an uptrend represent opportunities to buy the dip, there comes a moment when the trend changes and oversold are no longer viewed as opportunities. The trend appears to be changing for _HYG because of the lower high and the break down in November. Even though an oversold bounce can still occur in a downtrend, I prefer to look for stronger uptrends and would not be interested in this oversold condition. The same holds true for XME and KRE. Their trends are not strong enough to consider oversold conditions.
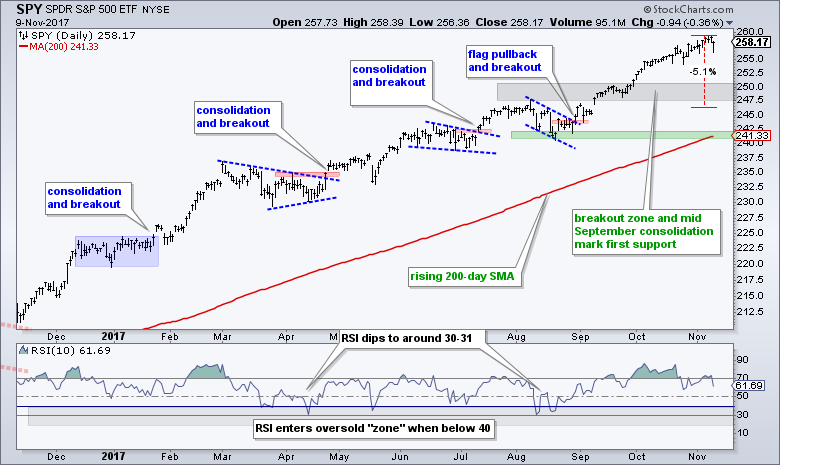
SPY Hovers Near its Highs
The S&P 500 SPDR (SPY) is still very close to its 52-week high and in a strong uptrend. SPY is up around 7% since mid August and RSI has been flirting with the 70 level since mid September. Everybody "knows" that SPY is overbought and ripe for a correction, but nobody knows when a correction will actually materialize. A garden-variety three to five percent pullback would extend to the 246-252 area and probably feel like the end of the world. With the long-term trend up, I will treat a pullback as a correction within this uptrend and consider it an opportunity. I am using the August highs and mid September consolidation to mark first support in the 248-250 area. In addition, I will watch RSI for a dip into the oversold zone. Thus, a move to the 250 area and an RSI move below 40 would provide the next setup for a trade. SPY may hold the key to other mean-reversion setups out there because most stocks and ETFs are likely to suffer should SPY correct. Thus, it may be better to wait for SPY to become oversold before looking at other mean-reversion opportunities.
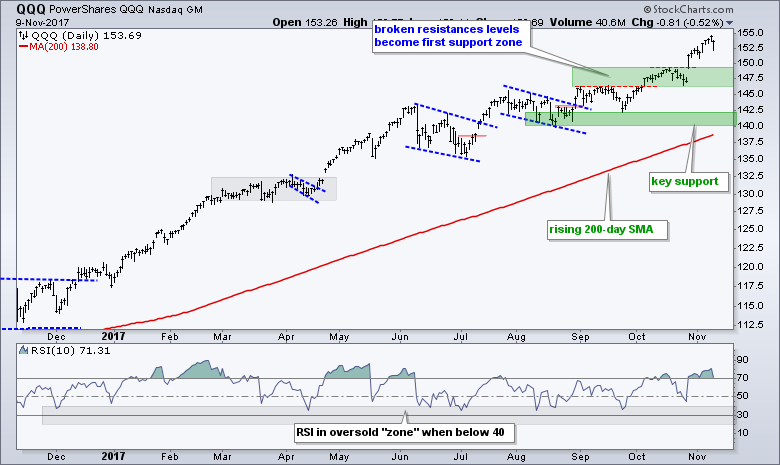
The next chart shows QQQ with the first support zone in the 146-149 area.
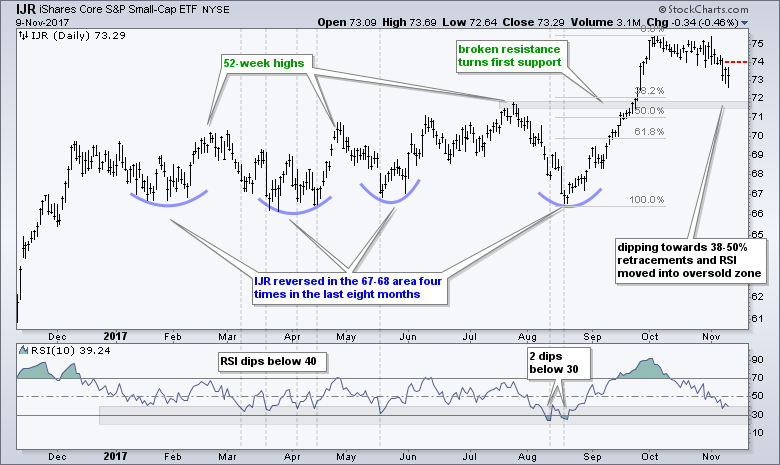
RSI Moves into Oversold Zone for IJR
After a 13% advance from mid August to early October, the S&P SmallCap iShares (IJR) is in the midst of a pullback that is retracing a portion of this advance. Broken resistance and the 38-50% retracement zone mark the first support zone to watch in the 71-72 area. The indicator window shows RSI moving into the oversold zone (20 to 40). A mean-reversion setup is in play and traders should be on alert for signs of an upturn. A break above 74 would provide the first sign. This is the "normal" call here. The "subjective" call tells me to wait a bit because of the breakdown in the Junk Bond ETF. IJR is unlikely to bounce if SPY starts to correct or remains soft.
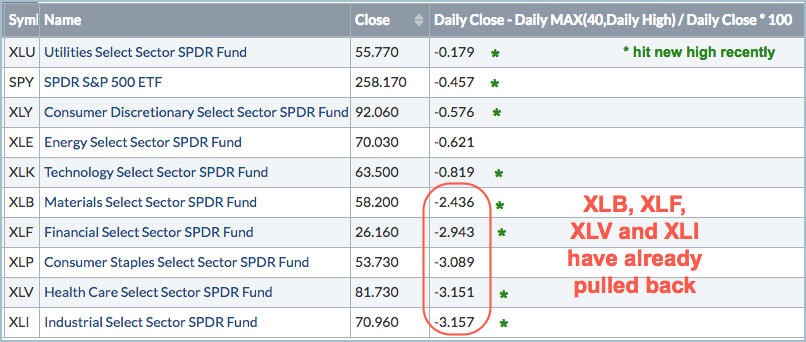
Finance, Industrials and Healthcare Lead Pullback
The image below shows how far the nine sectors are from their 40-day highs. I used 40 days in this scan because this captures the highs in October and November. The green asterisk marks the six sectors that recorded 52-week highs in October and/or November (and SPY). The table is sorted by the percentage below this high. XLU hit a new high on Friday and remains the closest. XLY, XLE and XLK are also close to their recent highs and holding up well the last few weeks. XLB, XLF, XLV and XLI hit new highs recently and pulled back over the last few weeks. These are the four sectors leading the pullback. Even though SPY has yet to experience a garden-variety three to five percent pullback, we can see that some sectors correcting.
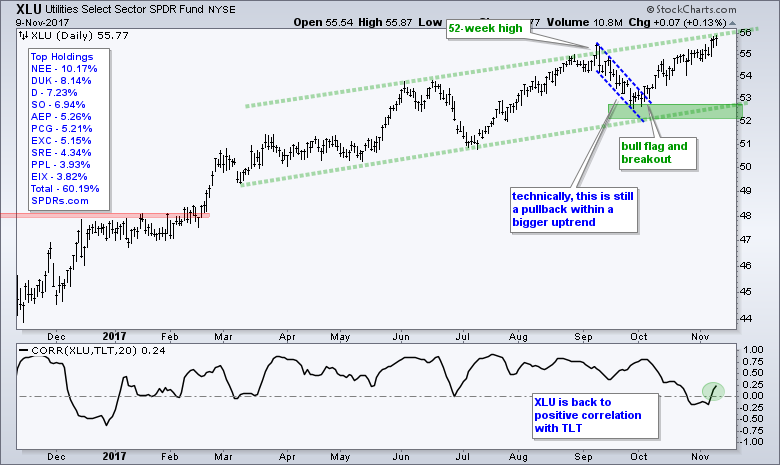
Utilities SPDR Hits 52-week High
The Utilities SPDR (XLU) gets top billing because it is the only sector to hit a 52-week high on Thursday. Strength in XLU stems from strength in the 20+ YR T-Bond ETF (TLT) because utilities are considered bond proxies. Notice that the Correlation Coefficient (TLT,XLU) moved back into positive territory this week.
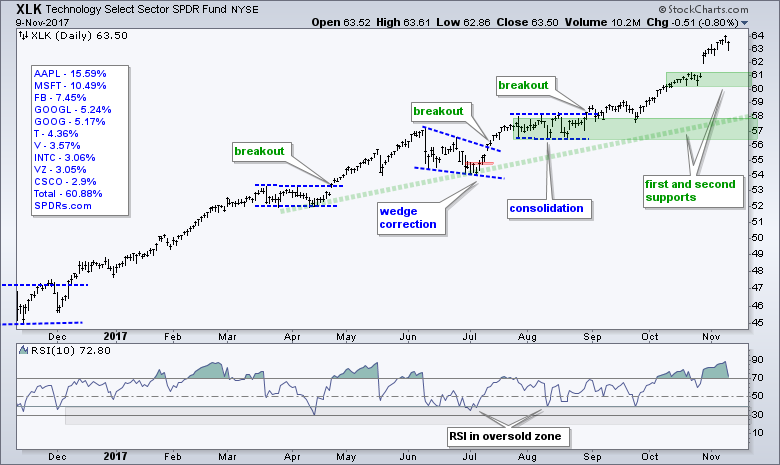
Technology Remains a Leader (plus XLY)
The Technology SPDR (XLK) remains near the top of the sector rankings with a 52-week high on Wednesday. XLK is up over 12% since mid August and looking a little stretched. Looks, however, can be deceiving because the trend is clearly up. The mid October consolidation marks my first support zone in the 60-61 area.
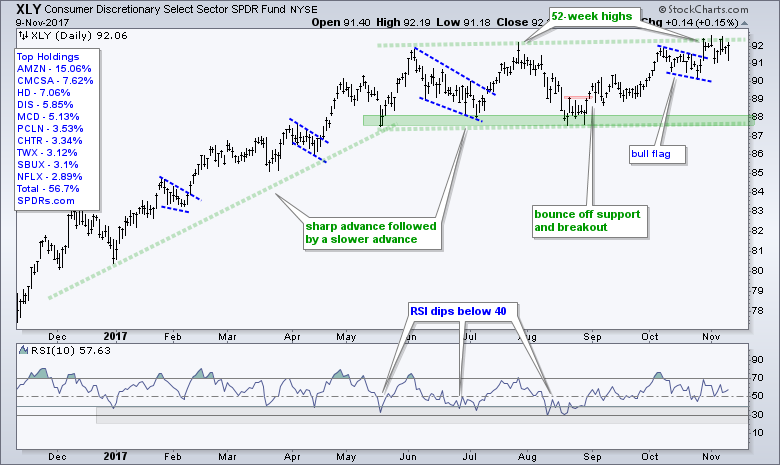
The Consumer Discretionary SPDR (XLY) comes in third place as it holds its flag breakout from two weeks ago. However, I would not be surprised to see this flag breakout fail because the advance since June has been quite choppy. Notice how XLY surged from 78 to 91 (November to May) and then worked its way higher from June to November.
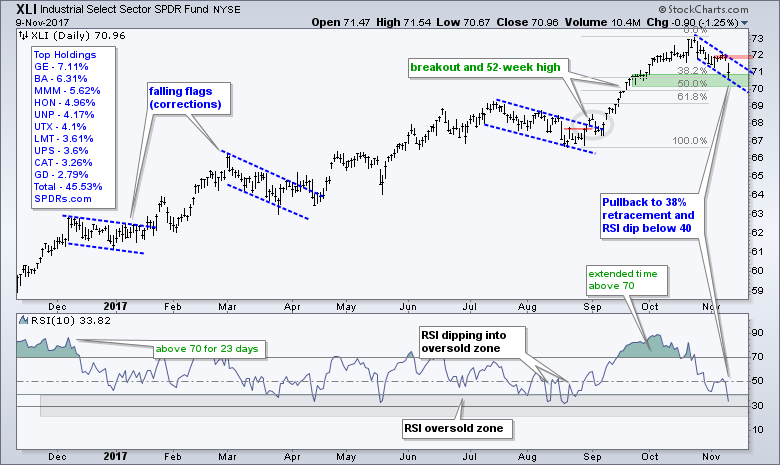
Industrials and Healthcare Correct
The Industrials SPDR (XLI) was hit hard on Thursday with a gap down and 1.25% decline. The ETF peaked in late October and is down around 3% the last 12 days. Even though XLI is entering a support zone and RSI entered an oversold zone, I am a bit wary because the broader market may be poised to correct. The majority of stocks and ETFs will follow the broader market lead and this may spoil the mean-reversion trade for a few weeks.
Finance and Banks Hit Hard
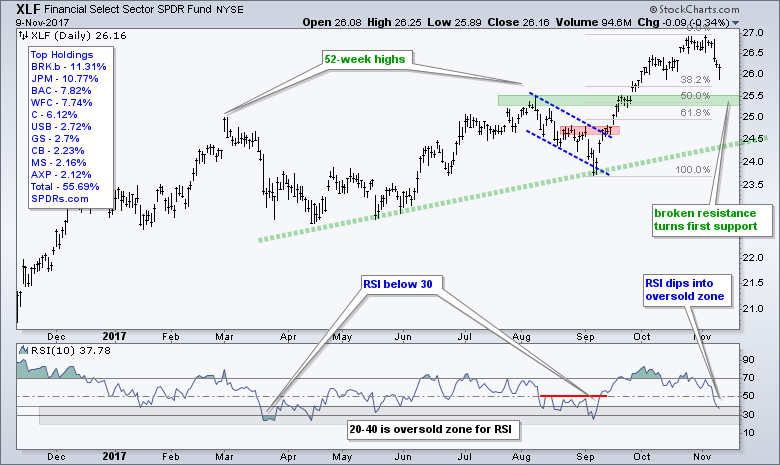
The Financials SPDR (XLF) and the Regional Bank SPDR (KRE) were hit pretty hard the last one to two weeks. XLF is around 3% below its recent high and KRE is over 5% below its October high. We can probably blame the surge in Treasury bonds and the decline in Treasury yields. The first chart shows XLF failing to hold its gap (red oval). A similar fail occurred in March and then led to a correction. Broken resistance and the 50% retracement mark the first support area to watch in the 25.3-25.5 area.
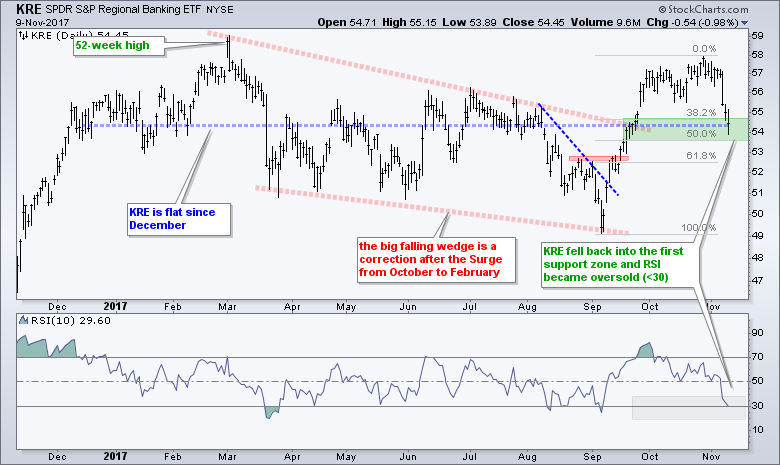
KRE fell into its first support zone already and RSI dipped below 30. This is normally a mean-reversion setup, but the overall chart for KRE is simply not that impressive. KRE has been basically flat since mid December and did not exceed its March high. The recent surge in TLT is negative for regional banks so I would stay away for now.
TLT Holds Wedge Breakout
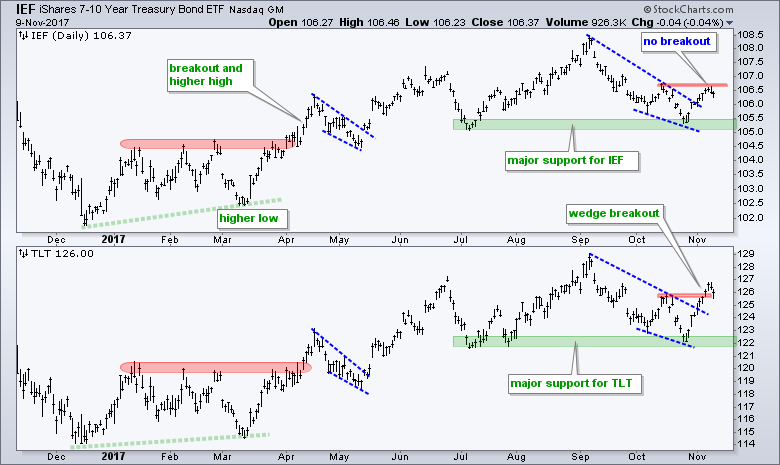
The next chart shows the 7-10 YR T-Bond ETF (IEF) and the 20+ YR T-Bond ETF (TLT) bouncing off the summer lows (green support zone). Both broke the wedge lines, but only TLT exceeded its mid October high. IEF remains just short of a complete trend reversal and needs to break the October high to complete a reversal. The green zones mark support from the July-October lows. Breaks here would be long-term bearish for bonds.
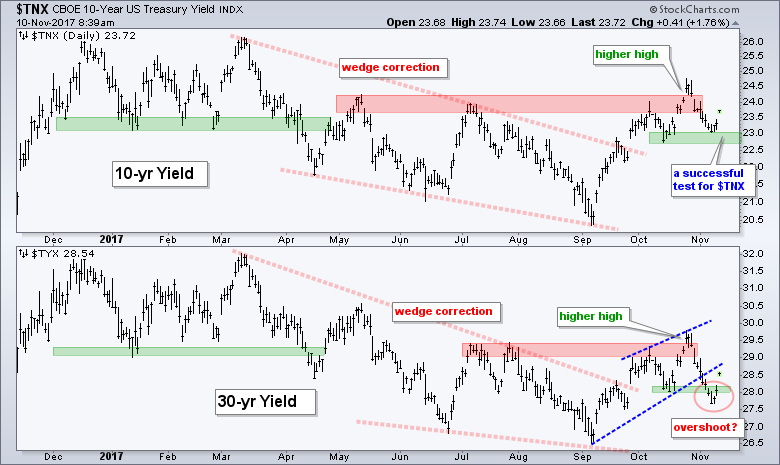
The next chart shows the 10-yr T-Yield ($TNX) in the top window and the 30-yr T-Yield ($TYX) in the bottom window. $TNX forged a higher high in October and then fell back to the green support zone. Yields are up sharply in early trading on Friday and this solidifies support. $TYX broke the October low, but quickly rebounded with a surge back to 28.5 (2.85%).
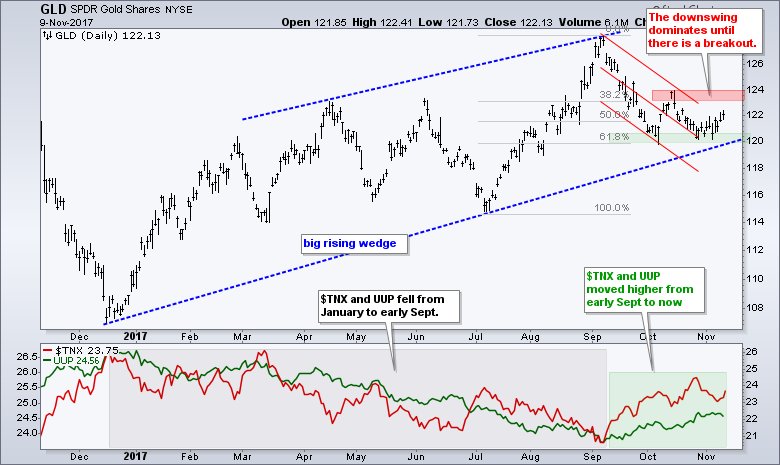
Gold Tests Key Retracement
The Gold SPDR (GLD) fell back over the last two months and then firmed in the 120 area. This area marks the 61.8% retracement of the July-September surge. GLD got a weak bounce off this level over the last four days, and more is needed for a convincing breakout. A trend line extending down from the September high looks too steep so I elected to draw a Raff Regression Channel from the September closing high to the October closing low. A break above 124 is needed to reverse the downtrend in gold.
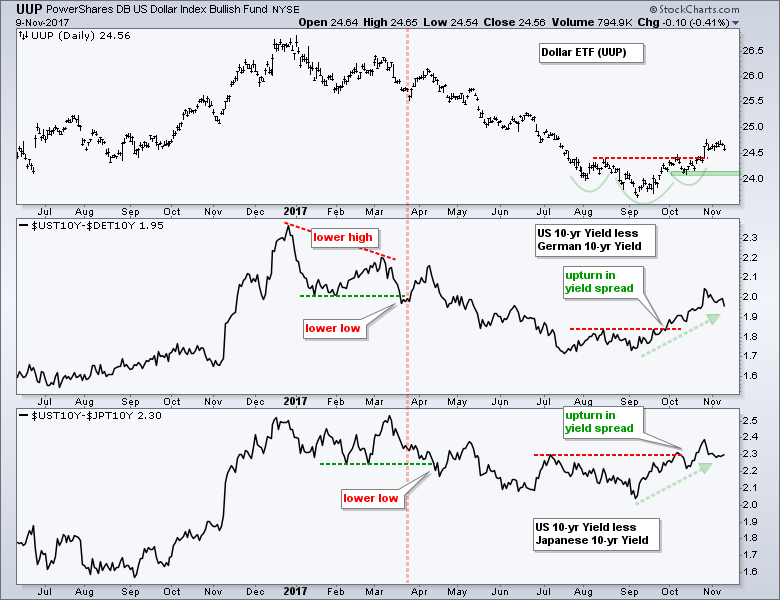
Dollar Holds its Breakout
The US Dollar ETF (UUP) broke neckline resistance of a small inverse head-and-shoulders and then stalled. The breakout is still holding and the trend since early September remains up. I will leave support at the October low and stay bullish on the green back as long as this level holds.
Art's Charts ChartList Notes
- The Home Construction iShares (ITB) recovered all of last week's sharp decline and hit a new high on Thursday.
- The Retail SPDR (XRT) has been bouncing between 38 and 42 since June. Perhaps a bottom is forming. Watch 40.6 for a wedge breakout.
- The Cyber Security ETF (HACK) fell back towards its support zone and RSI dipped below 40.
- After a 20+ percent advance, the Semiconductor iShares (SOXX) gapped down on Thursday and could be ready for a corrective period.
- The Broker-Dealer iShares (IAI) peaked in early October and consolidated, but a small descending triangle is taking shape and this could lead to a deeper pullback.
- After hitting a 52-week high in mid October, the Mortgage REIT ETF (REM) became very oversold after a sharp decline. Watch for signs of an upturn.
- The Regional Bank SPDR fell back into the first support zone and RSI became oversold (<30).
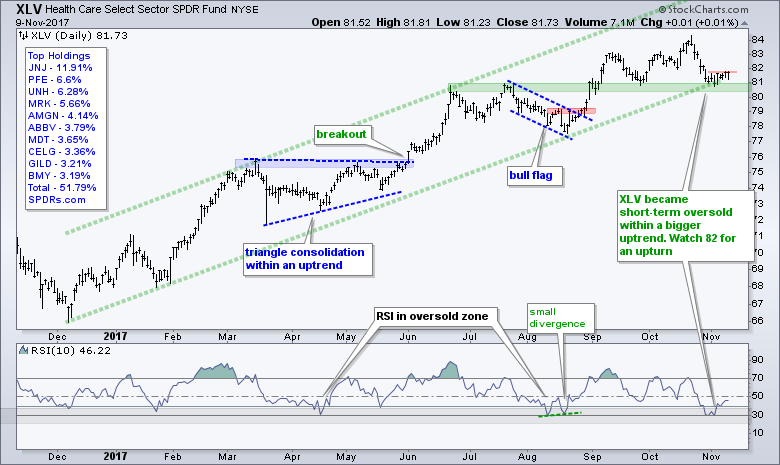
- The Biotech SPDR (XBI) pulled back and RSI became oversold. XBI is firming in the 82 area and RSI turned up last week.
- The Biotech iShares (IBB) is firming just above the August low and RSI is oversold. Time to watch for an upturn.
- The Medical Devices ETF (IHI) is one of the strongest groups with a fresh 52-week high on Thursday.
- The Oil & Gas Equip & Services SPDR (XES) is challenging resistance from an inverse head-and-shoulders pattern.
- The Metals & Mining SPDR (XME) broke wedge support with a sharp decline this week. The Steel ETF (SLX) is all over the place and testing support after a sharp decline the last four weeks.
- The breakout in the Copper Miners ETF (COPX) may be suspect because the Copper ETN (JJC) did not break out and XME is weak.
- Click here for the Art's Charts ChartList
******************************************************
ETF Master ChartPack - 300+ ETFs organized in a Master ChartList and in individual groups.
Follow me on Twitter @arthurhill - Keep up with my 140 character commentaries.
****************************************
Thanks for tuning in and have a good day!
--Arthur Hill CMT
Plan your Trade and Trade your Plan
*****************************************


