.... Mid-cap and Large-cap ETFs Hit New Highs
.... Checking the Mean-Reversion Trade for IJR
.... Small-caps are Really Really Small
.... Momentum ETF Extends its Lead
.... Gold Ignores Strength in TLT and UUP
.... Darden and Tiffany
.... Keycorp Consolidates after Surge
.... Two Mean-Reversion Setups (GD, STT)
.... Freeport McMoran Bounces off Support ....
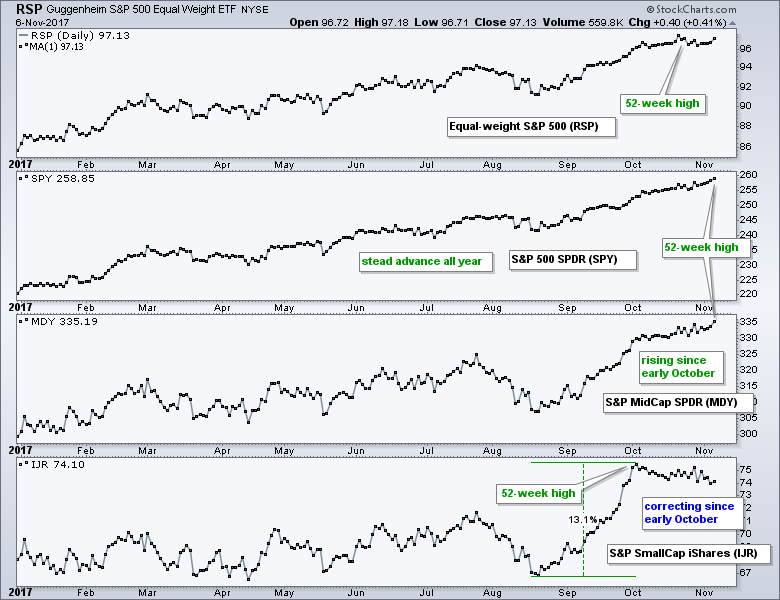
Small-caps are leading since mid August, but lagging since early October. Before reading too much into short-term relative weakness in small-caps, note that the S&P 500 SPDR (SPY) and the S&P MidCap SPDR (MDY) hit fresh 52-week highs on Monday (closing basis). The EW S&P 500 ETF (RSP) is very close to a 52-week high and the S&P SmallCap iShares (IJR) is around 2% from a 52-week high. SPY has been in a steady uptrend all year and MDY is showing some mettle with a steady advance since early October. Oh, the obscure Nasdaq 100 ETF (QQQ) also hit a 52-week high on Monday.
Checking the Mean-Reversion Trade for IJR
I am not concerned with short-term relative weakness in small-caps because I think this is just a correction after a sharp advance. "Think" is the key word and sometimes I get in trouble when I "think" something in the analysis process. I am, however, not just thinking because the evidence favors further upside. First, we are in a bull market. Second, IJR surged to new highs with a double-digit gain from mid August to early October and the long-term trend is clearly up. Third, a flat or slightly falling consolidation is typically a bullish continuation pattern. The chart below shows IJR with this consolidation highlighted in blue. The pattern trader would look for a surge off the consolidation lows or a breakout at 75.5 to turn bullish.
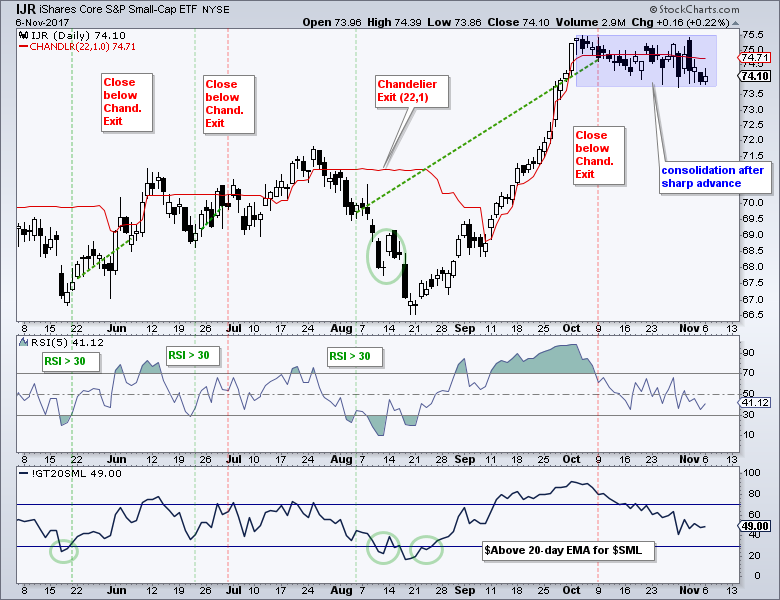
The mean-reversion trader would wait for RSI(5) to dip below 30 and then move back above 30. The green vertical lines show this system in action with the last buy signal on August 4th and sell signal on October 9th. A sell signal triggers with a close below the Chandelier Exit. There is no stop-loss for this system, which you can read about in this System Trader article. Currently, RSI(5) dipped below 40, but has yet to dip below 30 to initialize a bullish setup. Indicators, settings and systems are not perfect. Sometimes IJR starts its rebound without RSI(5) dipping below 30 and sometimes IJR continues lower even after a signal.
The lower indicator window shows Small-Cap %Above 200-day EMA (!GT200SML) with horizontal lines at 30% and 70%. A dip below 30% signals a short-term oversold condition and a subsequent upturn above 30% trigger a bullish signal. There have been three signals in the past six months (green circles).
Small-caps are Really Really Small
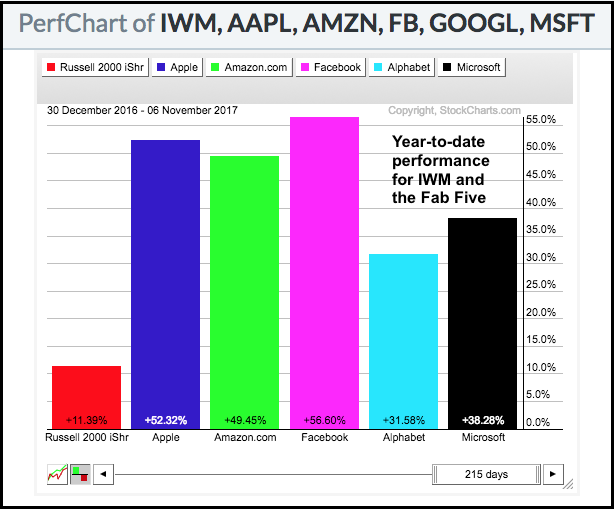
I am also not concerned with relative weakness in small-caps because small-caps are simply too small to serious affect the broader market. According to the Russell website, the Russell 1000 accounts for over 90% of the total market cap for the US stock market. That leaves less than 10% for the Russell 2000, which means small-caps are really really small. The total market cap of the Russell 1000 was $24.9 trillion in June 2017 and the total market cap of the Russell 2000 was $2.3 trillion. To put this into perspective, the Fab Five of the Nasdaq 100 have a total market cap of $3.326 trillion. Here are the individual market caps (billions): Apple (895), Alphabet (717), Microsoft (651) Amazon (540), Facebook (523). Clearly, the Russell 2000 is just the tail and the Russell 1000 is the dog. The dog wags the tail, not the other way around. This is why relative weakness in small-caps is not an issue for the broader market. I would not feel too sorry for small-caps because the Russell 2000 iShares (IWM) is still up over 11% year-to-date and not performing that bad.
Momentum ETF Extends its Lead
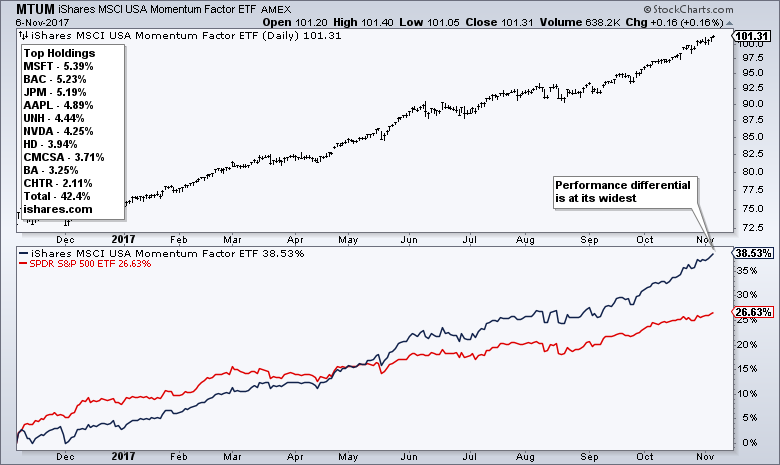
This CNBC video link shows Jonathan Krinsky, chief market technician at MKM Partners, discussing momentum with Brian Sullivan. Jonathan always provides interesting and level-headed insights. The chart below reflects his point that the performance gap between the USA Momentum Factor ETF (MTUM) and the S&P 500 SPDR (SPY) is at its highest of the year. It is interesting to note that the MTUM did not start outperforming SPY until May.
Gold Ignores Strength in TLT and UUP
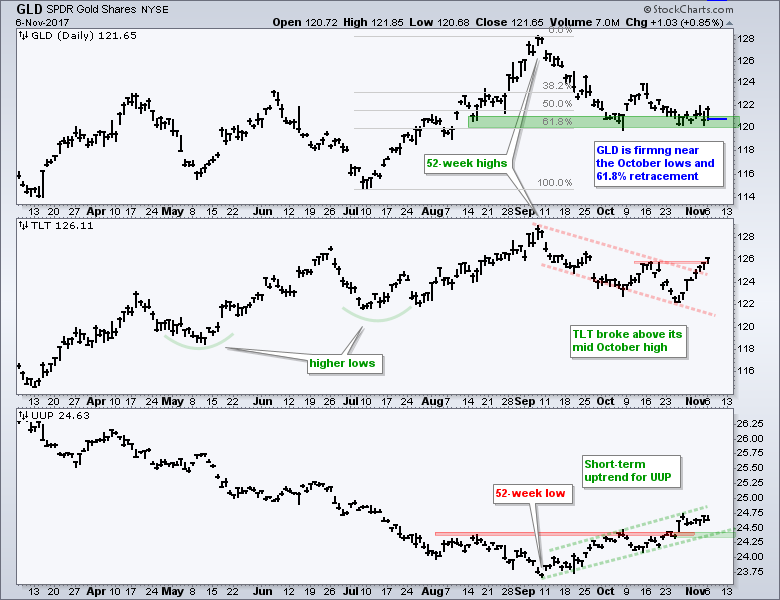
There is something interesting happening in the intermarket arena because the Gold SPDR (GLD), US Dollar ETF (UUP) and 20+ YR T-Bond ETF (TLT) are all up over the last ten days. I would expect gold to be down when TLT and UUP are up. On the price chart, GLD is firming near the October lows and the 61.8% retracement. Also note that GLD bounced off this support zone with a .85% gain on Monday. The middle window shows TLT moving above its mid October high, but this may not last with the recent surge in oil. The lower window shows UUP in an uptrend with support marked at 24.30
Darden and Tiffany
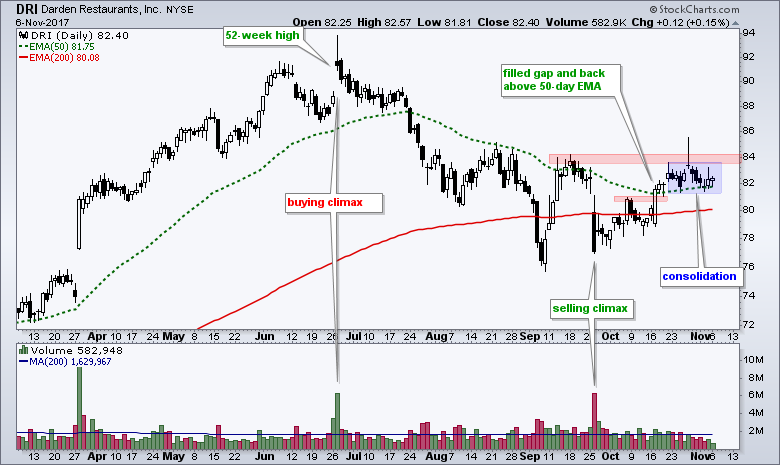
Here are a few stock setups. Note that all are in long-term uptrends (50-day EMAs above 200-day EMAs). The first chart shows Darden Restaurants (DRI) recovering after a high-volume decline by filling the gap and breaking a short-term resistance level. The stock is currently consolidating and a breakout at 83.7 would be bullish.
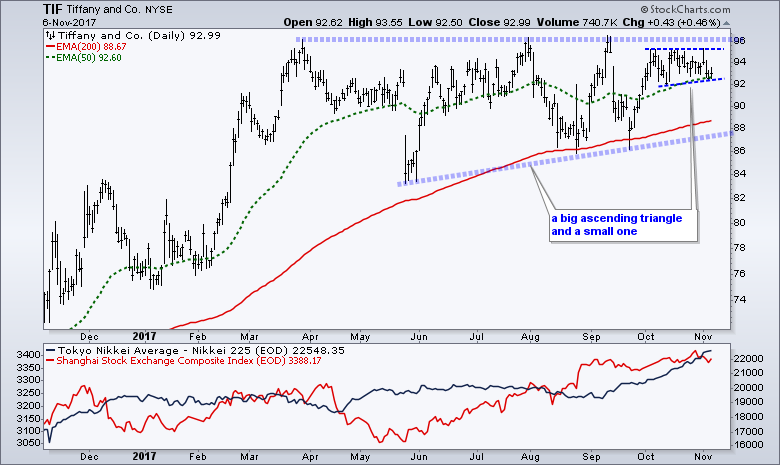
Tiffany (TIF) gets around 15% of its sales from Japan and 23% from China. Note that the Nikkei 225 ($NIKK) hit a 52-week high on Monday and the Shanghai Composite ($SSEC) hit a new high last week. On the price chart, TIF sports a big ascending triangle since April and a small one since early October. Breakouts would be bullish and signal a continuation of the long-term uptrend.
Keycorp Consolidates after Surge
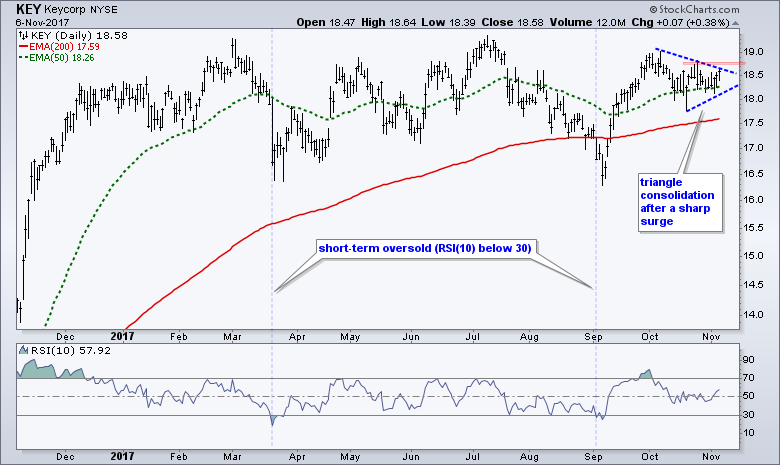
Keycorp (KEY) is part of the Financials SPDR (XLF) and the Regional Bank SPDR (KRE). The stock surged from around 10 in late June to around 19 in early March (+90%). Trading since March has been flat with a big range taking shape. KEY surged in September and then consolidated with a small triangle. Watch for a break above 18.8 to signal a continuation higher.
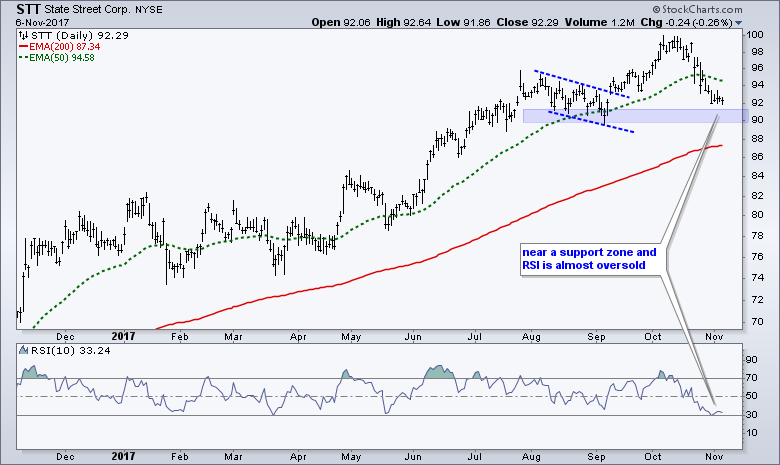
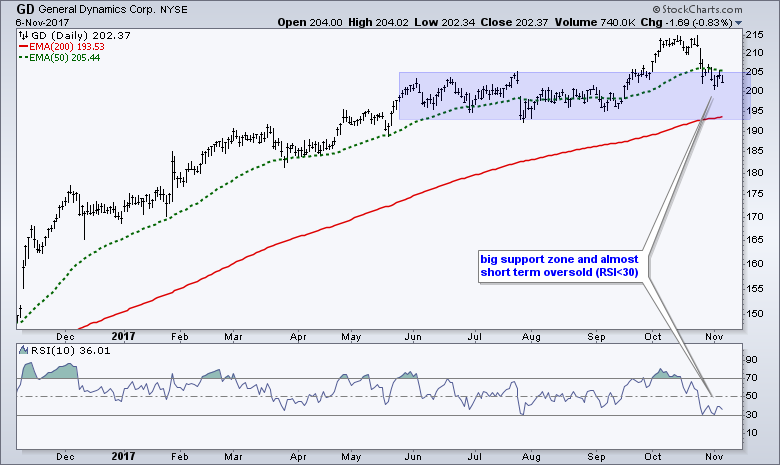
Two Mean-Reversion Setups
The next charts show two stocks with long-term uptrends and short-term pullbacks. Both hit 52-week highs recently and then fell back with RSI(10) almost becoming short-term oversold (below 30). These are mean-reversion setups that warrant a watch.
Freeport McMoran Bounces off Support
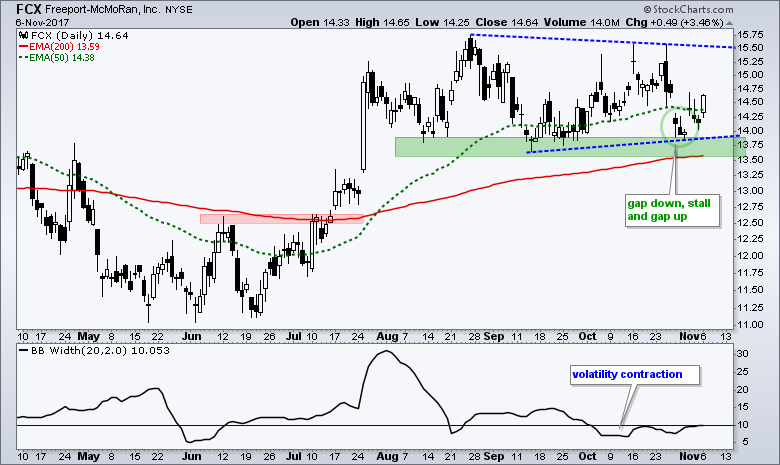
Freeport McMoran (FCX) is an interesting company, to say the least. The company paid some $20 billion for Plains Exploration and McMoRan Exploration in 2012 when oil was trading in the $80 to $110 range. The company then started shedding its oil & gas assets in 2015 when oil was moving below $50. Needless to say, the losses were BIG. The company is once again a copper and gold miner with one of its biggest mines in Indonesia. There is currently a dispute as the Indonesian government seeks to change the ownership structure. I just want to know the background of the company because this allows me to correctly identify its sector and industry group (basic materials/metals & mining). On the price chart, FCX surged above resistance in the summer and then consolidated the last three months. The stock bounced off support in the 13.75 area three times. Notice the gap down, stall and gap up reversal in late October (green circle) and the strong gain on Monday. Thus, we have a reversal within the consolidation. The next October highs and triangle trend line mark the next test in the 15.50 area.
******************************************************
ETF Master ChartPack - 300+ ETFs organized in a Master ChartList and in individual groups.
Follow me on Twitter @arthurhill - Keep up with my 140 character commentaries.
****************************************
Thanks for tuning in and have a good day!
--Arthur Hill CMT
Plan your Trade and Trade your Plan
*****************************************


