- A Big Theme to Consider for 2018
- 10-yr T-Yield Targeted above 3%
- An Outsized Move for the 30-yr Yield
- Rising Rates Negative for Gold, XLU and IYR
- Rising Rates Positive for Finance Sector
- Price Targets for XLF and KRE
A Big Theme to Consider for 2018
The 20+ YR T-Bond ETF (TLT) and 7-10 YR T-Bond ETF (IEF) fell sharply the last two days and their respective yields surged. John Murphy featured this big move and the negative effect on utilities and REITs in Tuesday's Market Message. Erin Swenlin and I discussed yields and their effect on other groups in the MarketWatchers Live last Wednesday. Today I will go over some of the charts featured on this show. We will look the long-term trends for IEF and TLT, the long-term trends for the 10-yr and 30-yr yields, and the groups that could suffer/benefit in in the coming months.
10-yr T-Yield Targeted above 3%
The 7-10 YR T-Bond ETF and the 10-yr T-Yield represent the belly of the yield curve because these are the "middle" maturities. The 10-yr yield, in particular, is important because it is often used as a benchmark for long-term lending. Both the 10-yr yield and IEF look set to continue trends that started in September. This means the 10-yr yield could rise significantly in the coming months. IEF broke wedge support in September, stalled with a triangle and broke the triangle line this week (provided this week's decline holds). The rising wedge is a bearish continuation pattern and the breakdown targets a move below the 2016 low. In other words, this is a continuation of the July-December 2016 decline.
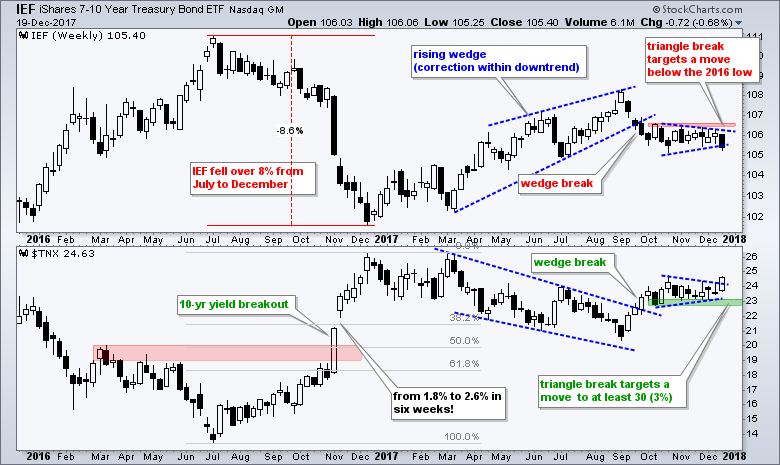
The lower window shows the 10-yr T-Yield breaking out of a falling wedge, stalling with a triangle and then breaking the triangle line this week. The correction ended with the wedge breakout and the triangle breakout opens the door to higher yields (> 3%). Notice that the 10-yr T-Yield surged from 1.8% to 2.6% in just six weeks in the third quarter of 2016. The bond market can make fast adjustments and one of them could be happening right now.
An Outsized Move for the 30-yr Yield
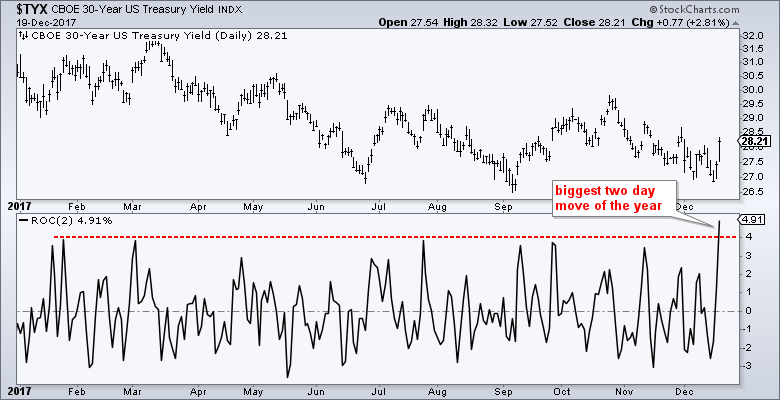
The 20+ YR T-Bond ETF (TLT) and the 30-yr T-Yield ($TYX) have not been on the same page as the 7-10 YR T-Bond ETF and the 10-yr T-Yield, but that may be changing with big moves this week. TLT fell over 2% the last two days and the 30-yr T-Yield surged 4.91%, which is the highest percentage 2-day move year-to-date. This "outsized" move could signal the start of a bigger move (higher).
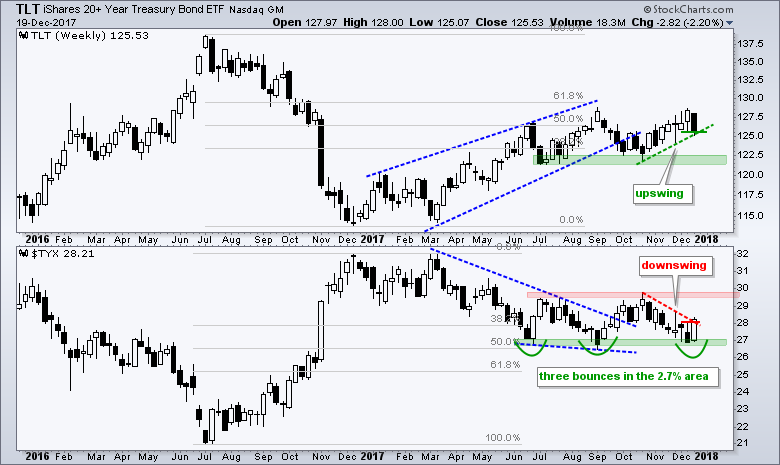
The next chart shows TLT testing upswing support near 125.5 (green line) and the 30-yr T-Yield bouncing off the 27 level (2.7%) for the third time in the last six months. Notice that the 30-yr T-Yield reversed its downswing with a close above the high of the prior two weeks. This week, however, is incomplete so we have to wait until Friday for a definitive answer.
Rising Rates Negative for Gold, XLU, IYR and XLP
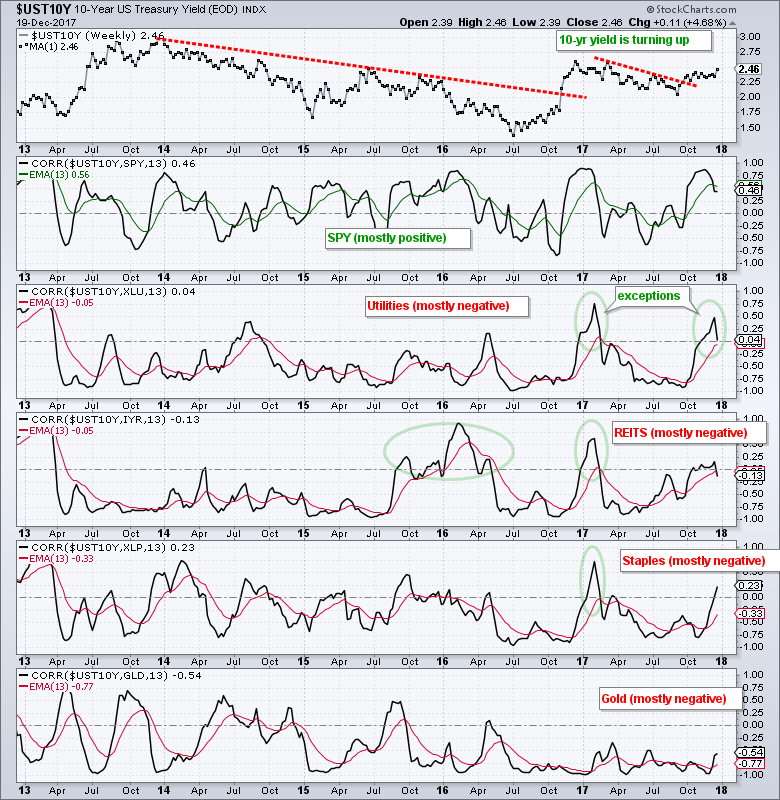
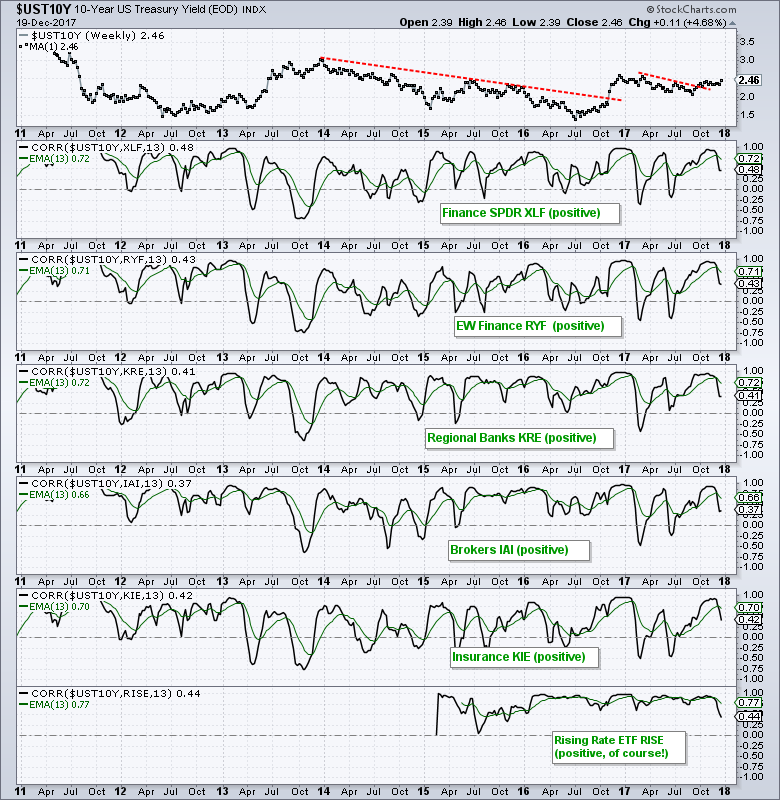
The first chart shows weekly closes for the 10-yr T-Yield in the top window and Correlation Coefficients in the lower windows. Keep in mind that correlations are not stable and tend to fluctuate. I am not looking at the last value, but rather the overall picture over the last few years. The 10-yr yield is "mostly" positively correlated with SPY, but this correlation is quite erratic. The 10-yr yield is mostly negatively correlated with the Utilities SPDR (XLU), REIT iShares (IYR), Consumer Staples SPDR (XLP) and the Gold SPDR (GLD). These negative correlations are more stable because the 13-week EMAs (red lines) of the 13-week Correlation Coefficient spent most of their time below zero. Given these correlations, I would avoid these three sectors and gold for the next few months.
Rising Rates Positive for Finance Sector
The next charts show the Correlation Coefficients for the 10-yr T-Yield and five finance-related ETFs. The last window shows the Correlation Coefficient with the Rising Rate ETF (RISE). Yes, Virginia, there really is an ETF for rising rates. The volumes are quite low, but it does trade. The black lines mark the 13-week Correlation Coefficients for each and the green lines are the 13-week EMAs for smoothing. The KRE and IAI green lines have been positive the longest (since December 2013. The XLF, RYF and KIE green lines have been positive since early 2015. Clearly, these five groups could benefit from rising rates.
2018 Price Targets for XLF and KRE
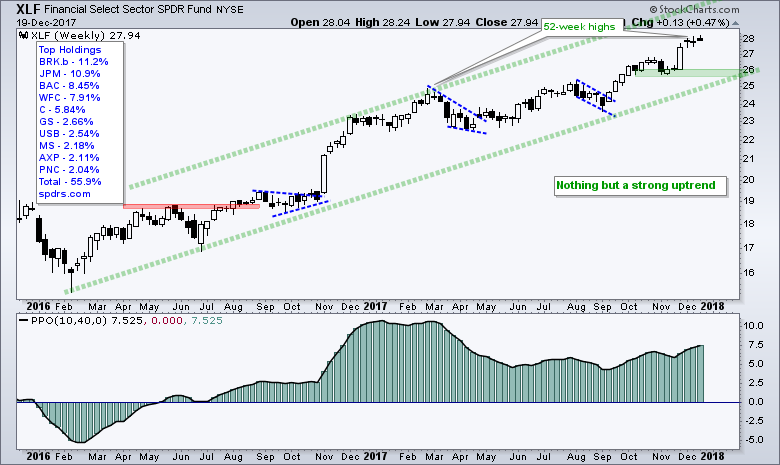
It would be easy to say buy the finance-related ETFs on pullbacks, but we may not get a pullback anytime soon. Assuming that long-term Treasury yields rise in the coming months, I would expect the finance-related ETF to continue their uptrends. The first chart shows XLF surging to another new high in mid November and then stalling for two weeks and two days (the current week is only two days old). This is a minor stall in an uptrend (think flat flag) and we could see further strength. I am not a big fan of targets based on line extensions or pattern measurements, but they are part of classical technical analysis. The upper line of a possible rising channel extends to the mid 30s for an upside target into 2018.
The Regional Bank SPDR (KRE) surged some 70% from June 2016 to February 2017 and then corrected with a long falling wedge into early September. The ETF broke out of the wedge with three strong weeks in September and hit a new high in November. The wedge breakout signals a continuation of the 72% advance and chartists can use the "Measured Move" for an upside projection. A 70% advance from the September low would project a move to the low 80s (83%).
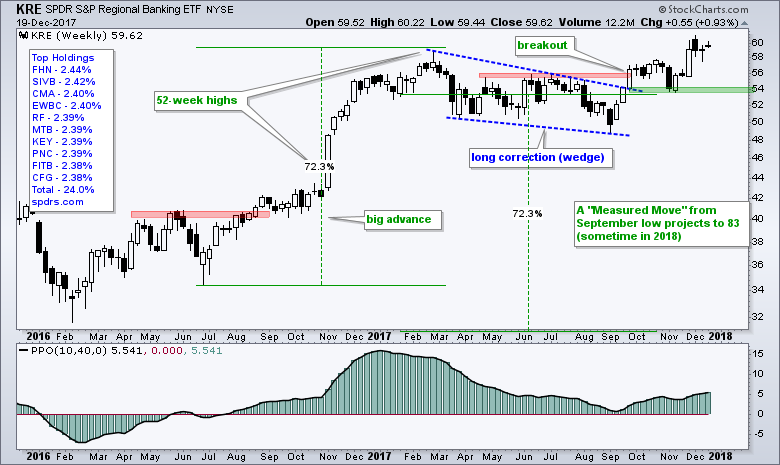
Before getting too excited about big gains in XLF and KRE throughout 2018, remember to take these targets with a bucket of salt (not just a grain). The big trends are clearly up and these uptrends favor further gains because a trend in motion is expected to stay in motion. Our job as chartists is to monitor these trends and price action on a regular basis. The short-term can be prone to unpredictable swings, but I would consider these long-term trends valid as long as the green support zones hold (XLF in the 26 area and KRE in the 54 area).
******************************************************
ETF Master ChartPack - 300+ ETFs organized in a Master ChartList and in individual groups.
Follow me on Twitter @arthurhill - Keep up with my 140 character commentaries.
****************************************
Thanks for tuning in and have a good day!
--Arthur Hill CMT
Plan your Trade and Trade your Plan
*****************************************


