 |
.... SPY Hits Another New High .... A Mean-Reversion Strategy for 2018 .... Breadth Symbols for Other ETFs .... Time off for Happy Holidays!! .... IJR Follows QQQ with Flag Breakout .... Defensive Sectors Lag as Energy Takes the Lead .... Oil Goes for a Triangle Breakout .... Oil & Gas Equip & Services SPDR Pops (plus XOP) .... Gold Bounces, but Remains Bearish Overall .... The Mother of all Double Bottoms .... MLPs and a Play on Domestic Steel .... Narratives are Dangerous, Very Dangerous (HRB) .... Notes from Art's Charts ChartList .... .... |
----- Art's Charts ChartList (updated December 22nd) -----
SPY Hits Another New High
We will start with the chart of the S&P 500 SPDR (SPY) and 14-day RSI, which has been near 70 for most of the last 57 days. The first green zone shows when RSI moved above 70 on 28-Nov-2016 and then stayed above 50 for 79 days. The second green zone shows RSI moving above 70 on 2-Oct-17 and remaining above 50 for 57 days and counting. Notice that SPY gained around 9.2% after RSI moved above 70 in November 2016 and has currently gained 6.5% since RSI moved above 70 on October 2nd.
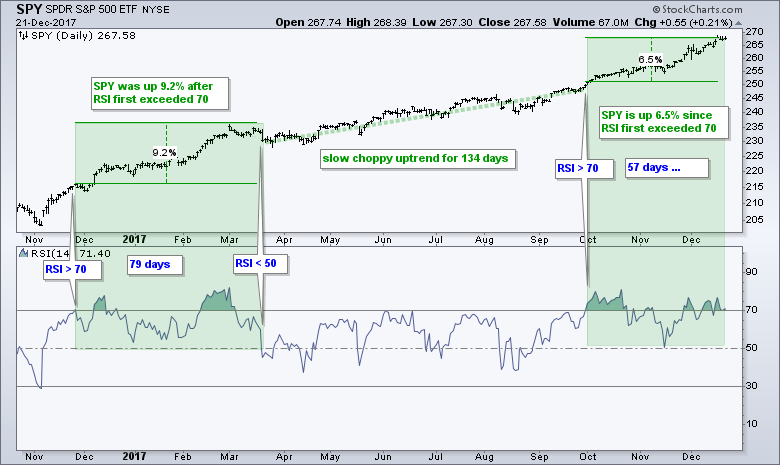
Pulling out the crystal ball, it is conceivable that the market continues higher into early January and the uptrend then slows. In other words, this uptrend could simply continue for a few more months in a slower and choppier fashion. The space between the green shading on the chart above provides an example of a slowing uptrend. Notice how SPY advanced around 8% over a 134 day period from late March to late September. There were some minor pullbacks along the way, but these were relatively short-lived (a few days to a few weeks).
A Mean-Reversion Strategy for 2018
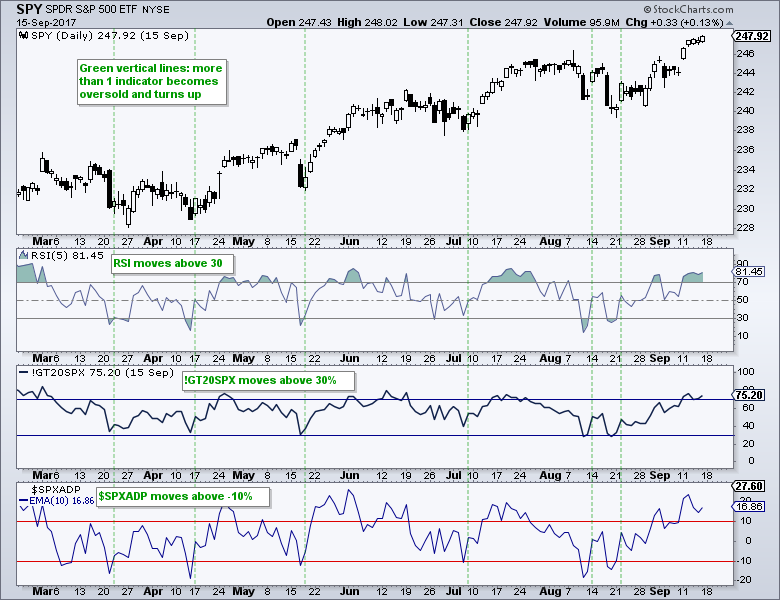
Assuming the uptrend continues, but slower and choppier at some point, chartists can consider some sort of mean-reversion strategy to time the dips. The next chart shows SPY with RSI(5), the S&P 500 %Above 20-day EMA (!GT20SPX) and the 10-day EMA of S&P 500 AD Percent ($SPXADP). The latter two are breadth indicators. !GT20SPX becomes oversold with a dip below 30% and the 10-day EMA of $SPXADP becomes oversold with a dip below -10%. The idea is to look for two of the three to become oversold and then move back above their oversold levels. The green vertical lines mark the signals from March to August.
Breadth Symbols for Other ETFs
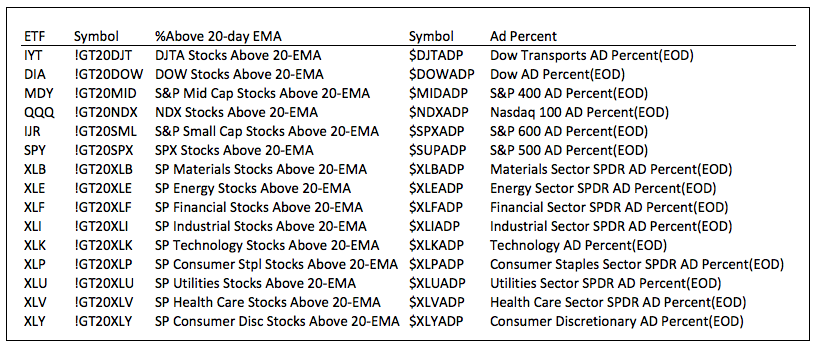
Chartists looking for a little homework over the holidays can create similar charts for the nine sector SPDRs and some of the major index ETFs. The table below shows the ETF symbol, the symbol for %Above 20-day EMA and the symbol for AD Percent. Notice that the "!GT20" and "ADP" portions of the symbol remain fixed (!GT20SPX and $SPXADP). You simply need to replace the index or ETF symbol. If you wish to create these charts, click on the chart above to use as a template and then change out the symbols. Once the chart is too your liking, choose "save as" at the top of the chart and place the new chart in one of your ChartLists.
Happy Holidays!!
Programming Note: I will be off between Christmas and New Year. Thus, the next commentary in Art's Charts will be on Tuesday, January 2nd. On behalf of all of us at StockCharts.com, I would like to wish you a very merry Christmas and a happy happy New Year!

IJR Follows QQQ with Flag Breakout
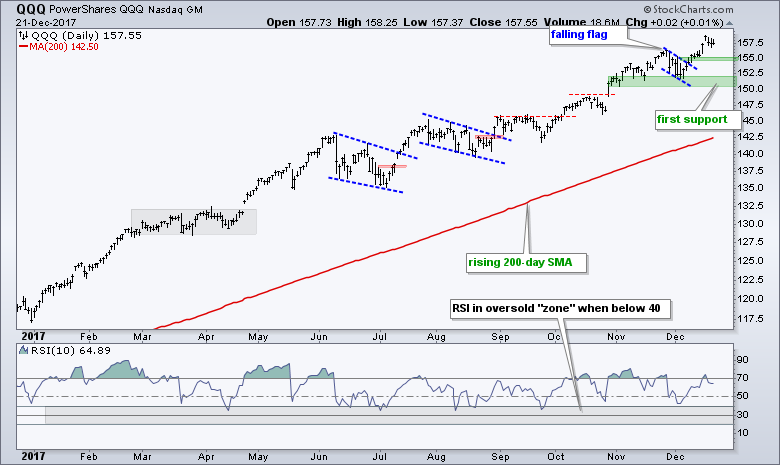
QQQ broke out of its flag pattern two weeks ago and hit another new high on Monday. Chartists can watch the breakout zone around 154-155 for potential support on a throwback. The November-December lows mark the next support zone.
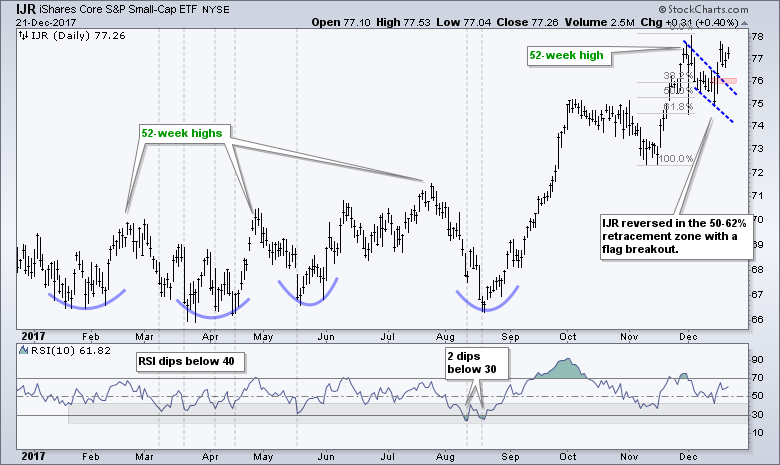
The S&P SmallCap iShares (IJR) broke out of its flag last Friday and gapped up on Monday. This is a great example of why chartists need to raise the alert level when there is a pullback to the 50-62% retracement zone. IJR took two steps forward with the surge from 72.5 to 78 and one step backward with the pullback to 75. This backward step ended with the flag breakout and the bigger uptrend is back in play.
Defensive Sectors Lag as Energy Takes the Lead
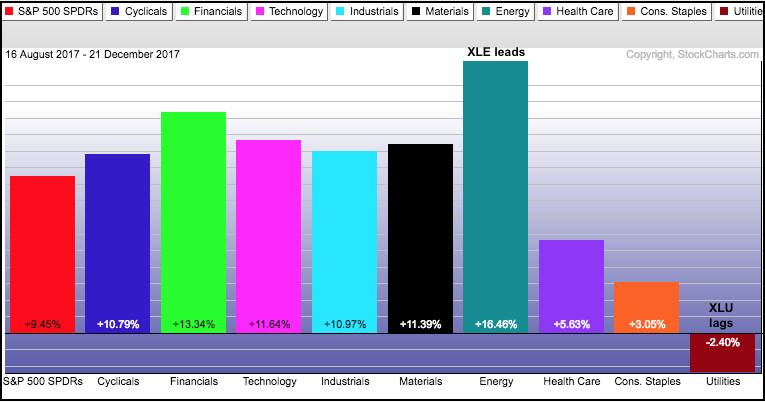
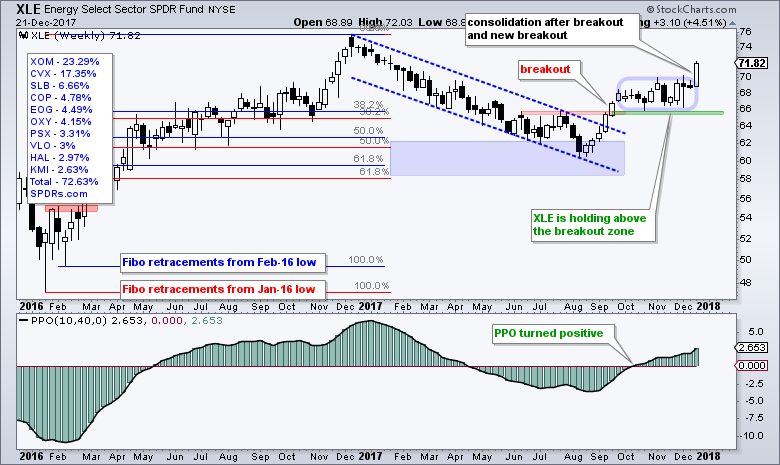
Sector participation remains strong with seven of the nine sector SPDRs hitting new highs this week (XLY, XLK, XLF, XLI, XLB, XLV and XLP). The Health Care SPDR (XLV) fell back after hitting a new high on Monday and the stocks in this group remain quite mixed. The Utilities SPDR (XLU) was hit especially hard and is back near its October low. The Energy SPDR (XLE) is still a ways from a 52-week high, but XLE is the best performing sector since mid August. Utilities are the worst performing sector and the only sector with a loss since mid August. Also notice that the Health Care SPDR (XLV) and Consumer Staples SPDR (XLP) are also lagging since mid August. Thus, the three traditionally defensive sectors are lagging.
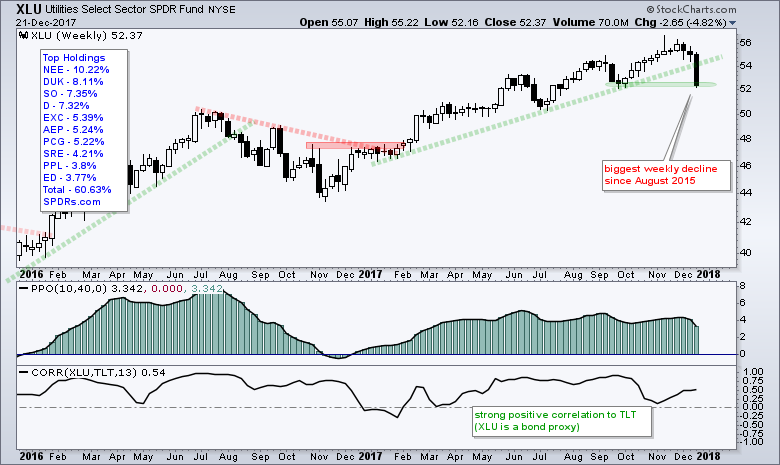
As noted in Wednesday's commentary, the breakdown in TLT and breakout in the 10-yr yield could negatively affect XLU, XLP, IYR and GLD. Conversely, this commentary also notes that the breakout in Treasury yields could positively effect the finance sector.
Oil Goes for a Triangle Breakout
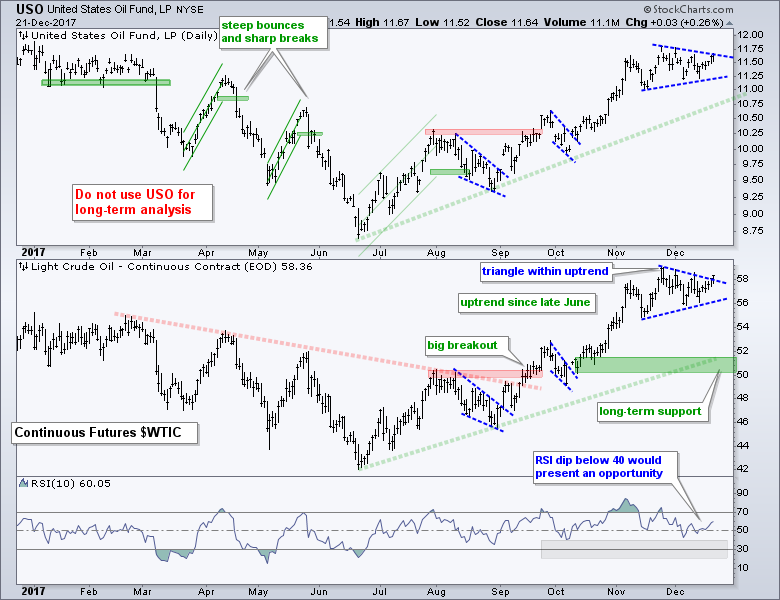
The USO Oil Fund (USO) and Light Crude Continuous Contract ($WTIC) hit new highs in late November and then moved into consolidation patterns (triangles). These represent a rest within the uptrend and they are continuation patterns. Oil bounced the last six days and both look poised to break out of their triangles. This simply keeps the bigger uptrends alive in oil and this is positive for energy-related shares.
XES and XOP Pop
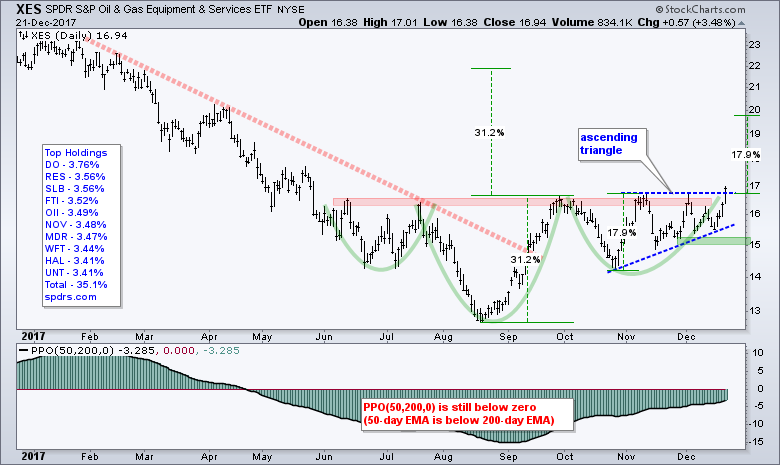
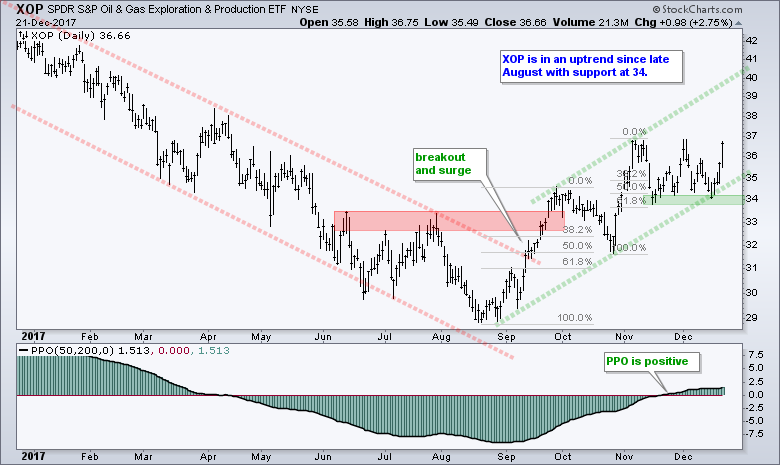
I noted the ascending triangle taking shape in the Oil & Gas Equip & Services SPDR (XES) on Tuesday's commentary and the ETF broke out to confirm this pattern. Traditional technical analysis suggests that the height of the pattern (~18%) can be added to the breakout level for an upside target, which is to around 20. There is also a larger inverse head-and-shoulders pattern working since June and this pattern targets a 31% move from the breakout (~22). Either way, the breakout is bullish until proven otherwise. I will just leave key support at 15 for now. The second chart shows the Oil & Gas E&P SPDR (XOP) with the upper line of a rising channel extending to the low 40s in January.
Gold Bounces, but Remains Bearish Overall
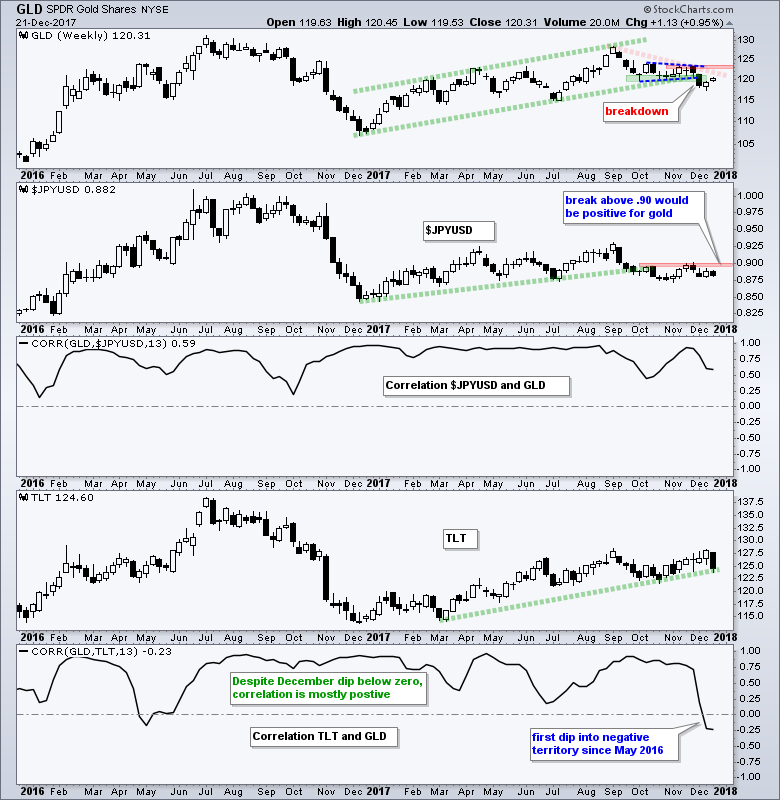
The Gold SPDR (GLD) actually performed pretty well this week, considering the Yen/Dollar cross fell and the 20+ YR T-Bond ETF (TLT) plunged. I would have expected gold to fall under these circumstances. Nevertheless, the overall trend for gold is down and my bearish stance has not changed. GLD broke down with the triangle break and channel break in November. A break above the November highs is needed to reverse this nascent downtrend. Even though I watch the GLD chart first and foremost for analysis, I also have my eye on $JYP/USD and TLT. $JPYUSD needs to break above .90 to benefit gold. This week's plunge in TLT and surge in yields is negative for gold. Also note that rising US Treasury yields could be positive for the Dollar.
The Mother of all Double Bottoms
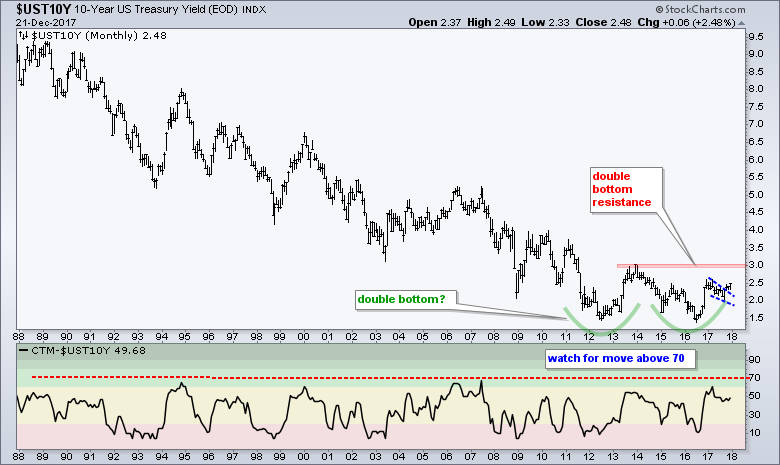
The surge in the 10-yr Treasury Yield and plunge in Treasury Bonds was the talk of the town this week. I covered the weekly charts for TLT and the 10-yr T-Yield in Wednesday's commentary and will look at a monthly chart today. The 10-yr T-Yield ($UST10Y) sports a big double bottom that could foreshadow a reversal of a 35-year downtrend. Note that the 10-yr yield peaked near 16% in September 1981 and dipped below 1.4% in July 2016. There have been big counter-trend moves and consolidations along the way, but the secular trend remained for over 30 years. With a big double bottom taking shape the last six years, this secular downtrend could be poised for a reversal. A breakout at 3% would reverse this big downtrend and target a move to the 4.5% area. Chartists can also watch the Chande Trend Meter for a move above 70. Notice that it has not been above this level in over 30 years.
MLPs and a Play on Domestic Steel
Ken Weissenberg, Eisner-Amper tax partner, discusses the benefits for real estate investors with the passage of tax reform (and MLPs).
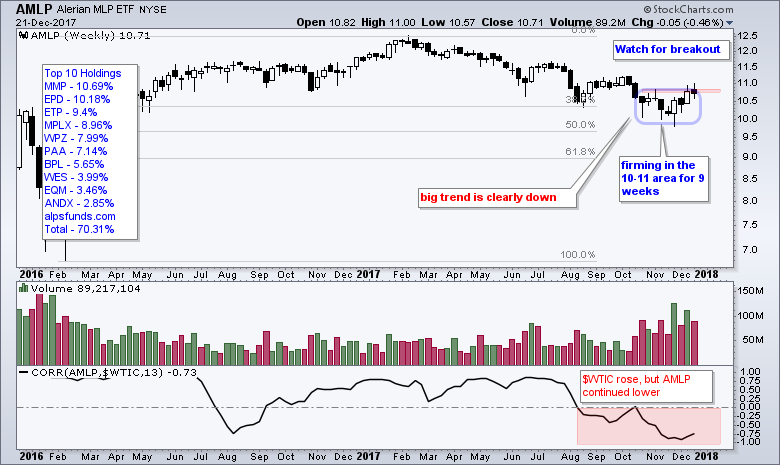
Art's Chart Take: MLPs are tricky beasts with lots of cross currents affecting their business model. The MLP ETF (AMLP) peaked in February and hit 52-week lows in July, August, October and November. The overall trend is down, but notice that the ETF retraced around 50% of the prior advance and firmed in the 10-11 area for nine weeks. A breakout at 11 would be bullish. The indicator window shows MLP with two weeks of high upside volume during this consolidation. MLP is lagging oil because oil advanced from August to December. This caused the Correlation Coefficient to turn negative. I am still not sure about MLPs at this stage and think there are better areas of the market right now.
Mark Tepper, Strategic Wealth Partners, and Craig Johnson, Piper Jaffray, discuss the trade in miners and metals with Brian Sullivan.
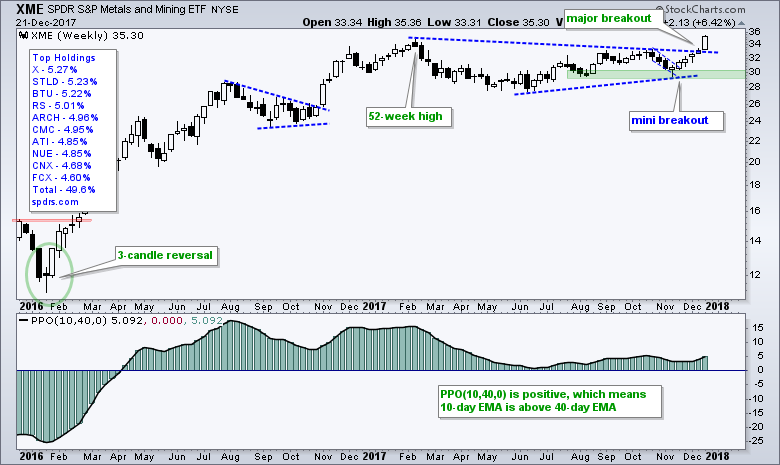
Art's Chart Take: The Metals & Mining SPDR (XME) did indeed break out of a big consolidation pattern and could be poised to play catch up in 2018. Note that around 48% of the ETF comes from the steel industry and many of these are US-based steel producers (X, STLD, NUE, ATI). In contrast, the Steel ETF (SLX) is heavily weighted toward non-US steel producers. Greg Schnell and I discussed this group in the StockCharts Outlook on December 9th. https://stockcharts.com/webinars/scc-outlook.html
Narratives and the Siren Song (HRB)
A narrative is a story we can relate to that will affect the price of a stock or ETF. Narratives ALWAYS make sense when we read them or talk about them, but they do not always play out as expected. Yes, sometimes they act like siren songs. Narratives are especially dangerous for technical analysts. First, there is more than one narrative and we might not be following the right narrative. Second, the narrative could prove right, but the price might not react as we expect. Third, the narrative can affect our judgment and interpretation of the chart. I put forth a one-sentence narrative that HR Block (HRB) might benefit from tax reform because it means new rules for tax preparation, but only because the chart looked good at the time as well. Note that the MotleyFool has a different narrative on HRB.
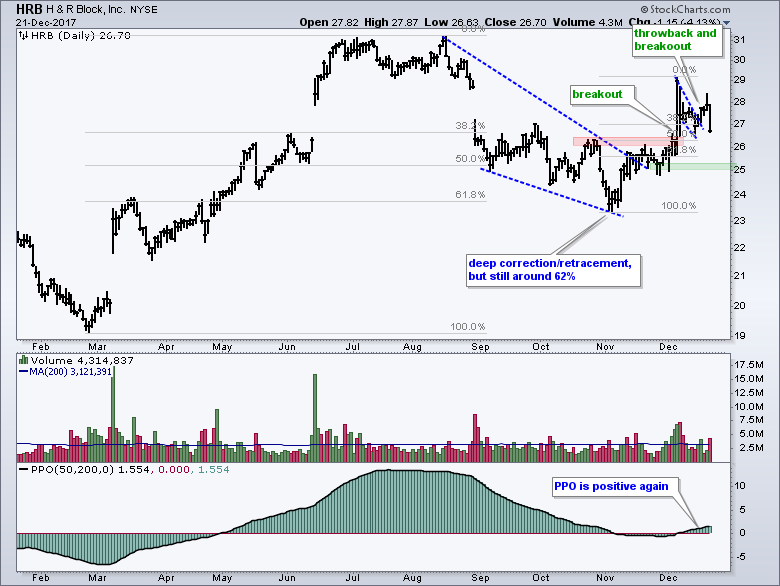
I featured the stock on Tuesday as it broke out of a small wedge pattern (the PPO was also positive). This breakout is already under threat because the stock plunged 4% on Thursday. The falling wedge breakout in the 25-26 area is the big breakout at work on the chart and it needs to hold. A 50-62% retracement of the breakout surge would put HRB back in the 26 area. A close below 25 would clearly exceed this area and negate the breakout. This is the level I am using to re-evaluate the bullish case for HRB.
Notes from Art's Charts ChartList
- This week's update of the Art's Charts ChartList will show a few different charts (FAN, PBE) and also feature some weekly charts for perspective.
- The following bullet points and notes are related to the charts in the Art's Charts ChartList, which was updated on 22-Dec (here).
- The Cyber Security ETF (HACK) broke out of a big cup-with-handle (weekly).
- The Networking iShares (IGN) broke out of a big ascending triangle (weekly).
- A measured move projects to 83 for the wedge breakout in Regional Bank SPDR (KRE) (weekly)
- The REIT iShares (IYR) stalled for five weeks and then plunged as Treasury yields surged (weekly)
- The Wind Energy ETF (FAN) corrected in Oct-Nov and turned up in December with a mini-breakout (weekly).
- The Biotech & Genome ETF (PBE) bounced off the 50% retracement with a mini breakout (weekly).
- The Copper Miners ETF (COPX) broke out of a falling flag/channel with a big move the last two weeks (weekly)
- The Metals & Mining SPDR (XME) broke out of a long triangle consolidation and record a 52-week high (weekly).
- The Steel ETF (SLX) broke out of a large cup-with-handle and recorded a 52-week high (weekly).
******************************************************
ETF Master ChartPack - 300+ ETFs organized in a Master ChartList and in individual groups.
Follow me on Twitter @arthurhill - Keep up with my 140 character commentaries.
****************************************
Thanks for tuning in and have a good day!
--Arthur Hill CMT
Plan your Trade and Trade your Plan
*****************************************


