.... Small, Equal-weight and Large-cap Sector Leaders
.... Industry Group ETF Leaders
.... Semis Surge from Oversold Levels
.... Biotech ETFs Struggle, but Remain Bullish
.... Oil Consolidates within Uptrend
.... XES Forms Ascending Triangle
.... H&R Block Holds Breakout Zone
.... Albemarle Takes One Step Back
.... Teekay Bids to End Long Correction
.... Stocks to Watch: CY, XRX, PRGO, FBHS ....
Small, Equal-weight and Large-cap Sector Leaders
There are a number of ways to measure relative strength and participation. One of my favorites is simply a list of sector and industry group ETFs making new highs. A new high reflects a strong uptrend and chart strength. As such, I ran a little scan looking for new closing highs on Monday. The first image shows three small-cap sectors hitting new highs, five equal-weight sectors hitting new highs and five sector SPDRs hitting new highs.
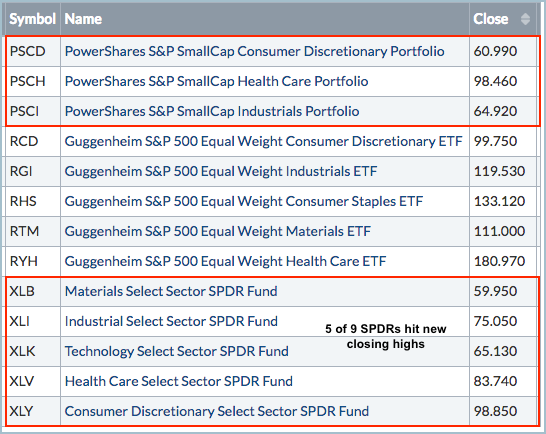
With five of nine equal-weight sectors and five of nine large-cap sector SPDRs hitting new highs, this means the majority of sectors in the S&P 500 are participating in the broad market uptrend and this reinforces the bull market. The small-cap sectors are lagging because only three hit new highs. Consumer discretionary, industrials and healthcare are the overall leaders because these three sectors hit new highs in all three groups (small-cap, equal-weight and large-cap). Chartists looking for stock setups in strong sectors can focus on these three.
Industry Group ETF Leaders
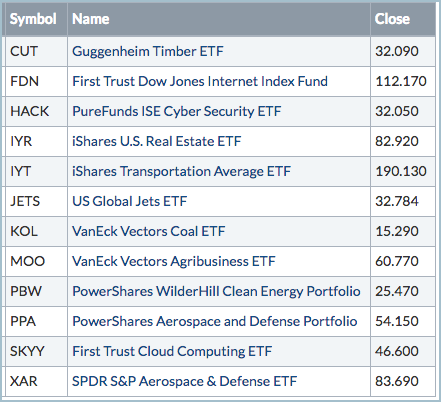
The next image shows some industry group ETFs that hit new highs on Monday. Three tech-related ETFs hit new highs (Internet ETF (FDN), Cloud Computing ETF (SKYY) and Cyber Security ETF (HACK)). For those counting REITs as a sector, note that the REIT iShares (IYR) hit a new high. XLRE, however, did not. The Coal ETF (KOL) is leading the energy sector with a new high, while the Agribusiness ETF (MOO) and Timber ETF (CUT) are leading the materials sector.
Semis Surge from Oversold Levels
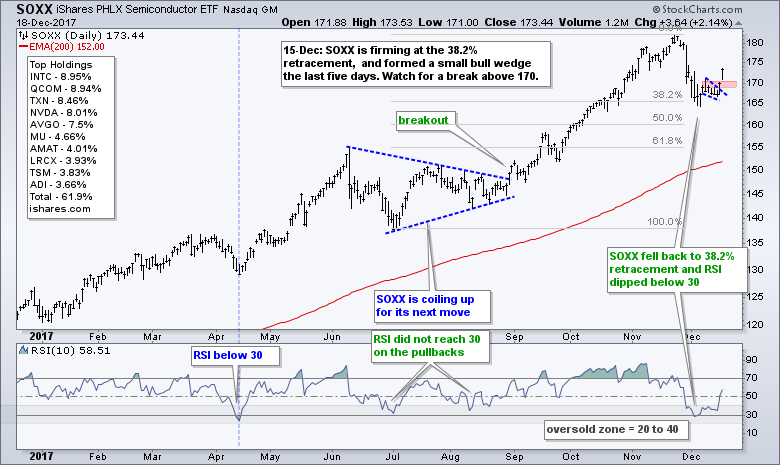
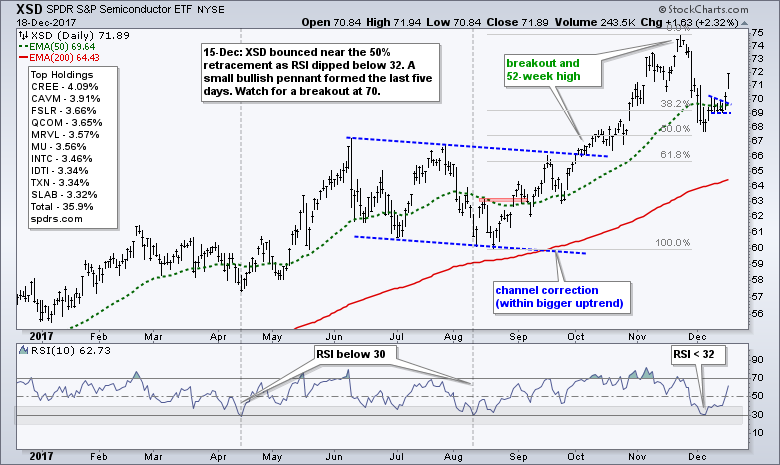
The Weekly Market Review & Outlook features a section called "Notes from Art's Charts Chartlist". Found near the end of the report, this is where I identify interesting setups in some of the 30 industry group ETFs that I follow. The Semiconductor iShares (SOXX) and Semiconductor SPDR (XSD) were featured with bullish pennants on Friday. These two were also featured on 7-Dec as they became short-term oversold within uptrend. Both surged over the last two days and broke short-term resistance. It looks like the short-term corrections have ended and the long-term uptrends are taking over again.
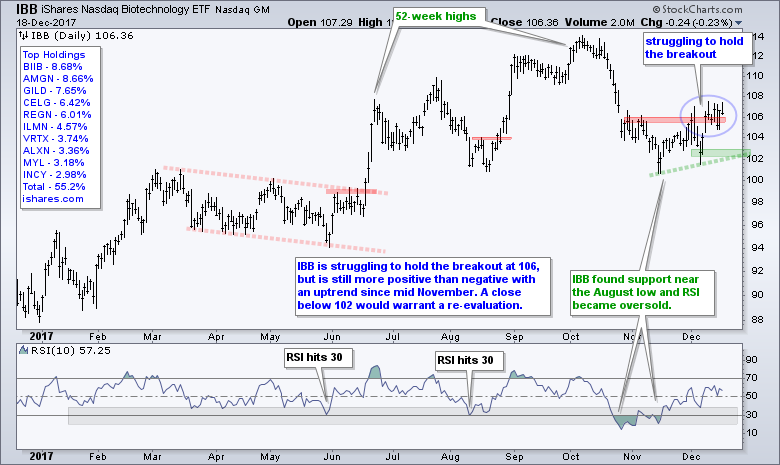
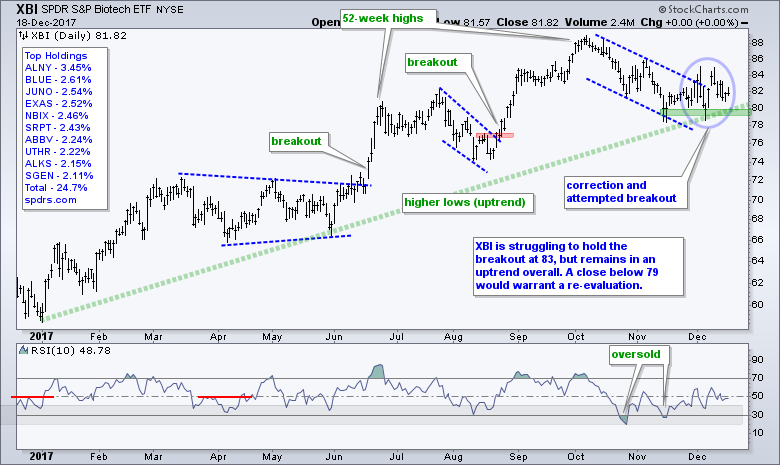
Biotech ETFs Struggle, but Remain Bullish
The Biotech iShares (IBB) and the Biotech SPDR (XBI) struggled on Monday and did not partake in the big market rally. IBB was down a fraction and XBI was unchanged. While I do not like to see this kind of non-participation, I still think the cup is half full for both because they recorded 52-week highs in October and are in long-term uptrends. IBB is struggling to hold its breakout at 106, but there is a short-term uptrend since mid November with support at 102. A close below this level would call for a re-evaluation. XBI is also struggling the last four weeks and a close below 79 would be bearish.
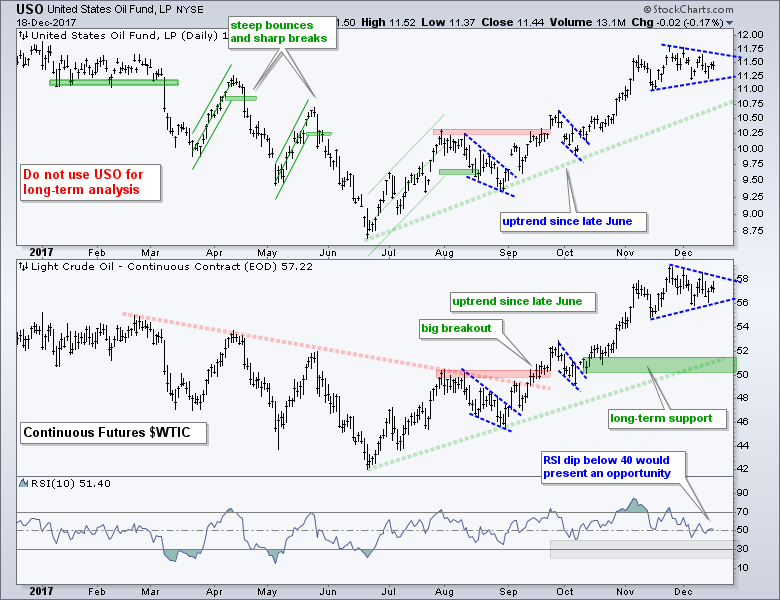
Oil Consolidates within Uptrend
The USO Oil Fund (USO) and the Light Crude Continuous Contract ($WTIC) are consolidating within uptrends and chartists should watch for the directional break. As an end-of-day (EOD) kind of guy, I only look at charts after the close or before the open. I am not too concerned with intraday price action. Instead, I am focused on the bigger trend and the short-term pattern at work over the last few weeks. Oil is in an uptrend overall and consolidating with a triangle short-term. A triangle breakout would signal a continuation higher. While a break below triangle support would be short-term negative, I would not turn completely bearish on oil. A deeper pullback would just set up the next mean-reversion opportunity when RSI dips into the oversold zone.
XES Forms Ascending Triangle
The direction of the break in oil could dictate the next move in the Oil & Gas Equip & Services SPDR (XES), which has been lagging oil this quarter. $WTIC is up around 10% in Q4 and XES is down around 3.5%. The chart shows XES in a long-term downtrend with a 52-week low in August and the PPO(50,200,0) in negative territory. XES surged around 30% from mid August to late September and then consolidated with a possible ascending triangle. This is a bullish continuation pattern and a break above the November highs would confirm the pattern. Notice that XES is bouncing off support now and a close below 15 would negate this pattern. 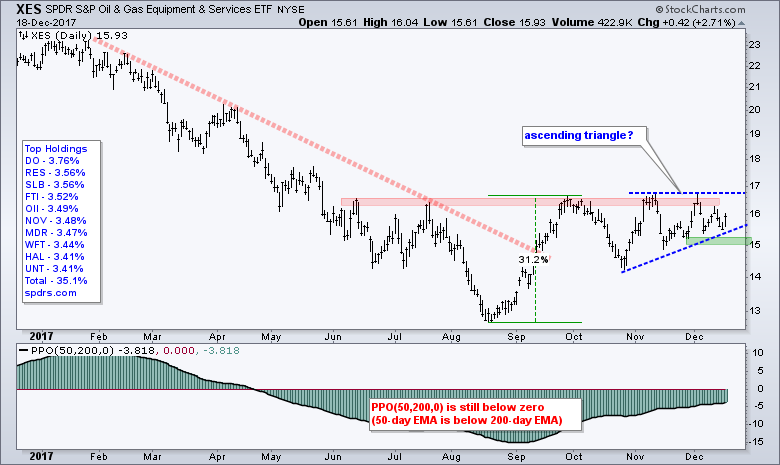
H&R Block Holds Breakout Zone
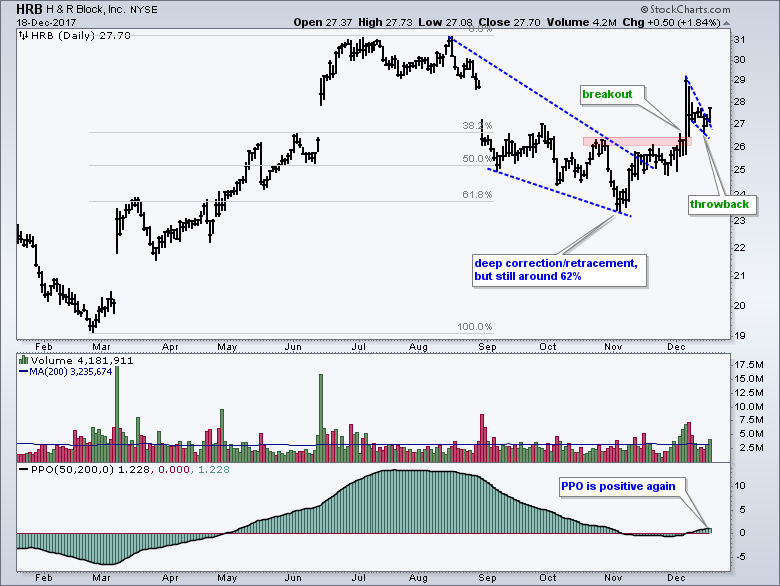
There is clearly a narrative at work with H&R Block and there is also a bullish chart to back it up. The narrative is tax reform and the ensuing chaos that will push people for help on their taxes. On the price chart, the stock corrected with a rather deep decline, but this move still retraced around 62% of the prior advance. Thus, it still fits with the two steps forward and one step backward scenario. More importantly, HRB broke out with a big move, fell back after the breakout and moved higher on Monday with good volume. It looks like the breakout is holding and I would expect new highs in the coming weeks. A close below 26 would argue for a re-evaluation of this bullish thesis.
Albemarle Takes One Step Back
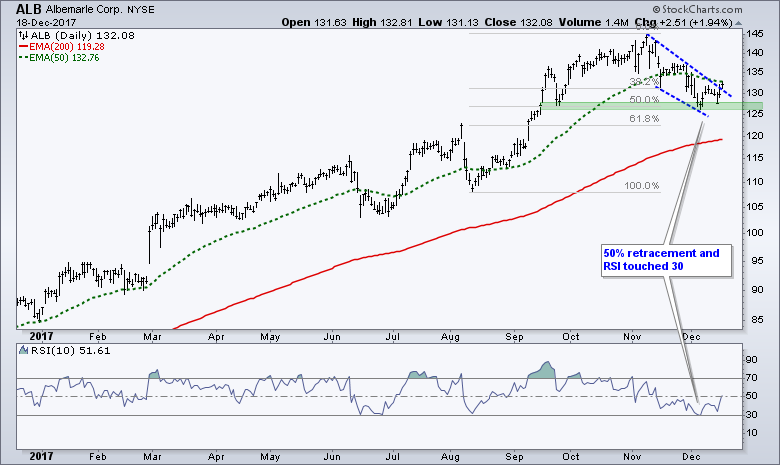
Albemarle (ALB) is a specialty chemical company that derives over a third of its revenue from lithium sales. The stock is in an uptrend and clearly one of the leaders in 2017 with a 50+ percent gain year-to-date. After hitting a new high in November, the stock pulled back with a 50% retracement and dip below 130. RSI touched 30 in early December as the stock became short-term oversold. This pullback as the markings of a correction within an uptrend and there are signs that this correction is ending as the stock broke the wedge line on Monday. A close below 125 would argue for a re-evaluation.
Teekay Bids to End Long Correction
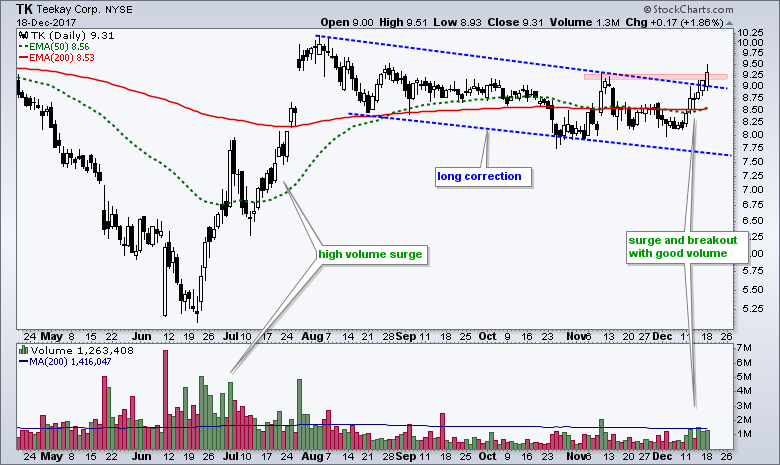
Teekay (TK) is a shipping concern that appears to be ending a looonnnnggg correction. First note that TK is a low priced stock (<10) with above average volatility and risk. The price chart is pretty straightforward with a high-volume surge in June-July, a correction from August to November and a breakout here in December. Notice that volume picked up nicely the last five days and the 50-day EMA is edging back above the 200-day EMA. A close below 8 would call for a re-evaluation.
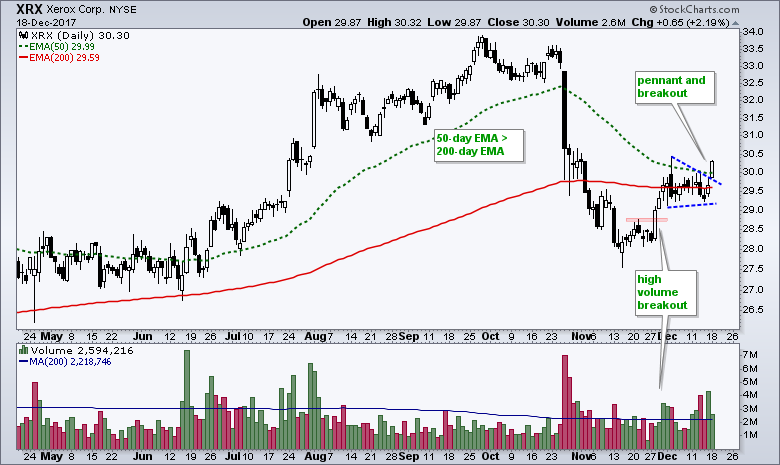
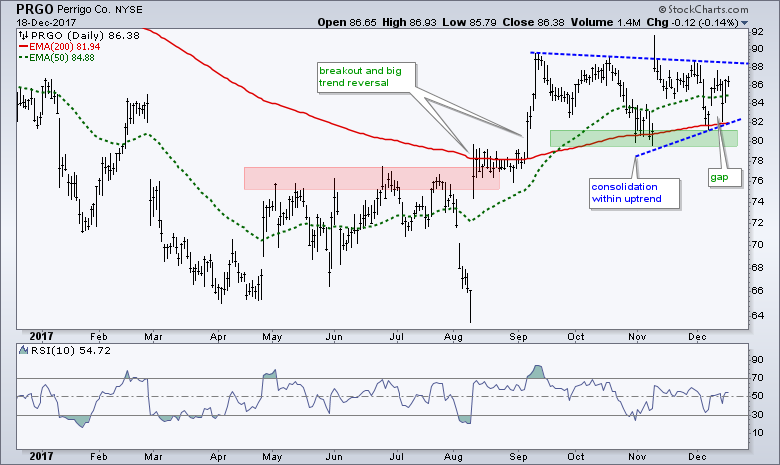
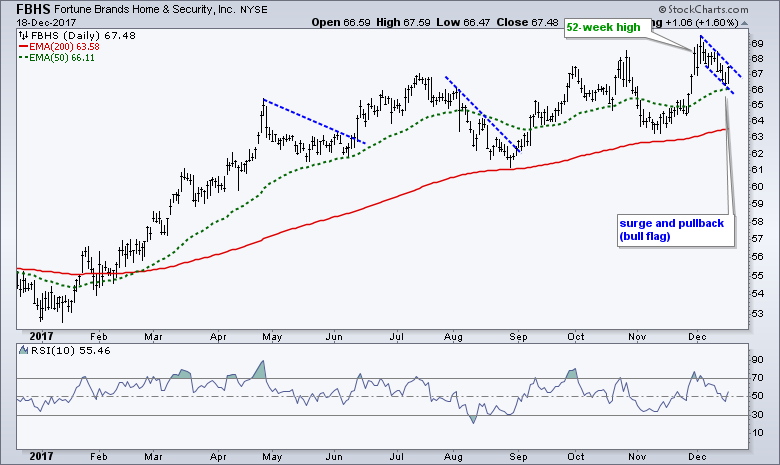
Stocks to Watch: CY, XRX, PRGO, FBHS
 ******************************************************
ETF Master ChartPack - 300+ ETFs organized in a Master ChartList and in individual groups.
Follow me on Twitter @arthurhill - Keep up with my 140 character commentaries.
****************************************
Thanks for tuning in and have a good day!
--Arthur Hill CMT
Plan your Trade and Trade your Plan
*****************************************


