 |
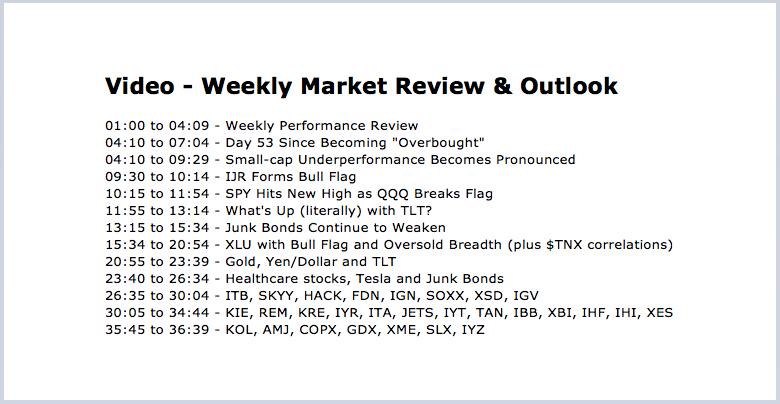
---- Day 53 Since Becoming "Overbought" ---- Small-cap Underperformance Becomes Pronounced ---- IJR Forms Bull Flag ---- SPY Hits New High as QQQ Breaks Flag ---- What's Up (literally) with TLT? ---- Junk Bonds Continue to Weaken ---- XLU with Bull Flag and Oversold CCI ---- Gold, Yen/Dollar and TLT ---- Healthcare stocks, Tesla and Junk Bonds ---- Notes from Art's Charts ChartList .... |
Day 53 Since Becoming "Overbought"
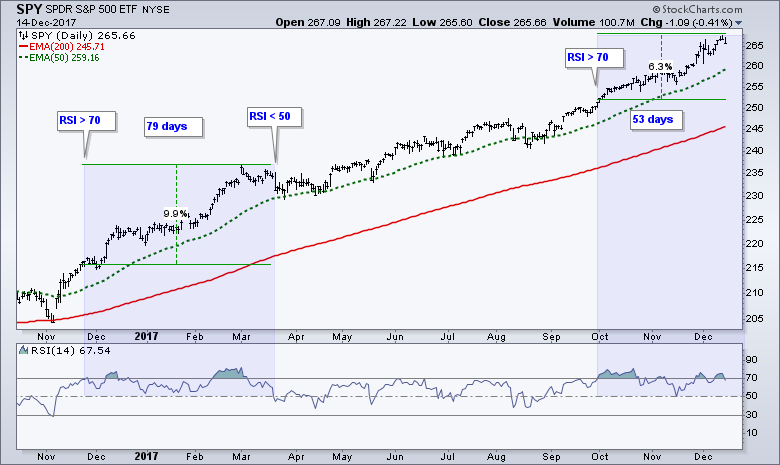
There are plenty of reasons for concern, but the bulk of the evidence remains bullish for stocks. The bears can point to "overbought" conditions, recent weakness in small-caps and the breakdown in junk bonds. On the bullish side, some 80% of stocks in the S&P 500 are above their 200-day EMAs, the S&P 500 AD Line hit a new high this week and the S&P 500 itself hit a new high. The chart below shows SPY and 14-day RSI. The blue shaded areas show when RSI moved above 70 and then moved back below 50. The November surge pushed RSI above 70 on November 25th. The ETF then added another 10% and RSI stayed above 50 until mid March (79 days). RSI currently moved above 70 on October 2nd and the ETF has added another 6.3% since then. RSI touched the 50 level in mid November and then moved back above 70. It has been 53 days since RSI first moved above 70 and remained above 50. I would not expect a correction until RSI moves below 50. Even then, any weakness would be considered a mere correction within the bigger uptrend and this would just create the next opportunity to buy the dip.
Be sure to check out Greg Morris' insight article for more on the "value" of overbought and oversold.
Small-cap Underperformance Becomes Pronounced
The S&P SmallCap iShares (IJR) has been lagging the S&P 500 SPDR (SPY) the entire year, but that did not derail the steady uptrend in SPY or prevent new highs in IJR. While I do not think long-term underperformance in small-caps is a major issue for the stock market, short-term bouts of serious underperformance could weigh short-term. Note that small-caps really took it on the chin the last two to three weeks with IJR falling 2.72% in December. SPY, in contrast, is up .25%.
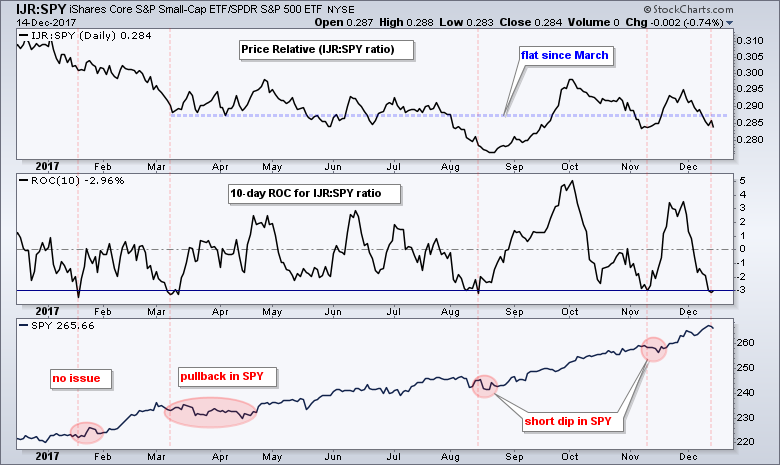
The chart below shows the price relative (IJR:SPY ratio) in the top window, the 10-day Rate-of-Change for this ratio and SPY. First, notice that the IJR:SPY ratio has been virtually unchanged since March, which means IJR is neither lagging nor leading the last eight months. The middle window shows the 10-day Rate-of-Change for this ratio dipping below -3% five times this year. These are the serious bouts of short-term underperformance. The first did not affect SPY, the second led to a pullback (March-April) and the last two foreshadowed minor dips. The most recent dip below -3% occurred this week and SPY is at a new high.
IJR Forms Bull Flag
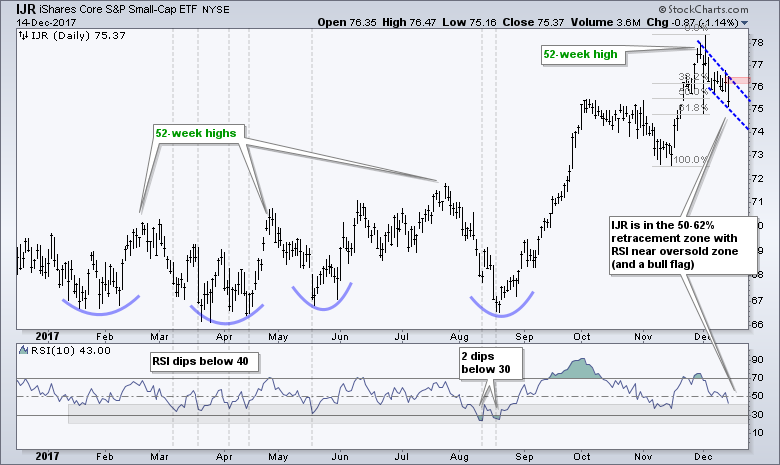
The next chart shows IJR hitting 52-week highs (closing basis) in September, October and November. The ETF fell back rather sharply the last two weeks with a move below 76 and a falling flag is taking shape. Technically, this is a correction after a sharp surge and a breakout at 76.5 would be bullish. The indicator window shows RSI(10) moving to 43 and nearing the oversold zone (<40). With the big trend clearly up, a move into the oversold zone would set up the next mean-reversion trading opportunity.
SPY Hits New High as QQQ Breaks Flag
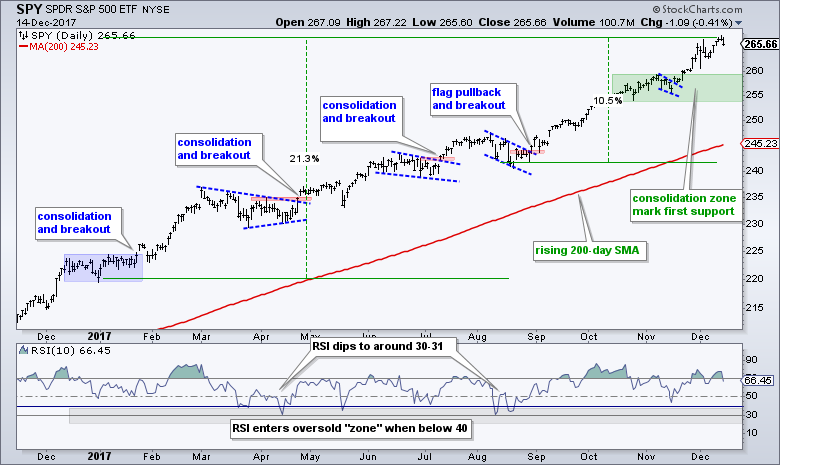
The S&P 500 SPDR (SPY) and large-caps continue to lead the market on the price charts as the ETF hit a new high again this week. SPY is up around 10% since mid August and up around 20% year-to-date. Basically, half of the year-to-date gain occurred in the last 3 1/2 months. The green zone marks first support to watch on any pullback.
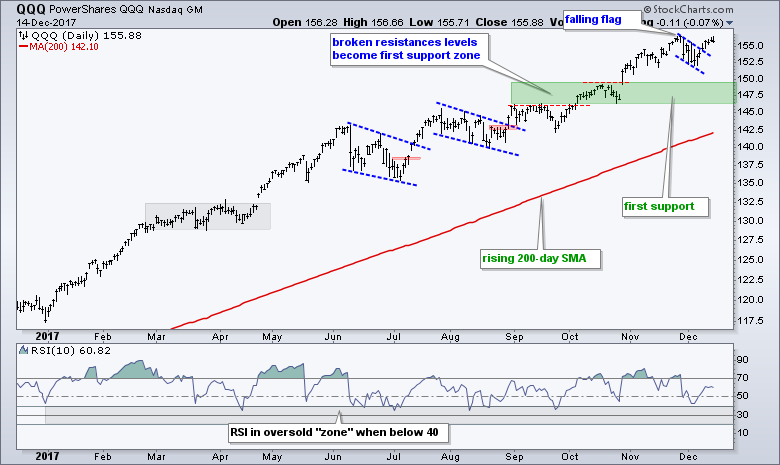
The next chart shows QQQ hitting a new high in late November, pulling back with a bull flag and breaking out over the last five days. The breakout is bullish until proven otherwise. A close below 153 would negate the breakout, but this would not be enough to derail the bigger uptrend. The green area marks the first support zone to watch.
What's Up (literally) with TLT?
The 20+ YR T-Bond ETF (TLT) refuses to back down and surged over the last two days to keep its upswing alive. Money continues to move into safe-haven long bonds and this casts a shadow on the recent highs in SPY. Perhaps this is affecting IJR and IWM more. Note that TLT is up 2.41% over the last two weeks and IJR is down 2.72% (negative correlation). I, for one, will be watching TLT for clues on small-caps more than large-caps.
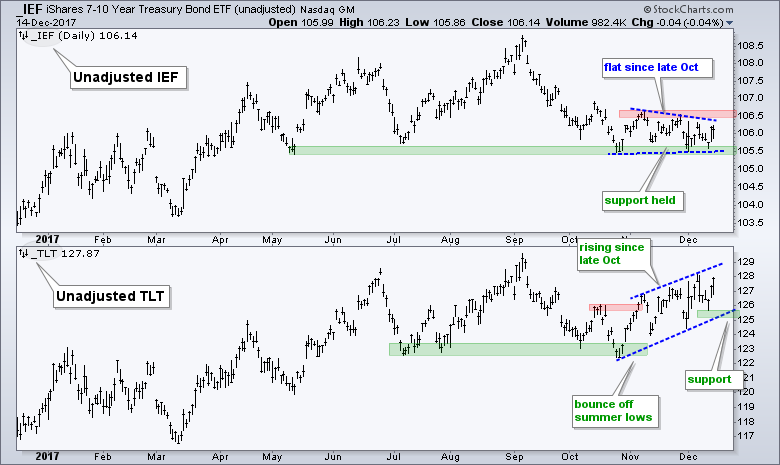
The chart below shows unadjusted IEF and TLT (_IEF and _TLT). IEF remains within a triangle consolidation, but got a bounce off support from the May-July lows. A break above the early November high would be bullish. TLT bounced off the summer lows in late October and worked its way higher the last seven weeks. A break below 125 in TLT would reverse this upswing and likely coincide with a break below support in IEF. This would be bearish for bonds and bullish for stocks, especially small-caps. On the flipside, continued strength in TLT and an upside breakout in IEF would show more money moving into safe haven bonds and this would be negative for stocks.
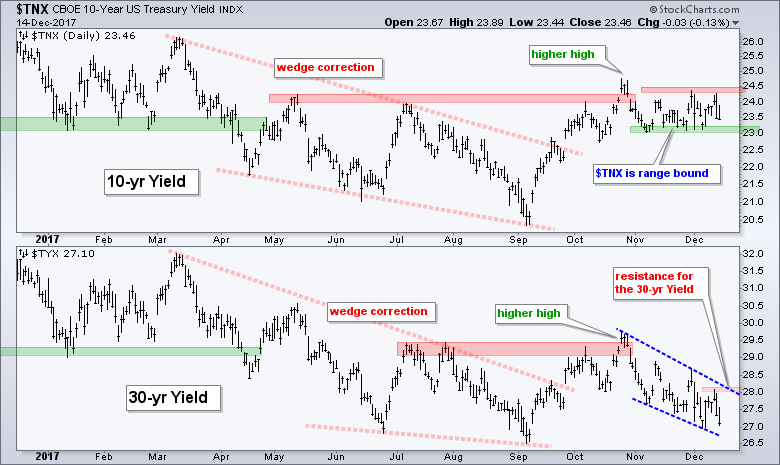
The next chart shows the 30-yr T-Yield ($TYX) nearing its September low with a sharp decline the last two days. Perhaps a base is building, but I would not bet on a successful test unless there is a break above this week's high. The 10-yr T-Yield ($TNX) is locked in a trading range. Watch 24.5 up and 23 down (2.45% and 2.3%).
Junk Bonds Continue to Weaken
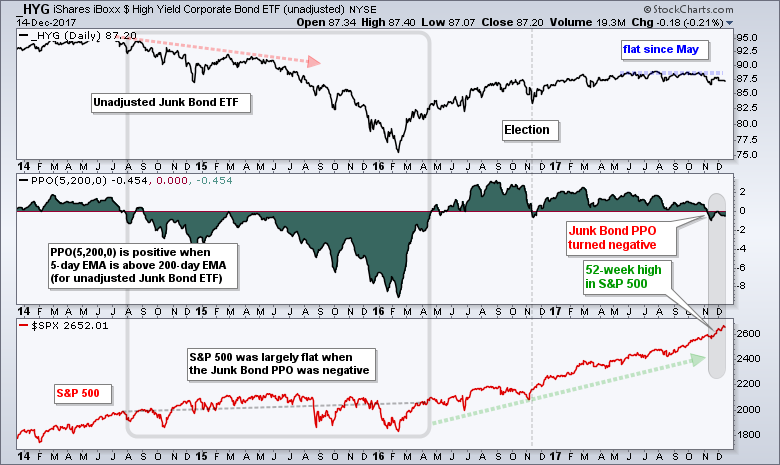
I realize that correlation is not causation and junk bonds have their quirks, but the High-Yield Bond ETF (HYG) continues to move lower and this suggests some risk-aversion in the financial markets. The chart below shows unadjusted HYG trading flat since May and falling to multi-month lows in November. The PPO(5,200,0) moved into negative territory over the last six weeks and this suggests a long-term downtrend in HYG (5-day EMA < 200-day EMA). This downturn is still relatively mild and may not affect the stock market. Notice how the PPO first turned negative in August 2014 and the S&P 500 did not peak until summer 2015. The downtrend in HYG, however, became more pronounced and the S&P 500 struggled until April 2016, which is when the PPO turned positive again.
XLU with Bull Flag and Oversold CCI
Utilities are sensitive to Treasury yields and the Utilities SPDR (XLU) is negatively correlated to the 30-yr T-Yield ($TYX). This means they tend to move in opposite directions. A decline in the 30-yr Yield should, in theory, be positive for XLU. Conversely, an upside breakout in $TYX could be negative for utilities and other interest rate sensitive ETFs (IYR, XLRE, XLP). XLU is at an interesting juncture because a bull flag is taking shape after a new high. A break above this week's high would provide the first sign that the flag is ending and the bigger uptrend is continuing.
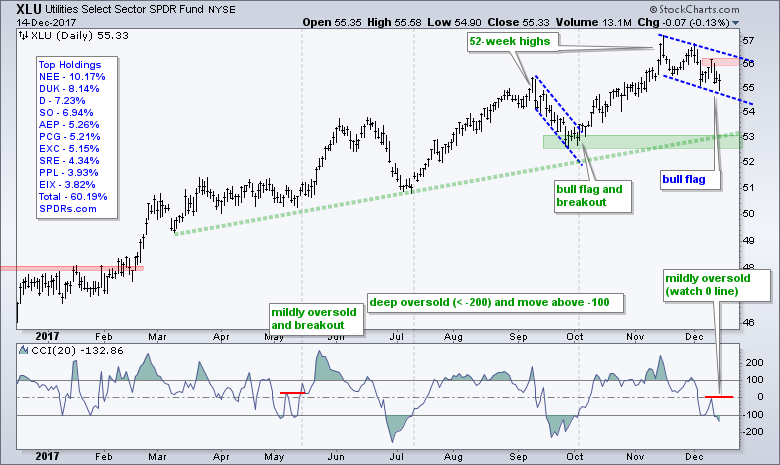
The indicator window shows the Commodity Channel Index (CCI) moving below -100 for a mildly oversold reading. A move below -200 shows an extreme oversold reading. There was a double top below -100 in May and a breakout foreshadowed a nice move in XLU. CCI moved below -200 in June and September, and subsequent moves above -100 foreshadowed bounces in XLU. At this point, I will watch CCI for a break above the zero line to signal an upturn in momentum.
Gold, Yen/Dollar Cross and TLT
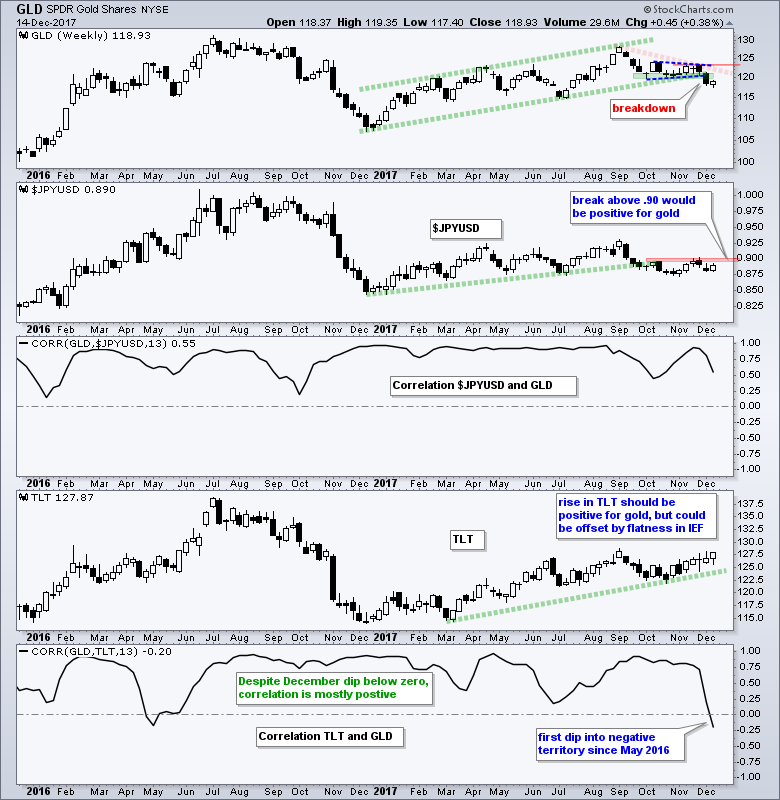
The Gold SPDR (GLD) broke down last week and this breakdown remains in effect. The chart below shows GLD with the Yen/Dollar cross ($JPYUSD), TLT and their correlation with GLD. A reader tipped me on the $JPYUSD connection with gold (thanks S.Q.!). Both have strong positive correlations overall, but the TLT correlation just dipped into negative territory. This is because GLD fell over the last 13 weeks and TLT rose. I am not sure if this negative correlation will last long though. The $JPYUSD cross broke down in October and this was negative for gold. A move above .90 is needed to trigger a breakout in $JPYUSD and positively influence for gold.
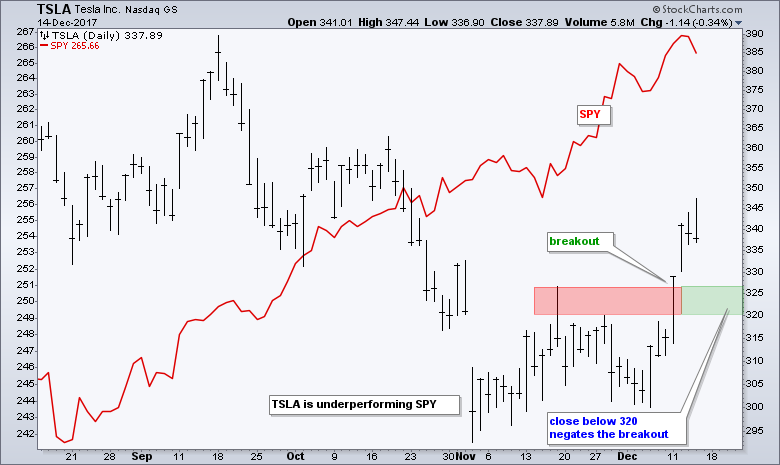
Healthcare stocks, Tesla and Junk Bonds
Jim Chanos, Kynikos Associates founder, speaks with CNBC's Kelly Evans at the Yale CEO Summit about the push for tax reform and what it means for the economy. Of note, he talks about the unintended consequences of the tax bill. Clip: Winter is coming for health-care stocks.
Jim Chanos also speaks of Tesla, and it is not good. As a technical analyst, I have a completely different approach to the markets than Chanos. However, he does his homework, provides noteworthy insights and has a good track record. Clip: Elon Musk has a broad interpretation of the truth.
Larry McDonald with the Bear Traps Report and Craig Johnson CMT with Piper Jaffray discuss what to buy on tax reform legislation with Brian Sullivan. I am paying more attention to Johnson on this one. Also notice that Johnson is showing the unadjusted chart for HYG. Clip: High yield enters into a death cross.
Notes from Art's Charts ChartList
- The following bullet points and notes related to the charts in the Art's Charts ChartList, which was updated on 8-Dec (here).
- ITB is one of the strongest groups since mid August, but quite extended and ripe for a rest. The 38-40 area marks first support.
- XRT is ripe for a rest or pullback after a 15% surge. Broken resistance and the 50-61.8% retracement zone mark first support.
- HACK has a large inverse head-and-shoulders working and is battling the neckline. Regardless of the pattern, the long-term trend is up with the recent 52-week highs.
- SOXX is firming at the 38.2% retracement and formed a small bull wedge the last five days. Watch for a break above 170.
- XSD bounced near the 50% retracement as RSI dipped below 32. A small bullish pennant formed the last five days. Watch for a breakout at 70.
- KRE hit a 52-week high and then fell back with a rather steep falling wedge. The ETF may find support in the 57 area.
- IBB is struggling to hold the breakout at 106, but is still more positive than negative with an uptrend since early November. A close below 102 would warrant a re-evaluation.
- XBI is struggling to hold the breakout at 83, but remains in an uptrend overall. A close below 79 would warrant a re-evaluation.
- FCG does not look great. The long-term trend is down, the ETF reversed in the 38-50% retracement zone and a bearish wedge formed. A break below 21 would reverse the 3-month upswing.
- XES remains within a rising wedge with support marked at 15 and the ETF is at its moment-of-truth (support test). Amazing to think that oil is 8% above its October high and XES is 5% below its October high.
- AMJ is making a breakout bid with a move above the February trend line and early November high. Time to put it on the watchlist for pullbacks.
- COPX remains within a falling flag/channel with resistance at 25.5.
- SLX has a bullish cup-with-handle working on the weekly chart (watch the Dollar because the top holdings are non-US).
- ******************************************************
ETF Master ChartPack - 300+ ETFs organized in a Master ChartList and in individual groups.
Follow me on Twitter @arthurhill - Keep up with my 140 character commentaries.
****************************************
Thanks for tuning in and have a good day!
--Arthur Hill CMT
Plan your Trade and Trade your Plan
*****************************************


