---- SPY Ends the Year with a Stall
---- IJR Consolidates into Yearend
---- Energy, Materials and Industrials Finish 2017 Strong
---- Oil Finishes at High of the Year
---- Aluminum, Copper and Nickel Finish Strong
---- Three Materials Stocks to Watch (MLM, VMC, NUE)
---- Acuity Bases in Third Quarter
---- CPSI Winds up with Symmetrical Triangle
---- Happy New Year!! ----
SPY Ends the Year with a Stall
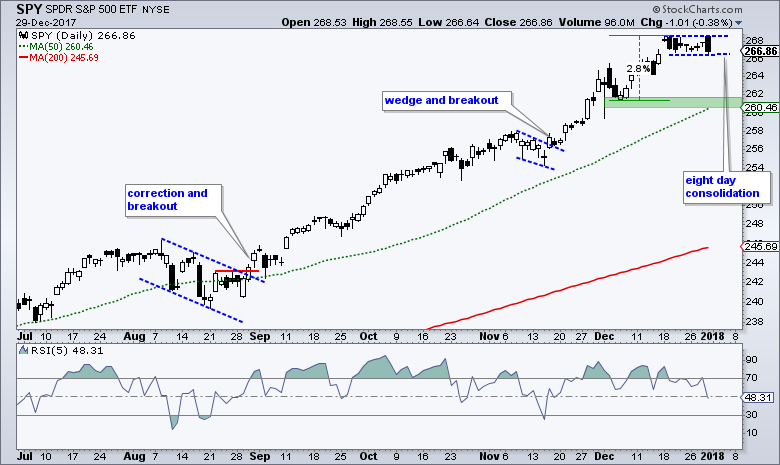
The S&P 500 SPDR (SPY), which is my main barometer for the stock market, remains in a long-term uptrend with a fresh 52-week high in mid December. The 50-day SMA is also above the 200-day SMA and both are rising. This means we should have a bullish bias for the stock market and look for bullish setups. It does not make sense to look for bearish setups in a bull market.
There is currently one bullish setup on the chart and two setups to watch should we get a pullback. First, the tight consolidation over the last eight days formed a bull flag and a break above the December highs would signal a continuation of the prior advance. Second, a dip below 30 in RSI(5) would signal a short-term pullback for a mean-reversion trade. Third, a dip to the rising 50-day SMA would signal a correction within the uptrend and present an opportunity, not a threat.
IJR Consolidates into Yearend
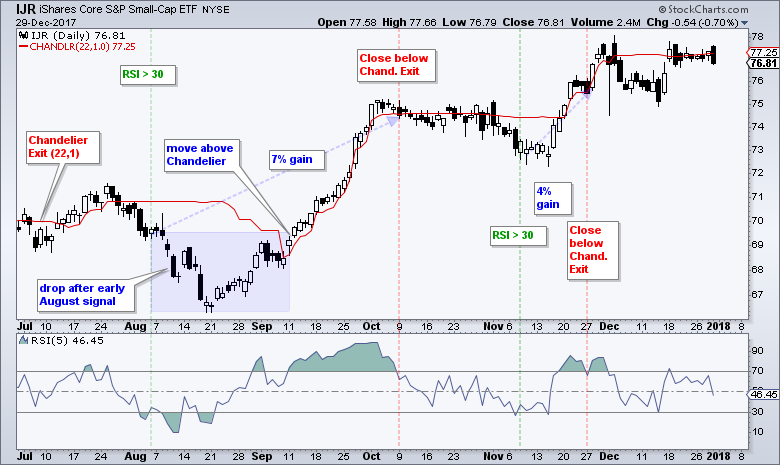
The next chart shows the S&P SmallCap iShares (IJR) with a mean-reversion system using RSI(5) and the Chandelier Exit (22,1). This system buys when RSI(5) moves above 30 and sells on a close below the Chandelier Exit (22,1). Signals are based on closing prices, entry/exit is based on open prices and there are no stops, just a Chandelier Exit. You can read more about this system in the System Trader article from December 2016.
The last two signals are shown on the chart with the green and red vertical lines: early August entry with early October exit and early November entry with late November exit. Notice that the entry usually occurs when price is below the Chandelier Exit (red line). This means an exit is not possible until price closes above the Chandelier Exit. The system almost generated an entry signal when RSI dipped to 30.19 on December 14th. A dip to 29.99 and move back above 30 would have provided an entry signal. Thus, the system is currently on the sidelines and waiting for the next signal.
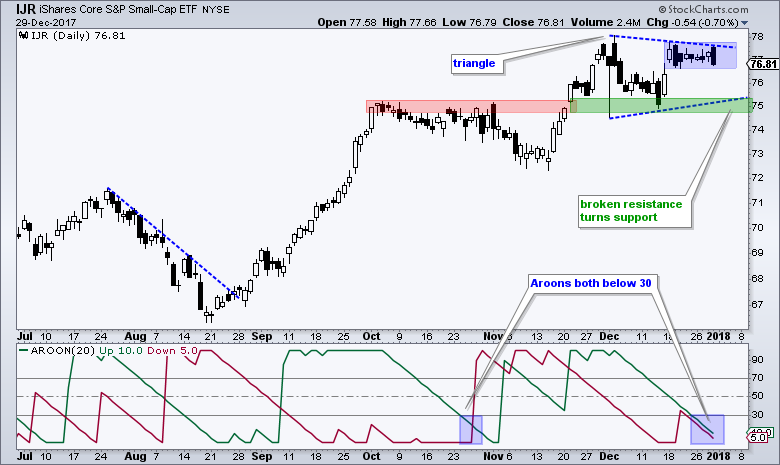
The next chart shows IJR with some annotations and old school analysis. The ETF broke out with a surge in the second half of November and broken resistance turned support as IJR consolidated with a triangle. As with SPY, the ETF stalled the last eight days with a tight trading range (blue shading). A move above the late December highs would trigger a breakout and argue for a continuation of the November advance. The indicator window shows Aroon Up and Aroon Down moving below 30 and this confirms a consolidation on the price chart. This means there is little upside or downside direction over the last twenty days. The first Aroon to break above 50 will trigger the next directional signal.
Energy, Materials and Industrials Finish 2017 Strong
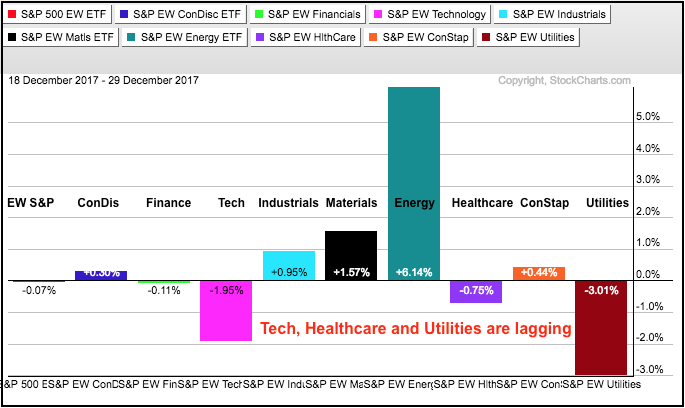
The broader market was pretty flat the last eight trading days, but three sectors stood out with nice gains. The PerfChart below shows performance for the nine equal-weight sectors from December 18th to 29th. The EW S&P 500 ETF (RSP) was down a fraction, but the EW Industrials ETF (RGI), EW Materials ETF (RTM) and EW Energy ETF (RYE) were up and leading. The EW Technology ETF (RYT), EW Healthcare ETF (RYH) and EW Utilities ETF (RYU) were down and lagging.
The next PerfChart shows performance over the past month. Again, we see upside leadership in industrials, materials and energy. The EW Consumer Staples ETF (RHS) was up over 4% in December and also leading. Tech and healthcare were up the least and the utilities sector fell over 4%. These leading and lagging sectors provide us with some themes to keep in mind over the next few months.
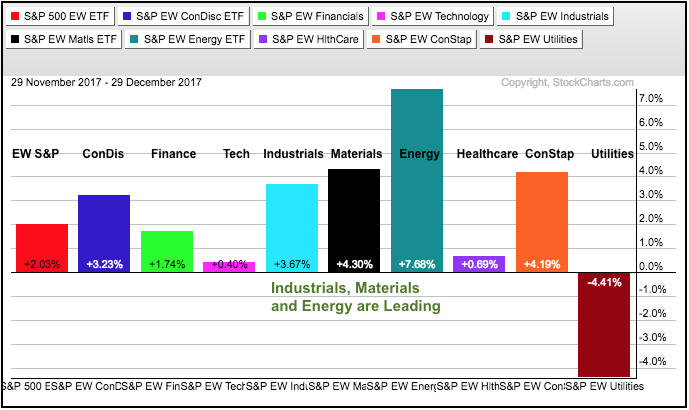
Note that I am using the equal-weight sector ETFs because they better reflect sector performance as a whole. The sector SPDRs, in contrast, are weighted towards a few large-cap stocks and reflect large-cap performance.
Oil Finishes at High of the Year
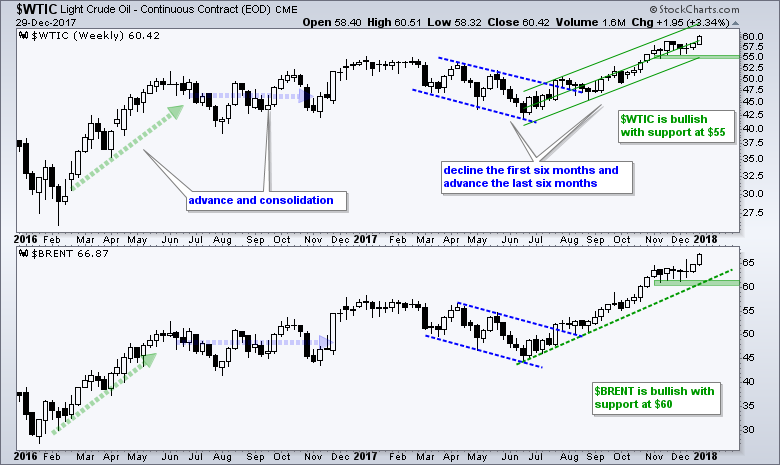
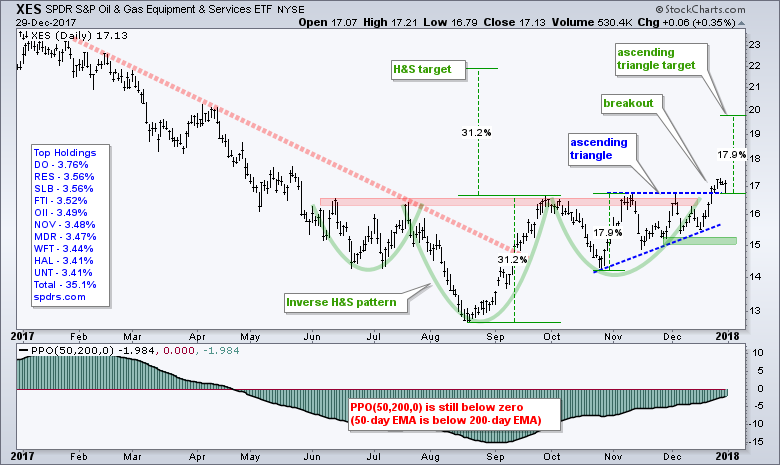
The Light Crude Continuous Contract ($WTIC) and the Brent Crude Continuous Contract ($BRENT) both finished strong with nice gains the last two weeks of the year. Note that the continuous futures contract is not really a "futures contract". Instead, it is several futures contracts stitched together and data adjustments are used to smooth prices. These charts should be used for general trend analysis. The top window shows $WTIC falling the first six months of 2017 and then rising the last six months. A Raff Regression Channel defines the current uptrend with support at $55. The lower window shows $BRENT with support at $60. These uptrends should be positive for energy-related shares and the Oil & Gas Equip & Services SPDR (XES), which broke out in December.
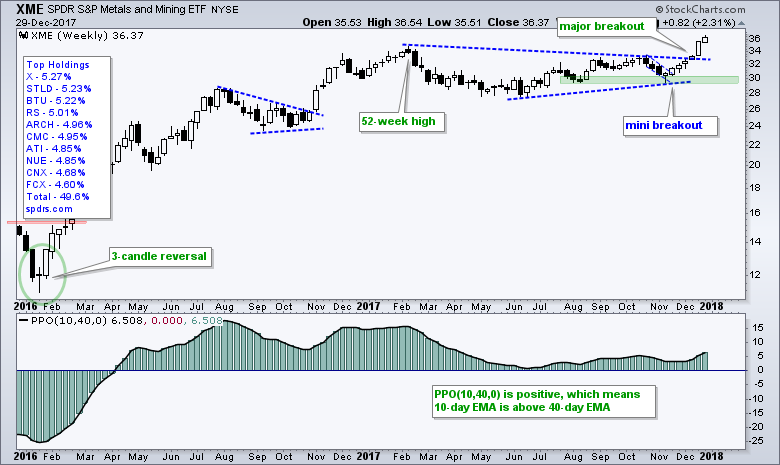
Aluminum, Copper and Nickel Finish Strong
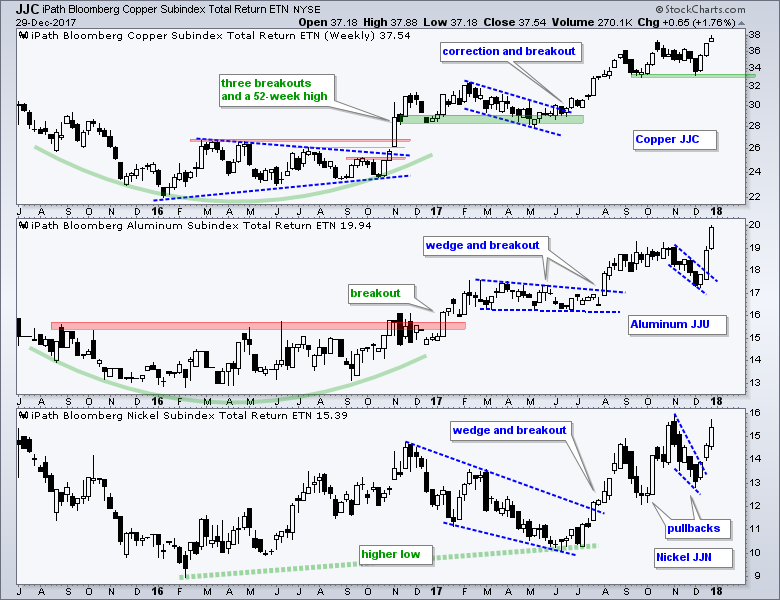
The next chart shows the Copper ETN (JJC), the Aluminum ETN (JJU) and the Nickel ETN (JJN) surging over the last three weeks. Copper and Aluminum hit new highs, while Nickel surged towards its early November high. All three broke out of wedge/channel corrections last summer, corrected from November to mid December and then surged. New highs in copper and aluminum should be positive for the Metals & Mining SPDR (XME) and the Copper Miners ETF (COPX). This could also have wider implications for the Materials and Industrials sectors.
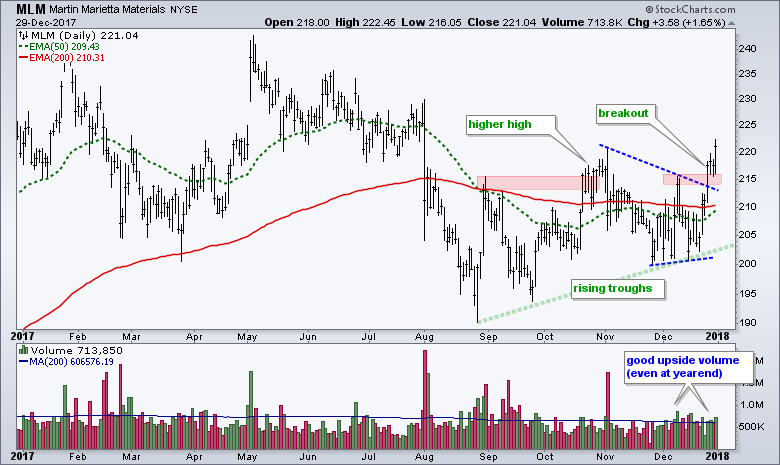
Three Materials Stocks to Watch (MLM, VMC, NUE)
The first three stocks shown are part of the Materials SPDR (XLB). Martin Marietta (MLM) and Vulcan Materials (VMC) are similar companies that provide materials for building construction. Nucor (NUE) is, of course, the big domestic steel producer. The first chart shows MLM with rising troughs since late August, a higher high in late October, a pullback into mid December and a breakout in late December. Notice that upside volume has been strong the last three weeks.
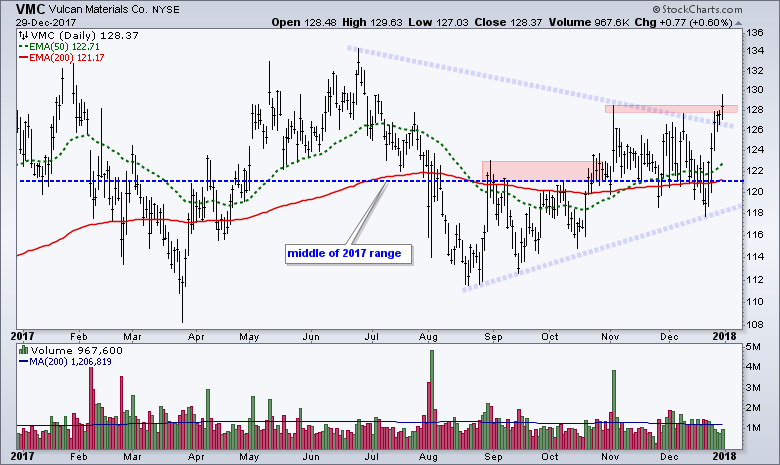
The next chart shows VMC trading flat throughout 2017 with the midpoint of its range at 121. The stock formed a big triangle the second half of the year and appears on the verge of a big breakout with the surge over the last six days.
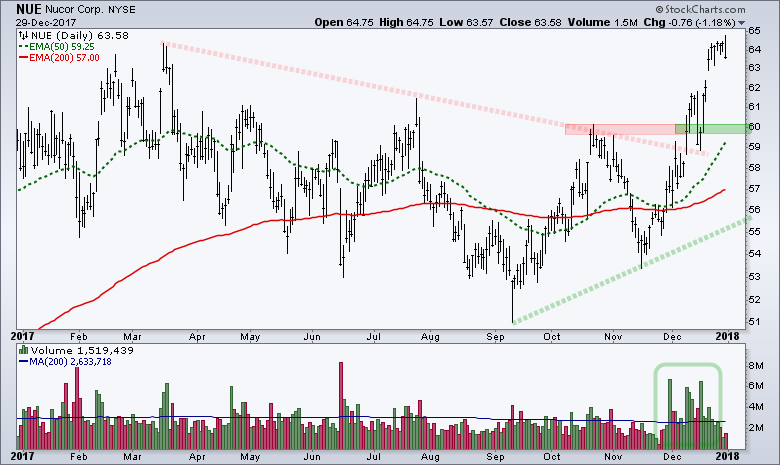
The next chart shows Nucor (NUE) falling from March to September and then rising the last three months. The stock broke out in the 60 area with a high volume surge and broken resistance turns first support. Actually, I would probably just watch the 60-61 area for support on a pullback. Chartists can also consider looking for RSI(10) to dip below 30 to signal a short-term oversold condition. As far as I am concerned, short-term oversold conditions present opportunities during an uptrend.
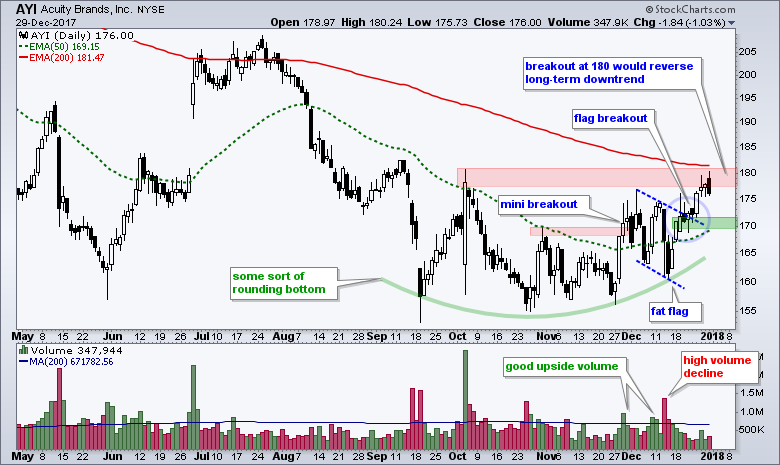
Acuity Bases in Third Quarter
Acuity Brands (AYI) is part of the industrials sector and the S&P 500, but it is really a midcap stock because it has a market capitalization of $7.4 billion. The company provides lighting solutions for commercial and residential buildings. As with the prior three stocks, the stock did not trade well in the first six to nine months of the year and hit a 52-week low in mid September. There are, however, signs of base building the last three months as the stock established support in the 155-160 area with a few bounces. More importantly, the stock surged in late November for a mini breakout, pulled back into mid December with a fat flag and broke out of the flag with an advance the last two weeks.
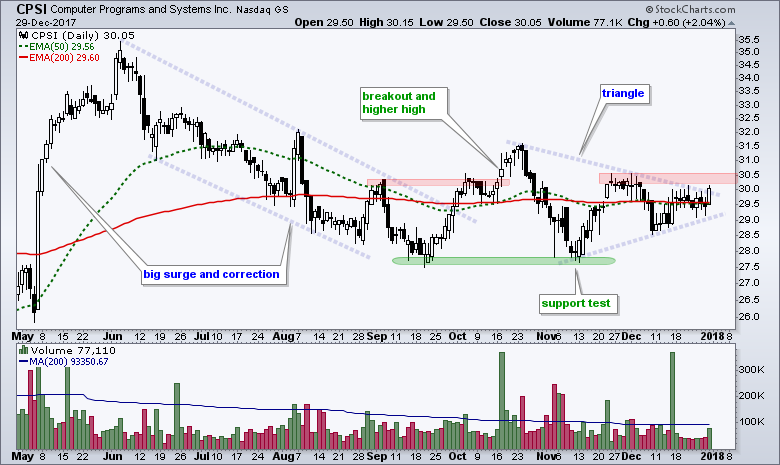
CPSI Winds up with Symmetrical Triangle
Computer Programs & Systems (CPSI) is a small-cap stock that provides IT solutions to the healthcare industry. The stock surged in May-June, corrected into September and then appeared to end this correction with a breakout in October. CPSI then returned to the September low for a support test and then consolidated. A symmetrical triangle is taking shape now and a breakout at 30.5 would be bullish. The stock finished the year strong with a 2% gain on the last day of trading and a small uptick in volume. Failure to break out and a close below 28.5 would be bearish.
Happy New Year!!
2017 was a great year for stocks with lots of bullish strategies working. Mean-reversion, momentum and trend following systems all finished with nice gains for the year. I have no idea how 2018 will end up, but I do know we are starting the year in a bull market and this means bullish strategies are the order of the day. I don't believe in annual forecast and prefer to take it one week at a time by re-evaluating as the charts evolve. I wish everyone health, happiness and prosperity in 2018 (in that order!).

******************************************************
ETF Master ChartPack - 300+ ETFs organized in a Master ChartList and in individual groups.
Follow me on Twitter @arthurhill - Keep up with my 140 character commentaries.
****************************************
Thanks for tuning in and have a good day!
--Arthur Hill CMT
Plan your Trade and Trade your Plan
*****************************************


