- Raff Regression Channels and Steep Uptrends.
- Chandelier Exit Holds Entire Uptrend.
- SPY Nears Flag Target.
- Buy the Dip in Bull Markets.
Raff Regression Channels and Steep Uptrends
There is no such thing as the perfect indicator or the perfect settings, but I would like to show a method to quantify the short-term uptrend and a indicator to set a trailing stop. I will also show how the calculate flag targets and preview tomorrow's System Trader article. These are just some techniques to keep in mind and test on your charts.
I often use the Raff Regression Channel to define steep advances and mark the make-or-break level. There are three lines and the middle line is a linear regression. The outer lines are equidistant and their width is based on the furthest high or low from the linear regression. I typically draw the channel from the closing low of the uptrend to the closing high. Note that the channel does not extend until a new high is recorded.
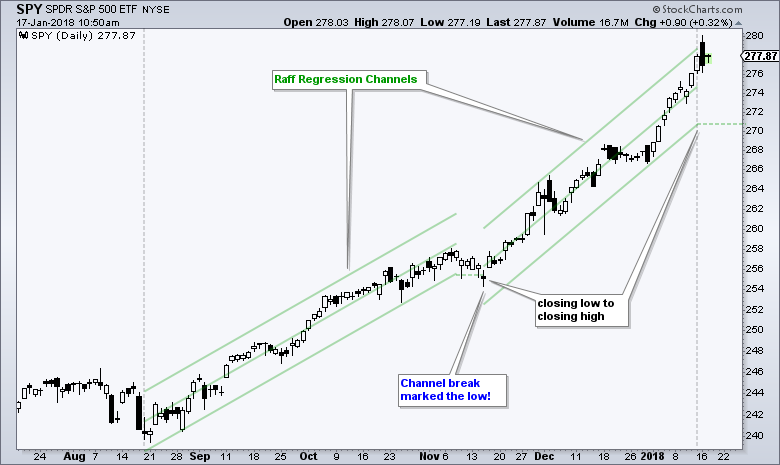
The chart above shows SPY with two Raff Regression Channels: 18-August to 8-November and 15-November to 12-January. The current channel stops on Friday and I will extend the it if SPY closes above the 12-January close. The lower line of the Raff Regression Channel marks a make-or-break level for this uptrend (~270.6).
Notice that SPY closed below the lower channel trend line in mid November and this close marked an important low as the ETF gapped up the very next day. It is clearly not a fool proof make-or-break level.
Chandelier Exit Holds Entire Uptrend
The next indicator is the Chandelier Exit (22,3). It is really not an indicator, but rather a tool traders use to set trailing stops. The Chandelier Exit (22,3) is set three 22-day ATR values below the 22-day high. ATR stands for Average True Range.
The chart above shows 22-day Price Channels in gray to mark the 22-day high (gray) at 280.09, the Chandelier Exit (red) at 275.18 and 22-day ATR at 1.637 in the indicator window. The calculations are shown on the chart.
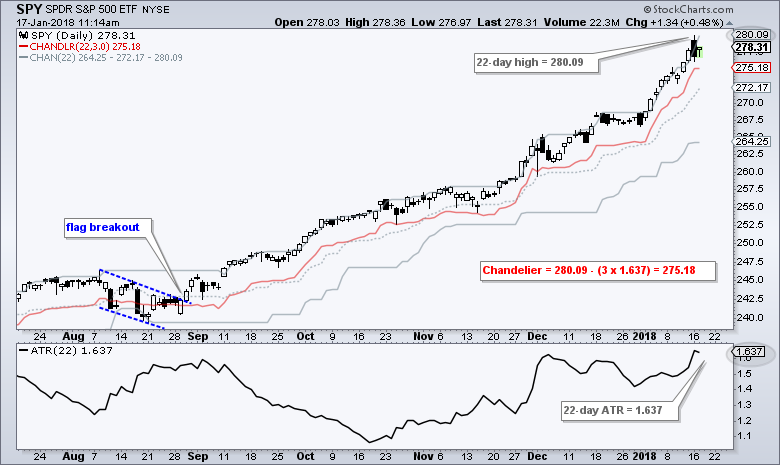
The Chandelier Exit moves when the 22-day high changes and/or the 22-day ATR changes. Thus, the Chandelier Exit would rise if SPY moved above the recent high. The exit trails higher as prices rise.
Notice how SPY has been above the Chandelier Exit (closing basis) since August 25th. Chartist trading the flag breakout and using the Chandelier Exit for a stop would still be long. This trade is an exception and not all trades look this good.
SPY Nears Flag Target
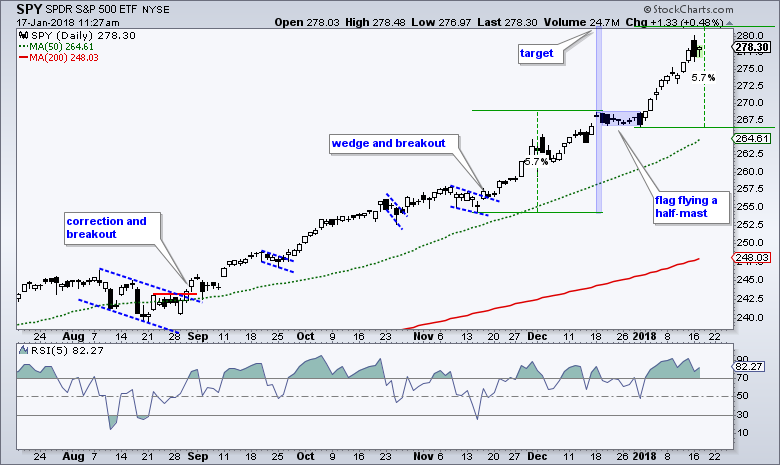
Flag traders should note that SPY is nearing its flag breakout target in the 281 area. Traditional technical analysis teaches us that a flag flies at half-mast and the first advance was around 5.7%. We can add this amount to the flag low for a rough target. My backtesting shows that results often improve when traders use profit targets and exit before an actual reversal. Experience has also revealed that greedy traders join the needy.
Buy the Dips in Bull Markets
But enough of subjective channels, perfect trailing stops and flag targets....we are in a bull market, the long-term trend is up and the short-term trend is up. We finally saw some selling this year with Tuesday's intraday reversal, but it is clearly not enough to affect even the short-term uptrend. A bit of selling can be expected after a 4+ percent advance in two weeks.
Even if SPY closes below 275 and triggers the Chandelier Exit, the next pullback is likely to create a mean-reversion opportunity. I will be watching my favorite indicator, RSI, for a dip below 30 and a bullish setup. In fact, I will update the short-term mean-reversion strategy tomorrow in this year's first System Trader article. I will test a portfolio using SPY, QQQ, MDY, IJR, IWM and DIA. This idea was first tested in an article in March 2017.
Plan Your Trade and Trade Your Plan.
- Arthur Hill, CMT
Senior Technical Analyst, StockCharts.com
Book: Define the Trend and Trade the Trend
Twitter: Follow @ArthurHill


