- SPY and QQQ Lead the 2018 Surge.
- Moving from Corrective Mode to Trend Mode.
- Déjà vu for HRB and ACH.
- Playing the Short Correction (NEWM, LYV, YUM).
- AXL Breaks Out of Big Correction.
- LPX Makes Good on Third Bounce.
- AGCO Forms Classic Bullish Continuation Pattern.
SPY and QQQ Lead the 2018 Surge
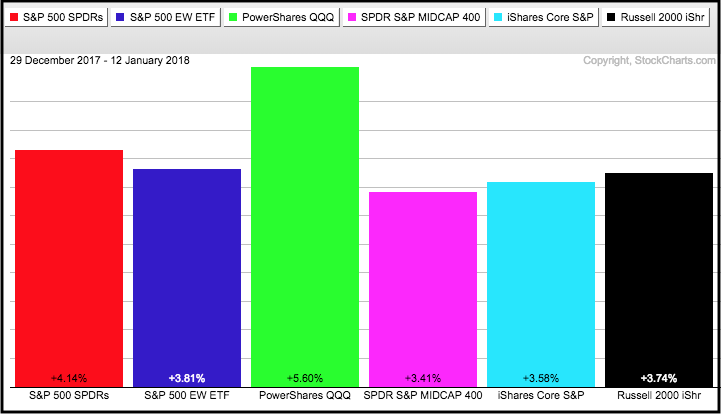
Stocks continued their January romp with further gains on Thursday and Friday. The S&P 500 SPDR (SPY), which is up eight of the last nine days, moved to new highs again last week. The ETF is up 4.14% year-to-date and the second best performing major index ETF. Note that QQQ is up 5.6% year-to-date, while the Russell 2000 iShares (IWM) is up 3.58%. The PerfChart below shows year-to-date gains for six major index ETFs. Note that all six hit fresh 52-week highs on Friday.
Moving from Corrective Mode to Trend Mode
These major index ETFs are currently in "trend mode", which means both the short-term and long-term trends are up. In contrast, these ETFs were in "corrective mode" at yearend. SPY went through a mild correction in late December with an eight day stall. This was clearly the pause that refreshes as the ETF continued on its merry way January 2nd. Note that the bull flag in SPY and bullish triangle in IJR were featured on Art's Charts on January 2nd.
We are currently in the middle of earnings season and this means most stocks will issue reports in the coming weeks. With the major index ETFs in "trend mode", I would expect more bullish resolutions than bearish resolutions. However, earnings season can be volatile and misses will be punished.
As a pullback player, I am looking for stocks that are in corrective mode or emerging from corrective mode. The long-term trends are up for these stocks and I am expecting a continuation of these bigger uptrends.
Corrections typically take the form of falling wedges, bull flags and triangles. The following stock setups sport corrective patterns and the earnings date is shown on the chart. Note that I filtered out stocks that report within the next two weeks. I get my earnings information from IBD (investors.com), but you may want to double-check the reporting date.
Déjà vu for HRB and ACH
I first featured H&R Block on December 19th with a little wedge breakout and followed up again on December 22nd as it fell back below 27. The stock remains in a long-term uptrend and the big wedge breakout is still the dominant pattern. Shorter term, another wedge is evolving and the stock is firming near the 61.8% retracement.
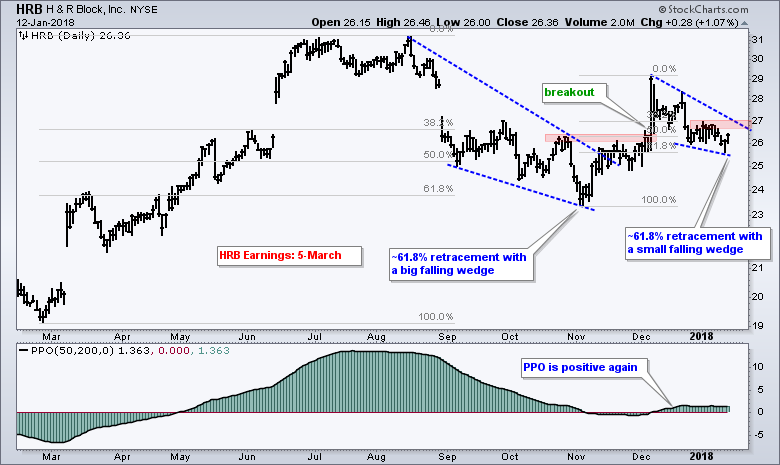
This is a classic example of the fractal nature of technical analysis. Patterns and setups can be applied to any timeframe. The falling wedge is a corrective pattern and a 38 to 62 percent retracement is typical for corrections. HRB reversed near the 61.8% retracement with a surge from early November to mid December. Short-term, the stock is at its moment-of-truth as it firms near the 61.8% retracement with a smaller wedge. A breakout at 27 would end the pullback and be bullish. A close below 25 would warrant a re-evaluation.
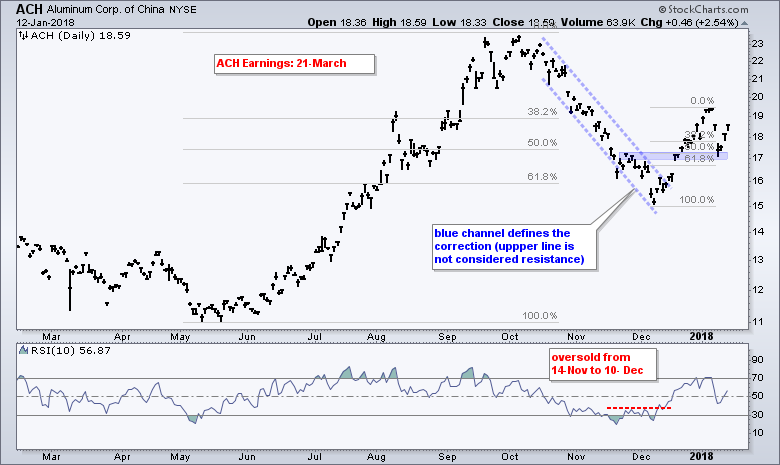
The next chart shows China Aluminum (ACH) with a big surge and a big correction, and then a smaller surge and smaller correction. The big correction overshot the 61.8% retracement, but it still looks like a correction after a sharp advance. More importantly, the December surge ended this correction and triggered a breakout near 17. The stock then retraced around 61.8% with a throwback to 17 and broken resistance turned into support with a bounce the last three days. It looks like the bigger uptrend is resuming. A close below 17 would warrant a re-evaluation.
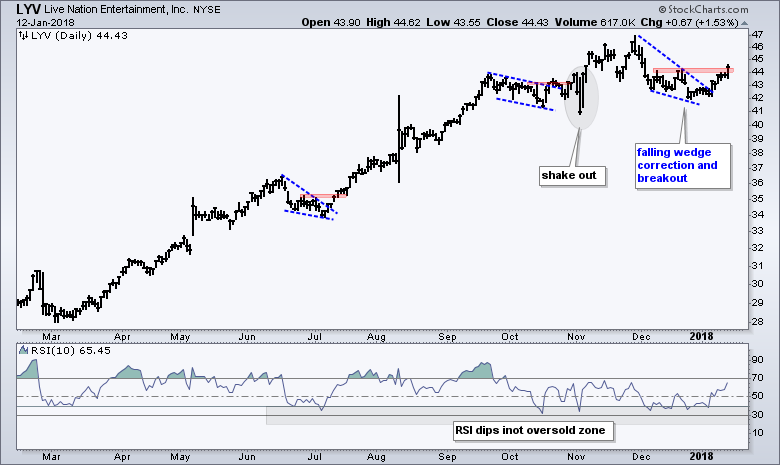
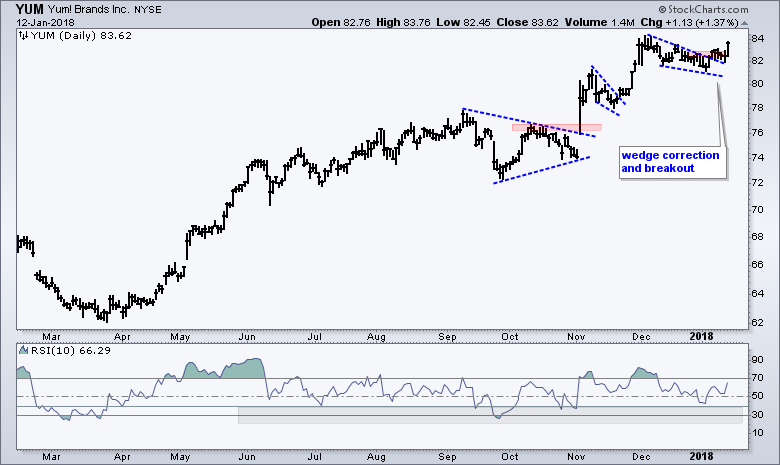
Playing the Short Correction (NEWM, LYV, YUM)
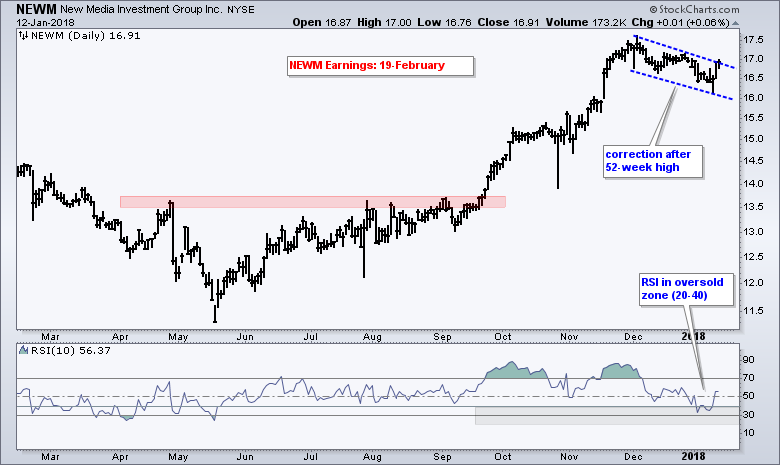
The next three stocks show relative short pullbacks within clear uptrends. First, all three recorded 52-week highs within the last two months and their 50-day EMAs are above their 200-day EMAs. These pullbacks represent short corrections within the bigger uptrend. Live Nation (LYV) and Yum Brands (YUM) broke out last week, while New Media Investment Group (NEWM) looks poised to break out. The recent lows can be used to set re-evaluation levels.
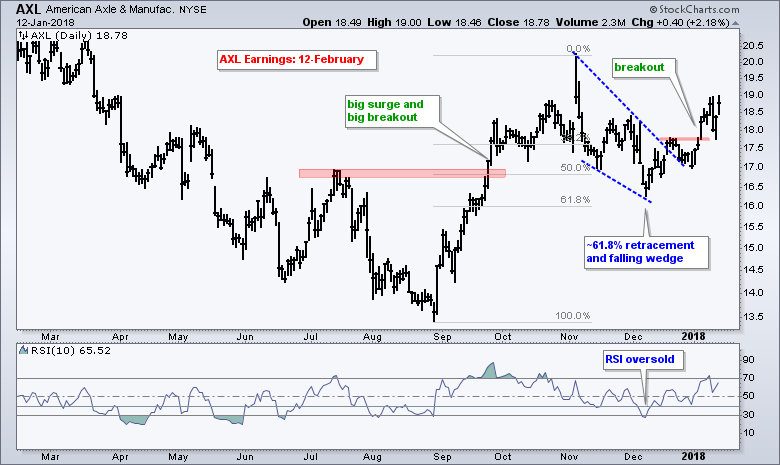
AXL Breaks Out of Big Wedge
American Axel (AXL) is part of the auto/truck original equipment industry group and auto stocks have been strong. AXL broke out of a wedge pattern with a surge above 18 and this breakout is in play (bullish) as long as 17.50 holds.
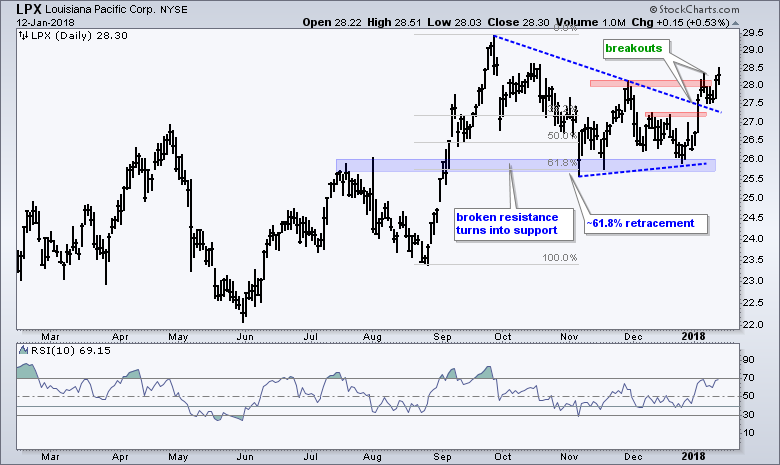
LPX Makes Good on Third Bounce
Louisiana Pacific (LPX) manufactures and sells building products for the housing industry, and housing stocks are red hot right now. On the price chart, the stock surged in August-September and then retraced around 61.8% of that surge with a return to broken resistance, which turns first support. LPX bounced off support three times and broke out with a big move this year.
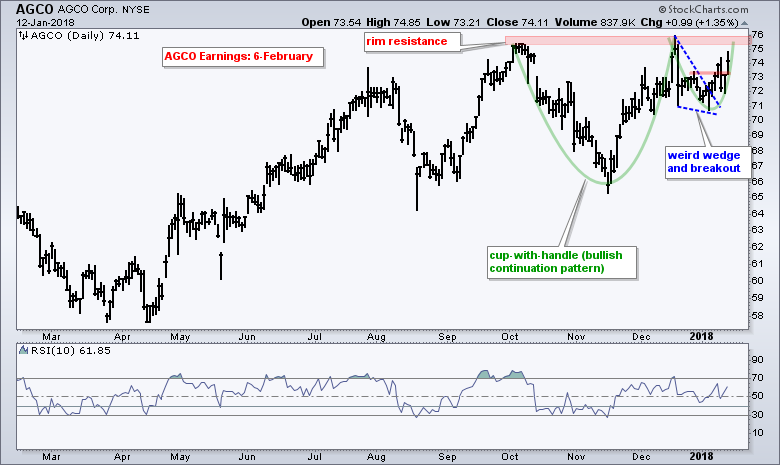
AGCO Forms Classic Bullish Continuation Pattern
AGCO is part of the farm equipment and machinery group, and Deere (DE) just hit a 52-week high. The stock sports a bullish cup-with-handle pattern and broke out of a wedge pattern last week. This wedge breakout argues for a break above rim resistance.
Plan Your Trade and Trade Your Plan.
- Arthur Hill, CMT
Senior Technical Analyst, StockCharts.com
Book: Define the Trend and Trade the Trend
Twitter: Follow @ArthurHill


