- Setting the Market Regime and Ground Rules.
- Sample Signals for SPY and IJR.
- Backtest Results.
- I Know What You are Thinking.
- Conclusions.

Mean-reversion trading systems are designed to buy the dip during bull markets. The assumption is that the trend is the major force at work and prices will revert to that trend after a dip. Today, I will review the RSI mean-reversion trading system, offer a tweak and expand the trading universe to six major index ETFs.
I have been writing about mean-reversion systems since June 2016 and they continue to perform well. I started by testing individual ETFs and then moved to a portfolio approach to spread the risk. I also tested various exit strategies and stop-losses. The links below show four articles for reference.
- A Portfolio Approach to Mean-Reversion Trading
- A Mean-Reversion System with the Chandelier Exit
- Mean Reversion: Catch the Knife or Wait for the Bounce?
- Mean Reversion with the Sector SPDRs
Setting the Market Regime and Ground Rules
As always, we need to establish the ground rules before looking at the results. The first and most important rule is to establish the broad market environment. As far as I am concerned, we are in a bull market when the 50-day SMA is above the 200-day SMA for the S&P 500. I want to be looking for long setups during a bull market and on the sidelines during a bear market.
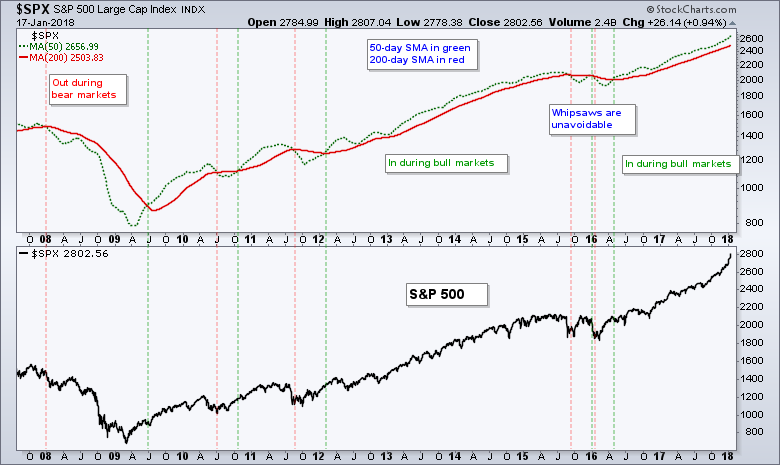
Long time readers may notice that I am using simple moving averages instead of the usual exponential moving averages. There is not that big of a difference between the two, but the SMAs tested a little better than the EMAs for this system.
- The portfolio consists of six ETFs: the S&P 500 SPDR (SPY), the Nasdaq 100 ETF (QQQ), the S&P MidCap SPDR (MDY), the S&P SmallCap iShares (IJR), the Russell 2000 iShares (IWM) and the Dow SPDR (DIA).
- The testing period runs from 1/1/2001 to 1/1/2018 because it is the first full year that all six ETFs were trading. IJR and IWM started trading in May and June 2000, respectively.
- The starting portfolio is $100,000 and the commissions are $5 per trade.
- There are a maximum of six positions and each position is equally weighted (~16.67%).
- The signals are generated on the close and the entry-exit prices are based on the next open.
- The backtesting is based on dividend-adjusted data, which means the dividends were added back into the price data for a total return picture.
Sample Signals for SPY and IJR
A buy signal triggers when RSI moves above 30, which means it was below 30 and oversold prior to the signal. The dip below 30 suggests that the ETF corrected and the subsequent move above 30 indicates that the correction is ending.
A sell signal triggers when the closing price crosses below the Chandelier Exit (22,1). Many buy signals start when price is below the Chandelier Exit. This means prices must first move above the Chandelier Exit for a sell signal to be possible.
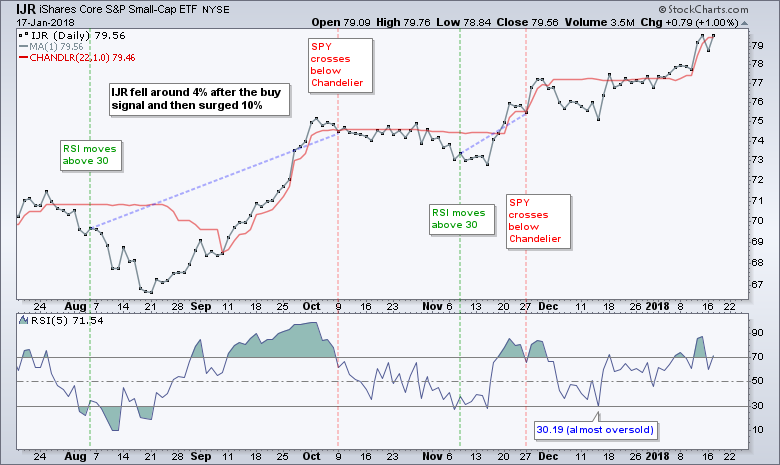
The IJR chart shows the ETF falling around 4% after the buy signal in early August. The ETF then surged some 10% for the best trade of the year. Keep in mind that there is no stop-loss in this system. The exit is based on the Chandelier Exit only. I explained the Chandelier Exit in this article.
I added another filter to require a minimum holding period of five trading days. This tweak is to prevent whipsaws right after a buy signal triggers.
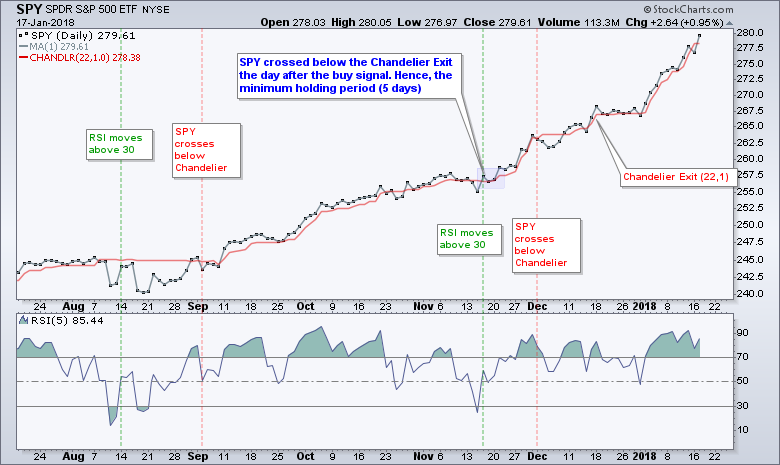
The SPY chart above shows a buy signal on November 16th, an entry on the November 17th open and a sell signal on the close later that day. The 5-day minimum holding period is designed to reduce whipsaws that occur in a few days.
Backtest Results
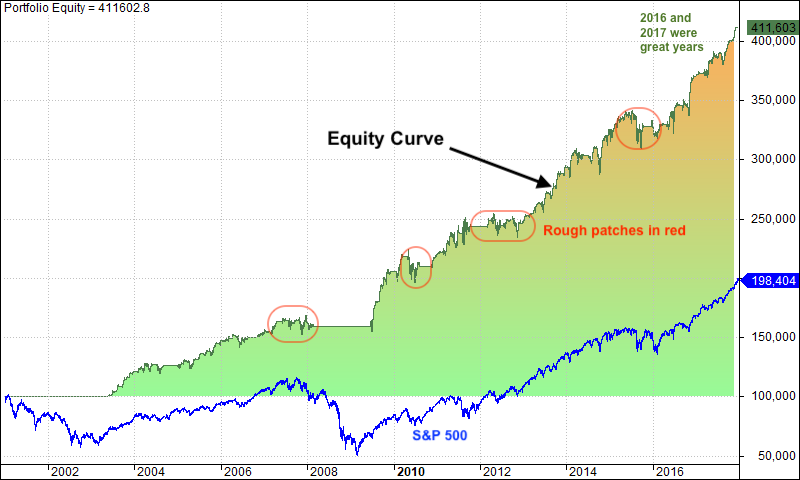
The table below shows the results over the last sixteen years and 463 trades. First, the Compound Annual Return is 8.68% and the average drawdown is 9.28%. The system was exposed just 36% of the time and this produced a Risk-adjusted Return of 23.82%. Money could have been active elsewhere when not trading this system.
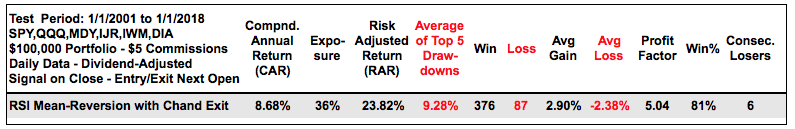
The Average Gain (2.9%) was greater than the Average Loss (2.38%) and a whopping 81% of trades were winners. The profit factor, which is the gross profits divided by the gross losses, was 5.04. Anything above 2 is good so this is a very strong number. The maximum consecutive losses topped out at 6 and dry spells were fairly limited.
The next chart shows the equity curve for this system. Even with just 36% exposure, equity grew at a rapid clip because of the high win rate.
I Know What You are Thinking!
This system would perform better if the Chandelier Exit (22,1) were wider, such as a Chandelier Exit (22,3). I tested Chandelier (22,3) and Chandelier (22,2) as well. These wider exits resulted in lower Compound Annual Returns and higher Drawdowns. This is a system designed for base hits, not home runs and tighter stops appear to work better.
A simple trailing stop-loss would work wonders for this system. It certainly seems so based on the last six months, but trailing stop-losses hurt performance when looking at 16 years of data and over 450 trades.
Keep in mind that the last six to twelve months are not necessarily representative of the last 16 years. We saw bear markets in 2001-2002 and 2007-2008. There were volatile periods in 2011 and 2015. And, of course, we have seen some strong uptrends over the last twelve months.
There is also the issue of unintended consequences. A tweak may improve performance for a few signals, but it may have detrimental effects for dozens of trades and negatively affect the system as a whole. I am focused on the system, not just a few trades.
Conclusions
The system works as is, but you are welcome to make tweaks, which may or may not improve performance. Also note that the results are based on taking every trade and sticking with the system, which is hard in real life. And finally, keep in mind that past results do not guarantee future results.
Even though it is a short-term mean-reversion system, this type of strategy could also be used to build a position in the broader market. For example, one could scale-in during pullbacks and exit the market when the 50-day SMA for the S&P 500 crosses below the 200-day SMA.
Consulting, Software and Data
Cesar Alvarez of AlvarezQuantTrading.com provides feedback my code and system development. Cesar has a great blog and provides consulting services for system development (click here). I used Amibroker to test the code and Premium Data from Norgate. Just like StockCharts, the data is adjusted for dividends to reflect the total return.
Plan Your Trade and Trade Your Plan.
- Arthur Hill, CMT
Senior Technical Analyst, StockCharts.com
Book: Define the Trend and Trade the Trend
Twitter: Follow @ArthurHill


