
---- S&P MidCap SPDR Catches a Bid
---- Finance SPDR Springs to Life
---- Citigroup and Morgan Stanley End Pullbacks
---- US Bancorp Leads Regional Bank SPDR
---- Broker-Dealer iShares Breaks Out of Flag ----
S&P MidCap SPDR Catches a Bid ----
Large-caps are leading so far this year, but mid-caps are not far behind. As of 11AM ET, The S&P 500 SPDR (SPY) was up around 1.9% year-to-date, while the S&P MidCap SPDR (MDY) was up around 1.6% and the S&P SmallCap iShares (IJR) was around .9% higher. In addition, note that MDY and SPY are hitting new highs this week, and IJR is still below its early December high. Once again, small-caps are struggling, but relative weakness in small-caps is not enough to derail the bull market. The chart below shows MDY breaking out of a pennant with a gap on December 18th and hitting a new high above 350 today.
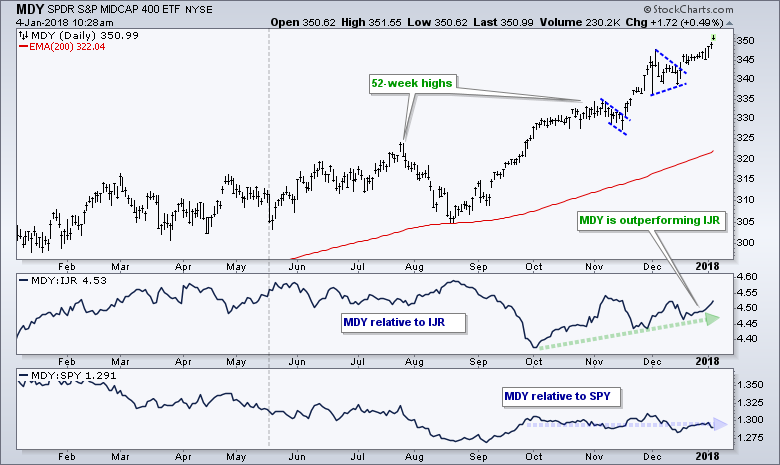
The first indicator window shows the MDY:IJR ratio rising since early October. MDY (numerator) is outperforming when this ratio rises and underperforming when this ratio falls. The second window shows the MDY:SPY ratio moving sideways since early October (performing in line with SPY).
Financials SPDR Springs to Life
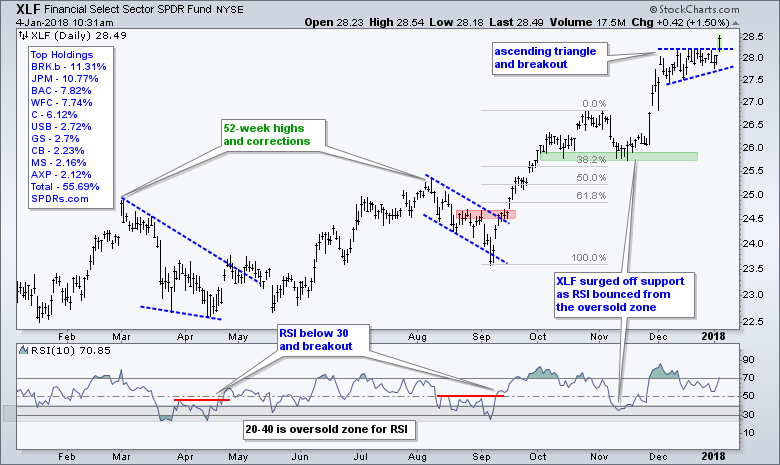
The Financials SPDR (XLF) sprang to life over the last two days as the 10-yr T-Yield ($TNX) moved back above 2.45% this week. An uptrend in the 10-yr T-Yield is an important theme to consider as we head into 2018. As noted in my commentary on December 20th, rising yields could benefit banks and brokers, but weigh on utilities and REITs. The chart below shows the Financials SPDR (XLF) breaking out of a small ascending triangle with a gap-surge today. The ETF also hit a fresh 52-week high.
Citigroup and Morgan Stanley End Pullbacks
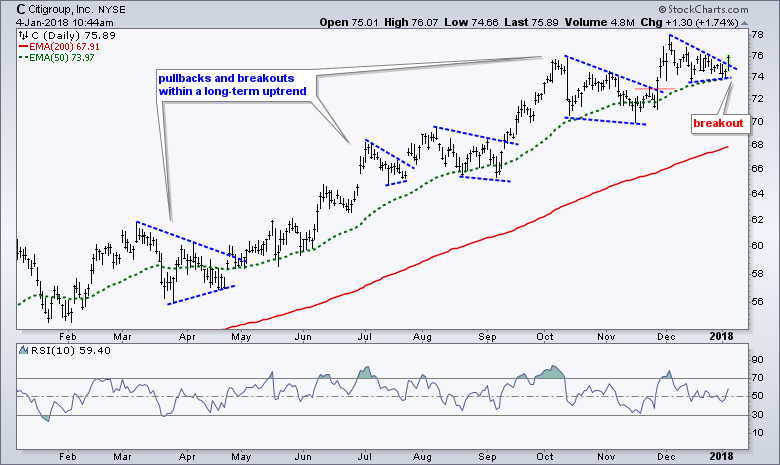
The next chart shows Citigroup (C) bouncing off the 50-day EMA and breaking out of a triangle consolidation. The long-term trend is up and this breakout opens the door to new highs in the coming weeks.
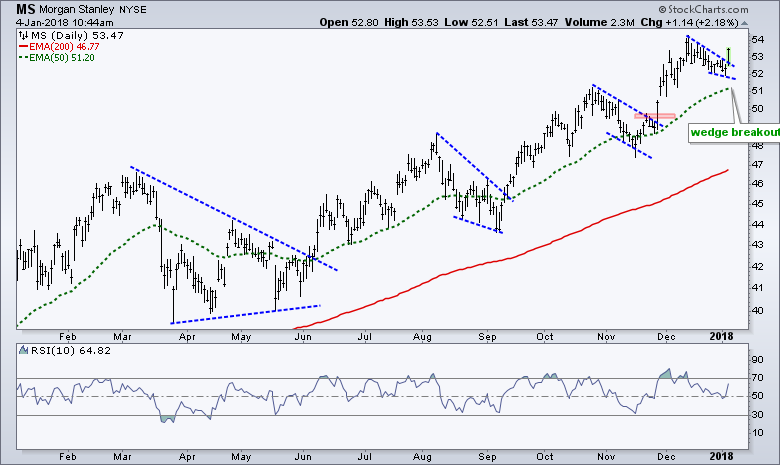
The next chart shows Morgan Stanley (MS) correcting with a small wedge into early January and breaking out with a surge today.
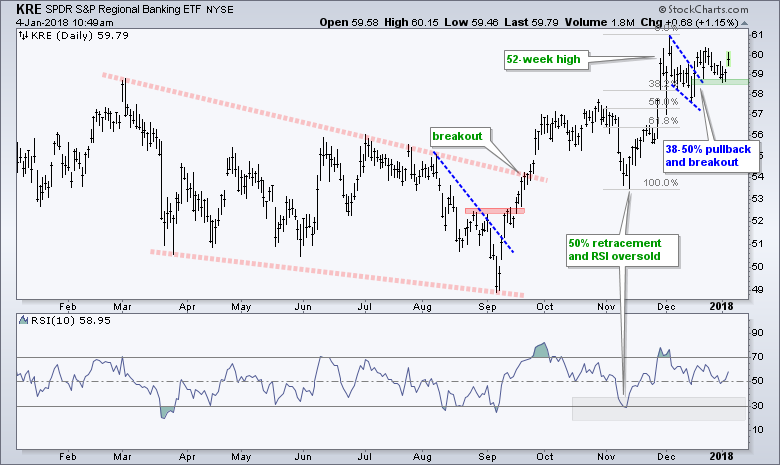
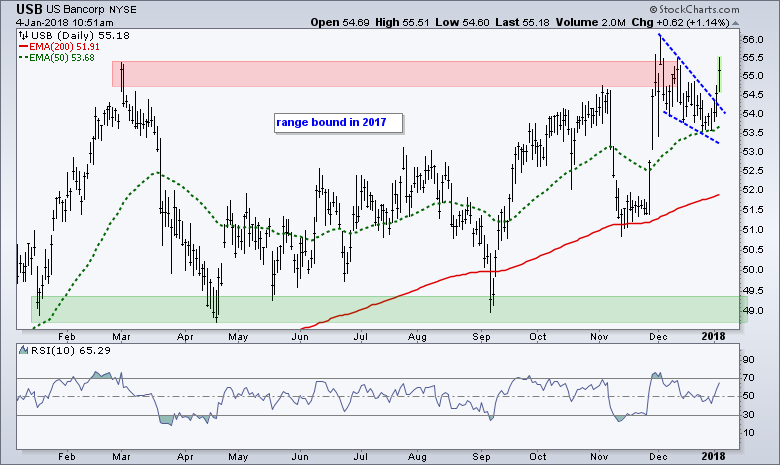
US Bancorp Leads Regional Bank SPDR
The next chart shows the Regional Bank SPDR (KRE) with a wedge breakout on December 19th and then a little throwback to the 58.5 area at yearend. It looks like this throwback has ended as the stock surged today with a gap. The green zone marks the first support area to watch. A close below 58.4 would negate this breakout.
The next chart shows US Bancorp (USB) breaking out of a falling wedge with a surge the last two days. USB was largely range bound in 2017 with support in the 49 area and resistance in the 55.5 area. The stock is making a bid this week to break free from this range.
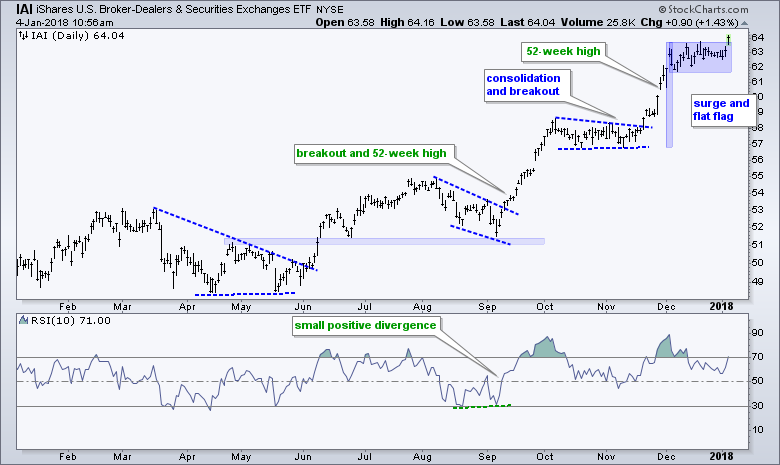
Broker-Dealer iShares Breaks Out of Flag
The Broker-Dealer iShares (IAI) surged from mid November to early December and then stalled for four weeks. The lines may not match up perfect, but the pattern sure resembles a flag and today's breakout argues for a continuation of the long-term uptrend.
ETF Master ChartPack
300+ ETFs organized in a Master ChartList and in individual groups.
Follow me on Twitter @arthurhill
Keep up with my 140 character commentaries.
Thanks for tuning in and have a good day!
--Arthur Hill CMT
Plan your Trade and Trade your Plan


