 |
---- Strong Pockets Outweigh Weak Pockets |
----- Art's Charts ChartList (updated January 5th) -----
Strong Pockets Outweigh Weak Pockets
The stock market is never 100% bullish with all stocks participating in an uptrend. There are always some holdouts and pockets of weakness, but the broader market can continue higher as long as the pockets of strength are greater than the pockets of weakness.
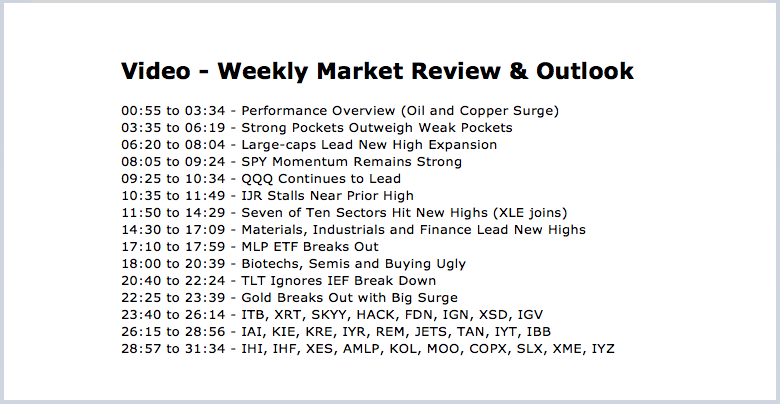
Since mid September, the percentage of S&P Mid-Cap 400 stocks above the 200-day EMA has been above 60%, while the percentage of S&P 500 stocks above the 200-day EMA has been above 70%. This metric for the S&P Small-Cap 600 has been mostly above 60% since mid September. There was a brief dip below 60% in mid November.
Currently, the percentage of stocks above the 200-day EMA is as following: S&P 500 (82%), S&P Mid-Cap 400 (78%) and S&P Small-Cap 600 (72%). Even though there are some pockets of weakness, these pockets are far smaller than pockets of strength. In other words, 18 to 28 percent of stocks in these indices are below their 200-day EMAs. This is not enough to derail the bull market and clearly not enough to sink it.
I also use these indicators for broad market timing. They turn bullish with a move above 60% because this shows enough critical mass to support a bull market. Conversely, they turn bearish with a move below 40% because this is enough to weakness to warrant a bear market. The S&P 500 and S&P Mid-Cap 400 have been bullish since March 2016 and the S&P Small-Cap 600 has been bullish since April 2016. As you can see from the August dips, these indicators can weather a correction within an uptrend.
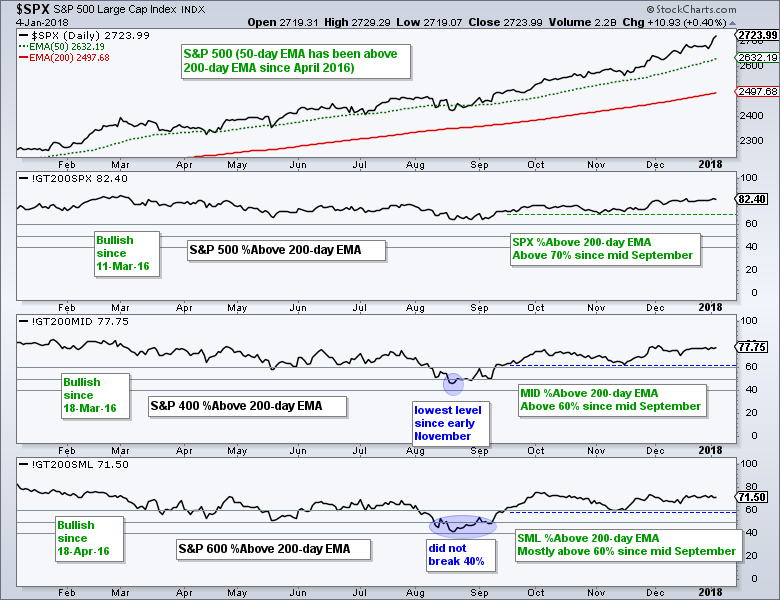
Large-caps Lead New High Expansion
Once again, large-caps are leading the new high list as over 20% of stocks in the S&P 500 recorded fresh 52-week highs on Thursday. The chart below shows new highs and new lows for the S&P 500, S&P Mid-Cap 400, S&P Small-Cap 600 and Nasdaq 100. The blue horizontal lines are at the 10% level (50 for SPX, 40 for MID and 60 for SML).
There were 108 new highs in the S&P 500, 49 in the S&P Mid-Cap 400 (12.2%), 28 in the S&P Small-Cap 600 (4.7%) and 19 in the Nasdaq 100 (19%). Large-caps and large-cap techs are the clear leaders right now. Keep in mind that new highs are bullish because stocks hitting new highs are in uptrends, strong uptrends. These stocks are also the market leaders.
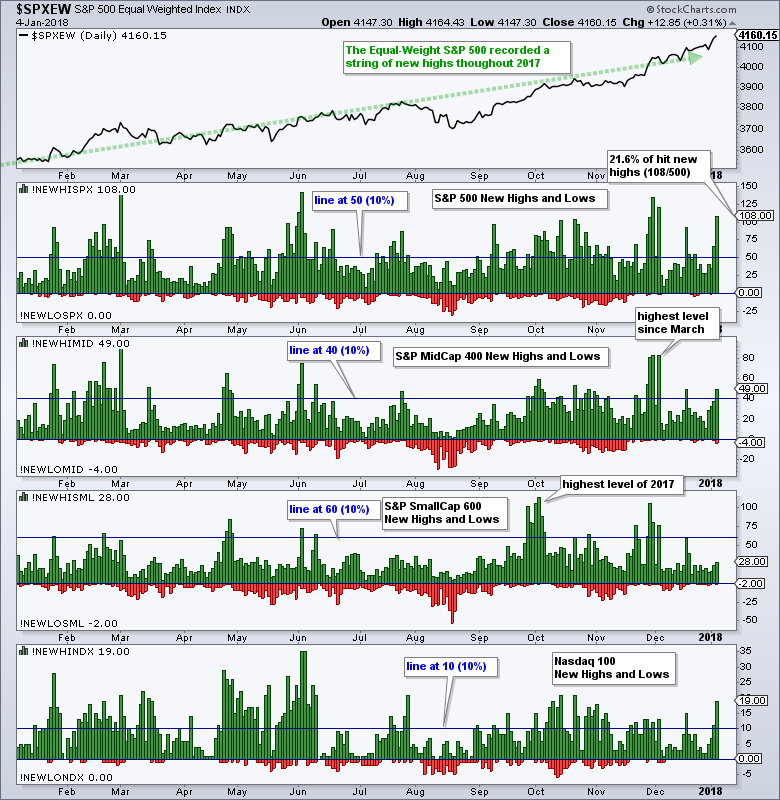
SPY Momentum Remains Strong
The chart below was first shown in the Weekly Market Review & Outlook on December 15th and then in ChartWatchers on December 16th. The assumption here is that overbought readings (RSI>70) are a sign of strength and to be expected in an uptrend. The first green zone shows RSI moving above 70 on 25-Nov-2016 and then staying above 50 for 79 days.
The second green zone shows RSI moving above 70 on 2-Oct-17 and remaining above 70 for 66 days and counting. In fact, notice that RSI has not been below 60 since November 20th. The indicator has simply hovered in the 70 area for six weeks now. Talk about strong momentum!
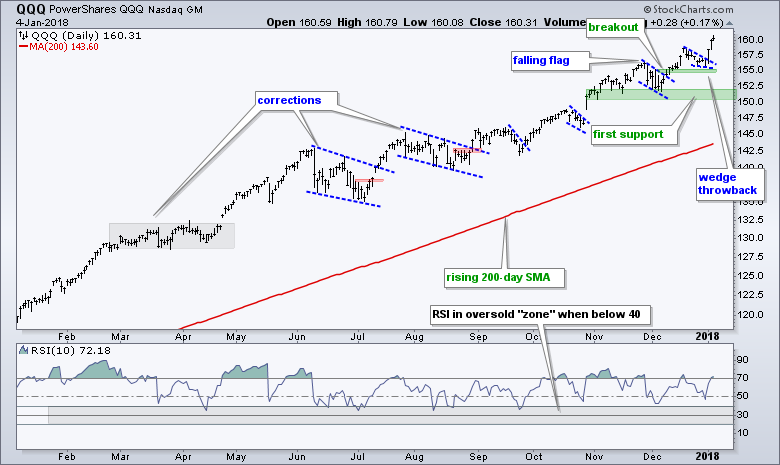
QQQ Continues to Lead
QQQ trended higher throughout 2017 and surged to fresh new highs this week. There were corrections and pullbacks along the way, but these did not derail the uptrend because corrections are a normal part of the process. The three corrections from February to August lasted four to six weeks. The pullbacks since September have been shorter (six to eight days). Most recently, QQQ broke out of a bull flag in mid December and broke out of a falling wedge on Tuesday. There is no weakness here and clearly no rotation out of large-cap techs.
IJR Stalls Near Prior High
While QQQ, SPY, RSP and MDY moved to new highs this week, the S&P SmallCap iShares (IJR) remained stuck in a consolidation near the late November highs. Despite this non-confirmation, the bigger trend is clearly up and I remain bullish on IJR overall. The flag breakout from 18-Dec is holding and remains bullish. Chartists can re-evaluate on a close below 76. More recently, a pennant formed over the last two weeks and a breakout at 78 would open the door to new highs.
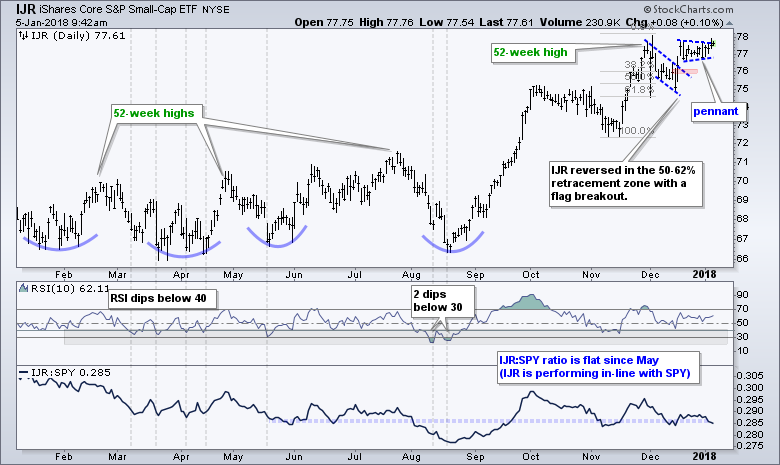
The lower indicator window shows the price relative (IJR:SPY ratio) moving sideways since late May. This means IJR is neither leading nor lagging over the last eight months. IJR is performing in-line with SPY.
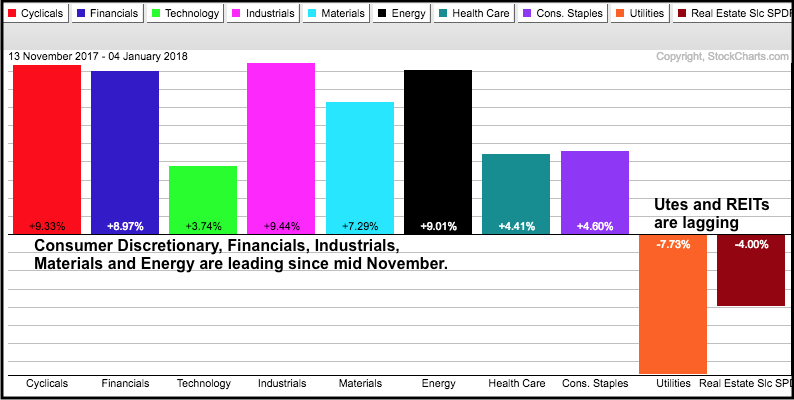
Seven of Ten Sectors Hit New Highs
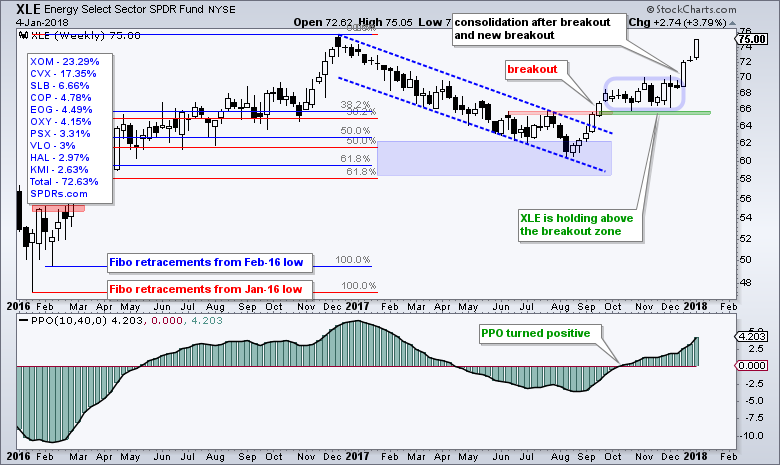
Seven of the ten sector SPDRs hit new highs this week, and there is a new sector joining the new high list. The Energy SPDR (XLE) joined the new high list after a 9% surge the last twelve days. This shows broad strength in the stock market and clearly supports the bull market thesis.
The Utilities SPDR (XLU) and Real Estate SPDR (XLRE) are the weakest of the nine sectors because they are down 8% and 4% from their November highs, respectively. The Consumer Staples SPDR (XLP) did not participate in this week's broad market advance and is down around .4% year-to-date. Utilities, REITs and staples are the three sectors to avoid right now.
Materials, Industrials and Finance Lead New High List
The next chart shows High-Low Percent for the nine sector SPDRs and it is sorted by the High-Low Percent value (highest at the top). High-Low Percent equals new highs less new lows divided by total issues. High-Low Percent for the materials, industrials and finance sectors exceeded +35% on Thursday and these are the three leaders right now. As a percentage of total issues, these sectors have the most new highs and stocks in strong uptrends. The XLK High-Low% ($XLKHLP) surged above 20% and it earned fourth place. Consumer discretionary, healthcare and energy range between 12 and 17 percent and show modest internal strength.
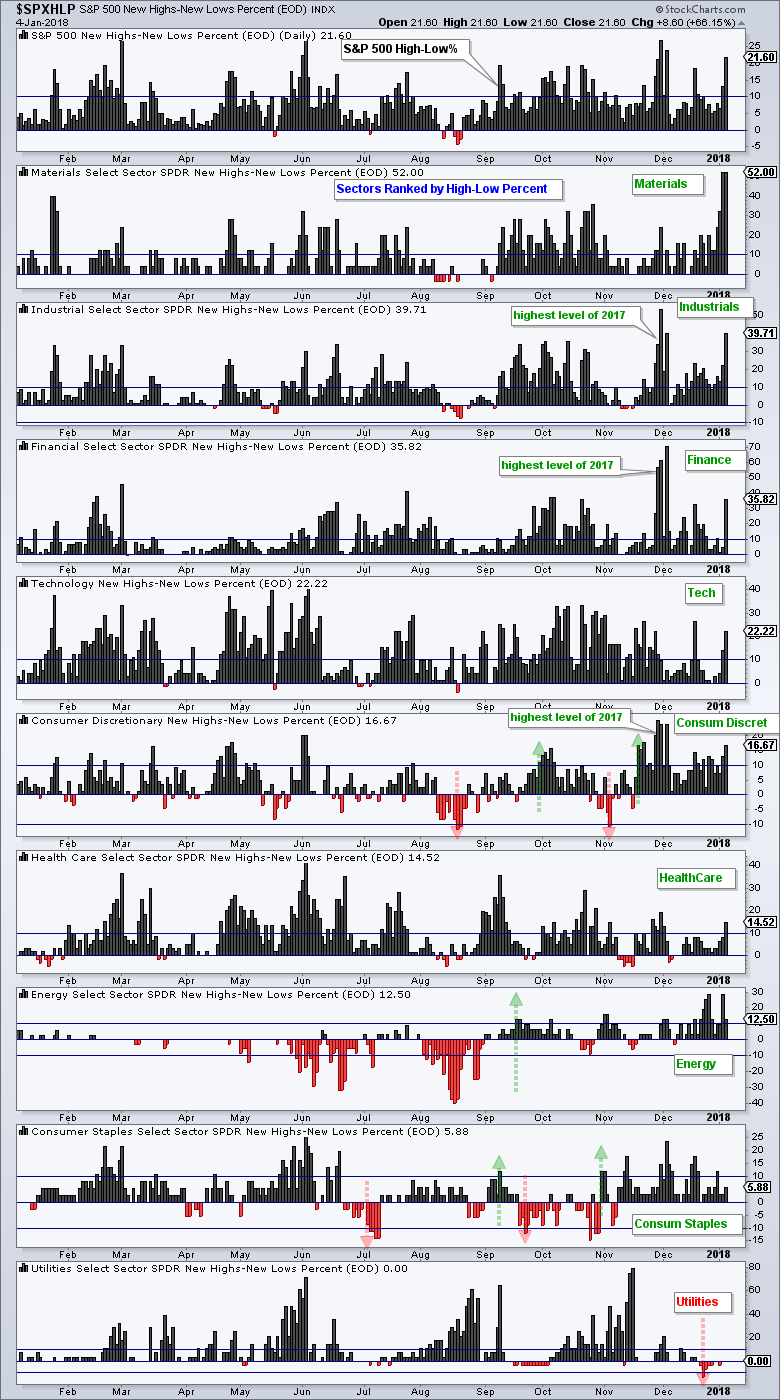
Consumer staples and utilities are the weakest with a bearish signal triggering in XLU High-Low% ($XLUHLP) in late December. The horizontal lines mark +10% and -10%. A move above +10% shows enough critical mass to turn bullish, while a move below -10% is enough to turn bearish.
The green and red arrows show the bullish and bearish signals. Note that XLE triggered bullish in mid September, XLP triggered bullish in early November and XLY triggered bullish in mid November. XLU is the most recent signal with a bearish trigger below -10% on December 21st.
Note that I covered the Energy SPDR (XLE), Regional Bank SPDR (KRE), Broker-Dealer iShares (IAI) and some stocks in Thursday's commentary. I also covered Light Crude Continuous Contract ($WTIC), the Oil & Gas Equip & Services SPDR (XES), Aluminum ETN (JJU), Copper ETN (JJC) and some stocks in Tuesday's commentary.
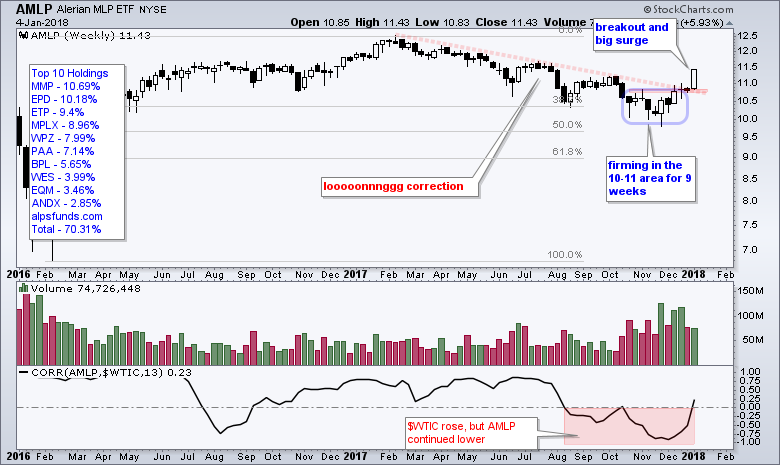
MLP ETF Breaks Out
The MLP ETF (AMLP) finally sprang to life with a breakout and big surge this week. The ETF declined throughout 2017, but this decline still retraced just 50% (half) of the prior advance and looked corrective in nature. After firming in the 10-10.5 area for two months, the ETF broke out with a big surge this week. Note that I featured MLP in the Weekly Market Review & Outlook on December 22nd.
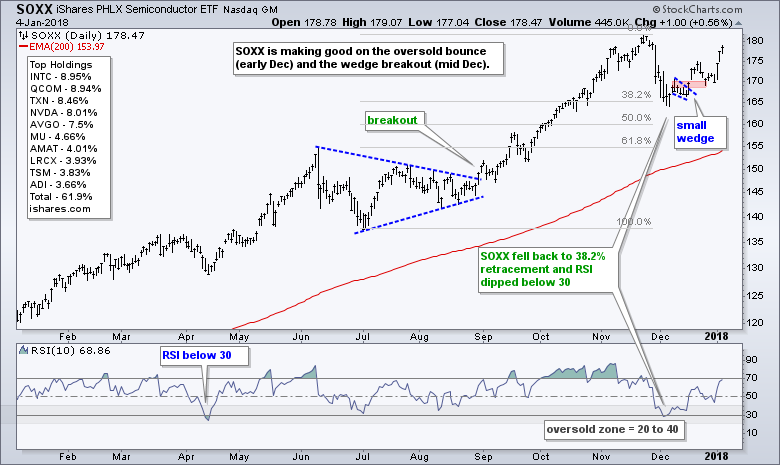
Biotechs, Semis and Buying Ugly
The Biotech SPDR (XBI) and the Semiconductor iShares (SOXX) are lagging somewhat because they have yet to hit new highs. Nevertheless, these ETFs are still in long-term uptrends and their recent breakouts are holding. SOXX became oversold after a dip in November and bounced in early December. A mini wedge formed and the ETF broke out again on December 15th. SOXX is up sharply the last three days and showing renewed signs of life.
XBI became oversold in late October and mid November, and then struggled to extend on its breakout (blue oval). The breakout ultimately held as the ETF advanced to the October highs over the last three weeks.
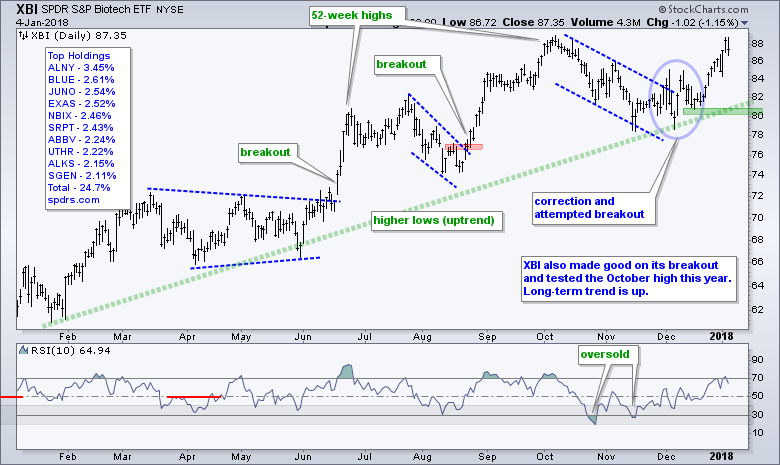
There are three takeaways on these charts. First, we should be on high alert when a stock or ETF is in a long-term uptrend and it becomes short-term oversold (RSI near 30). XBI and SOXX certainly looked ugly when they fell and RSI dipped below 30, but these dips presented an opportunity. Second, give the base process and breakout a little time to unfold. The long-term uptrend is the dominant force and the bet is for a continuation of this long-term uptrend. Third, analyze short-term price action after an oversold reading and look for bullish catalyst.
TLT Ignores IEF Break Down
The unadjusted 7-10 YR T-Bond ETF (_IEF) broke support and the triangle line with a sharp decline in late December. This is bearish for IEF and I am marking resistance at 106.50. A close above this level would argue for a re-evaluation.
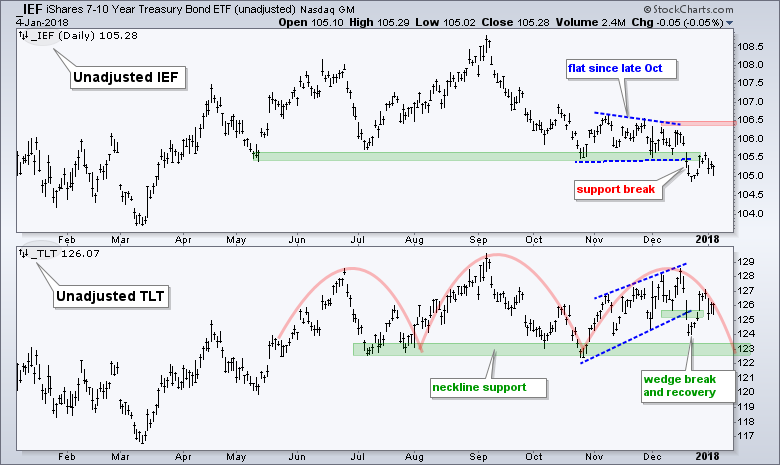
The unadjusted 20+ YR T-Bond ETF (_TLT) has a possible head-and-shoulders reversal working with neckline support in the 123 area. TLT broke the wedge line in late December and it looks like a neckline support test was in order. TLT had other ideas and bounced right back above 126 this week. I will cue off IEF for the bond market and stay bearish as long as 106.5 holds.
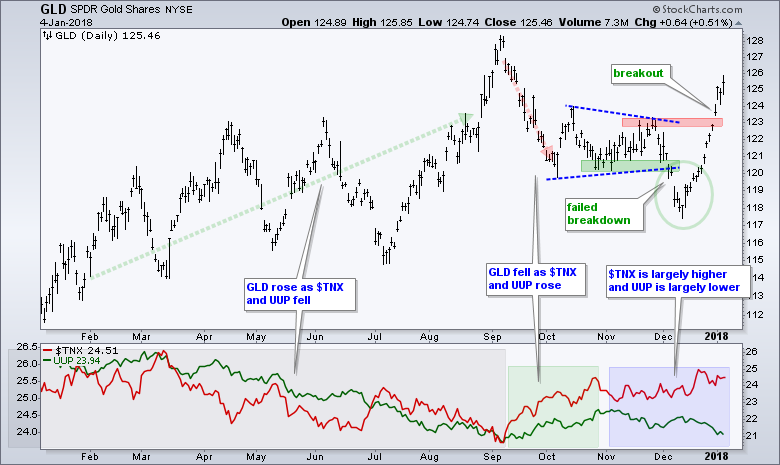
Gold Breaks Out with Big Surge
The Gold SPDR (GLD) is up 6.5% in 16 days and trading above its October high. I did not see this reversal or breakout coming. Frankly, I have no idea what drives gold. The 10-yr T-Yield ($TNX) is largely higher since early November and the Dollar is lower. Rising yields are negative for gold, but a falling Dollar is positive. I guess a weak Dollar put the bid in gold. Even though the breakout at 123 is bullish, GLD is excessively overbought and ripe for a pullback. Chartists interested in GLD can put it on their watch list and wait for a short-term oversold condition.
Notes from Art's Charts ChartList (here)
- The Home Construction iShares (ITB) hit a new high this week.
- Tech continues to rock with new highs in the Cloud Computing ETF (SKYY), Cyber Security ETF (HACK), Software iShares (IGV), Networking iShares (IGN) and Internet ETF (FDN).
- The Semiconductor iShares (SOXX) and the Semiconductor SPDR (XSD) are making good on their oversold bounces (early Dec) and the wedge breakouts (mid Dec).
- The Broker-Dealer iShares (IAI) broke flag resistance on Thursday.
- RSI dipped into the oversold zone (<40) as the Insurance SPDR (KIE) corrected with a falling wedge.
- The Mortgage REIT ETF (REM) is off to a bad start in 2018 with a lower high and support break.
- The Regional Bank SPDR (KRE) surged and then formed a triangle. Watch 60.5 up and 58.5 down.
- The REIT iShares (IYR) trended higher throughout 2017, but fell out of favor in mid December and hit a one month low this week.
- The Airline ETF (JETS) and Transport iShares (IYT) hit new highs this year.
- The Biotech iShares (IBB) is still below its October high, but the long-term trend is up and the breakout ultimately held. First support is set at 104.
- The Oil & Gas Equip & Services SPDR (XES) extended on its breakout and broken resistance turns first support to watch on a throwback.
ETF Master ChartPack
300+ ETFs organized in a Master ChartList and in individual groups.
Follow me on Twitter @arthurhill
Keep up with my 140 character commentaries.
Thanks for tuning in and have a good day!
--Arthur Hill CMT
Plan your Trade and Trade your Plan


