- Filter Group 1: General Symbol Conditions.
- Scanning Specific Indexes.
- Filter Group 2: Broad Technical Conditions.
- Cutting to the Chase with Indexes.
- Eliminating a Sector or Industry Group.
- Filter Group 3: Technical Signals.
- Wendy's and Micron Make the Cut.
- Conclusions and Complete Scan Code.
 Chartists use scans to narrow the tradable universe and find stocks that meet certain criteria. After all, there is no sense analyzing charts that do not meet your basic criteria, whatever they may be. Filtering out undesirable stocks is the first step to picking desirable stocks.
Using my preferred scan methods, this article will show three filter groups that chartists can use to successfully narrow your universe and find charts that merit further analysis. Note that the complete code is included at the end of this article.
Note that I just finished some instructional videos on writing scans and these can be found in the Scanning & Alerts section near the bottom of the videos page. This page also includes a video on working with scan results.
Filter Group 1: General Symbol Conditions
There are over 10,000 symbols in the StockCharts database so my first filter group begins with some basic symbol requirements. Using the Advanced Scan Workbench, StockCharts members can select country, security type or index. Chartists interested in only large-cap US stocks could simply start with these criteria:
[country is US] // only US
and [type is stock] // only stocks
and [market cap > 50,000] // market cap greater than $50 billion
and [market cap < 1,000,000] // market cap below $1 trillion (eliminate ETNs)
Rank By Market Cap
Notice that I added comments to the right of my scan code and these comments are preceded by two forward slashes (//). The scan engine ignores everything to the right of two forward slashes.
I also added that market cap was greater than $1 trillion because dozens of ETNs appeared in the scan and their market cap was greater than $1 trillion.
And finally, the last line of the scan code uses the "Rank By" function to sort the results by market cap. The Rank By line must be the last line and you can only rank by one variable. Apple is at the top with a market cap of $858.25 billion.
Scanning Specific Indexes
Chartists can also choose a particular index for their symbol universe. To make my life easy, I usually just start with the S&P 1500, which is the S&P 500, S&P Mid-Cap 400 and S&P Small-Cap 600.
[[group is SP500]
or [group is SP400]
or [group is SP600]]
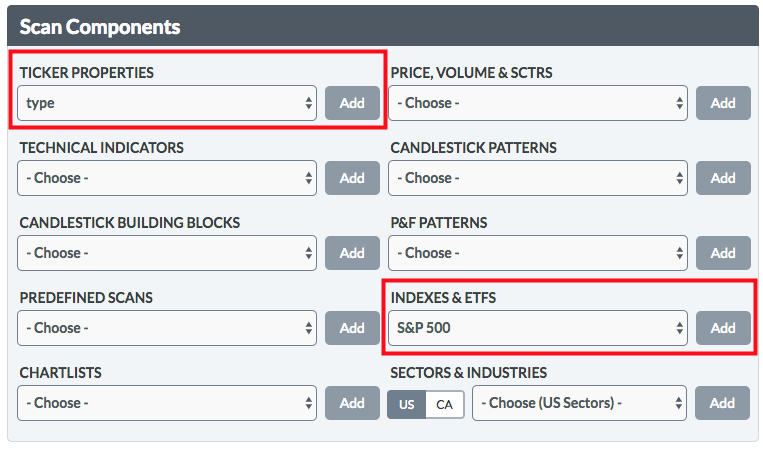
The image below shows the Scan Components menu, which is just below the Scan Criteria box on the Advanced Scan workbench. This makes it easy to select an item from a drop-down menu and add it to a scan.

Filter Group 2: Broad Technical Conditions
The second filter group captures some basic technical conditions. First, I am only looking for stocks in long-term uptrends, as measured by the 50-day EMA being above the 200-day EMA. Second, I am looking for stocks that trade a minimum amount of volume. Third, I am looking for stocks that are price above $10 per share.
[ema(50,close) > ema(200,close)] // long-term uptrend
and [sma(200,volume) > 500000] // minimum volume
and [sma(20,close) > 10] // minimum close
Note that these are just some guidelines to consider. Chartists looking for more excitement may choose stocks under $10 or even low volume stocks. I prefer higher priced stocks with relatively high average volume. These are usually the larger stocks in the universe.
Cutting to the Chase
Using the first two filter groups, general symbol conditions and the broad technical conditions, my scan universe went from 10,000 plus stocks to 1500 stocks to around 679 stocks. Chartists looking to narrow the universe even further could add more technical conditions.

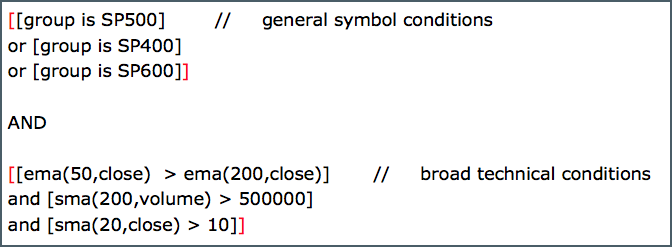
Before leaving this section, notice that the first three clauses in group one are joined by "or" and the three clauses in group two are joined by "and". Each clause is enclosed in brackets [ ] and all three clauses are again enclosed by brackets (red) to create the group.
The OR group means that I want one of the three clauses to be true. The stock can be in the S&P 500 or the S&P Mid-Cap 400 or the S&P Small-Cap 600.
The AND group means that all three of these clauses MUST be true. The 50-day EMA must be above the 200-day EMA and the 200-day SMA above volume must be above 500,000 and the 20-day SMA of the close must be above 10. All three clauses are enclosed in brackets to keep them grouped.
The "AND" links the two groups. This means one of the clauses in group one ("or" group) must be true and all in group two ("and" group) must be true.
Eliminating a Sector or Industry Group
Chartists can also eliminate a sector or industry group from their scan results. Dozens of utility stocks appeared in the first run and I want to avoid this group right now. Note that the Utilities SPDR (XLU) broke below its September low and exceeded its 200-day SMA in late December.
Using the Scan Components drop-down menus I showed earlier, chartists can select the Utilities sector and add the word "not" to the clause.
[group is not UtilitiesSector] // add line to eliminate utility stocks
Filter Group 3: Technical Signals
It is now time to consider technical signals for the final cut. The next filter group shows three technical signals and I am looking for one of these three to be true. Note that the clauses are joined by "or".
The first code line is looking for the PPO Line to be below 1 to ensure a pullback in the PPO. I am then looking for the PPO Line to cross above the PPO Signal Line. Both of these must be true because the two clauses are joined with "and". Notice that the entire first line is enclosed with the red brackets.

The second clause is looking for 10-period RSI to cross above 30 and the third clause is looking for 20-period CCI to cross above -100. Basically, I am looking for a pullback and upturn in one of these three momentum oscillators. The clauses are joined with "or" and the entire group is enclosed with brackets (green).
Wendy's and Micron Make the Cut
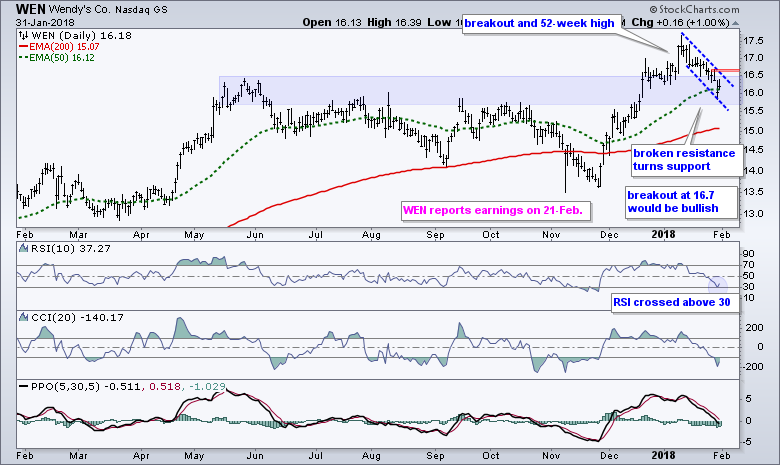
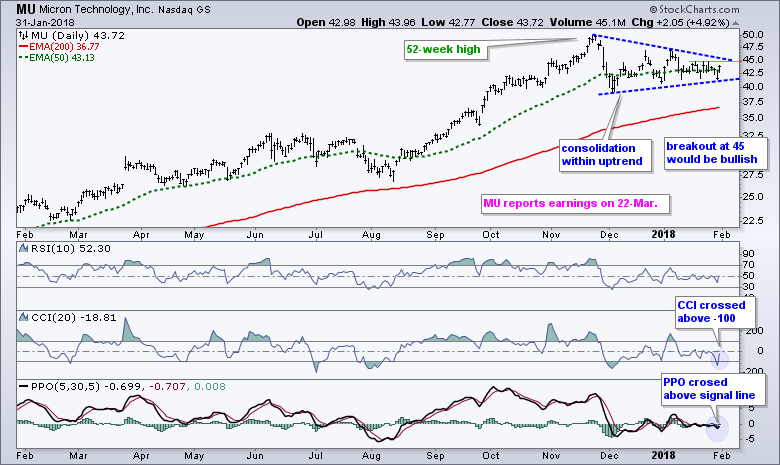
I ran this scan today (1-February) and there were 32 results. This is a manageable list and I can now look at the individual charts. Micron Technology (MU) and Wendy's (WEN) stand out.
Conclusions
This article showed guidelines that chartists can use to build a robust scan. First, narrow the symbol universe with some general symbol conditions. I just selected stocks from the S&P 1500. Second, set out some broad technical conditions for your basic requirements (trend, volume etc). Third, add signals for the final cut and check the charts to make sure the scan is working properly.
The scan code here is based on my personal preference because I look for pullbacks within an uptrend. Chartists trading momentum would prefer stocks making new highs and stocks with a high Rate-of-Change. Chartists trading small-caps would likely need to adjust the market-cap and volume requirements. Scanning is just the first step to stock selection and it is important to analyze the individual charts as well.
Complete Scan Code
The entire scan code is shown below. Note that I tested it and it works. You will have to go through the debugging process if you find syntax errors after you copy and paste it into the Advanced Scan Workbench.
// Filter Group 1: General Symbol Conditions
[[group is SP500]
or [group is SP400]
or [group is SP600]]
and [group is not UtilitiesSector]
AND
//Filter Group 2: Broad Technical Conditions
[ema(50,close) > ema(200,close)]
and [sma(200,volume) > 500000]
and [sma(20,close) > 10]
AND
// Filter Group 3: Technical Signals
[[[PPO Line(5,30,5) < 1] and [PPO Line(5,30,5) x PPO Signal (5,30,5)]]
or [RSI(10) x 30]
or [CCI(20) x -100]]
Plan Your Trade and Trade Your Plan.
- Arthur Hill, CMT
Senior Technical Analyst, StockCharts.com
Book: Define the Trend and Trade the Trend
Twitter: Follow @ArthurHill


