- Nowhere to Hide.
- Majority of Stocks Remain Weak.
- VIX Remains at Lofty Levels.
- Oil Starts to Correct.
- XES Extends Correction and Breaks Wedge Line.
- XLE Triggers Bearish Breadth Signals.
- Charting Breadth Indicators.

February marked a sudden and dramatic shift in the financial markets. As the PerfChart below shows, stocks, oil, copper and gold fell sharply the last five trading days. Despite money moving out of commodities and stocks, bonds also fell as the 20+ YR T-Bond ETF (TLT) declined 3% and the Muni Bond ETF (MUB) fell. The Dollar (UUP) was the only beneficiary with a 1.51% rise. Looks like the Dollar is benefitting from some safe-haven status.
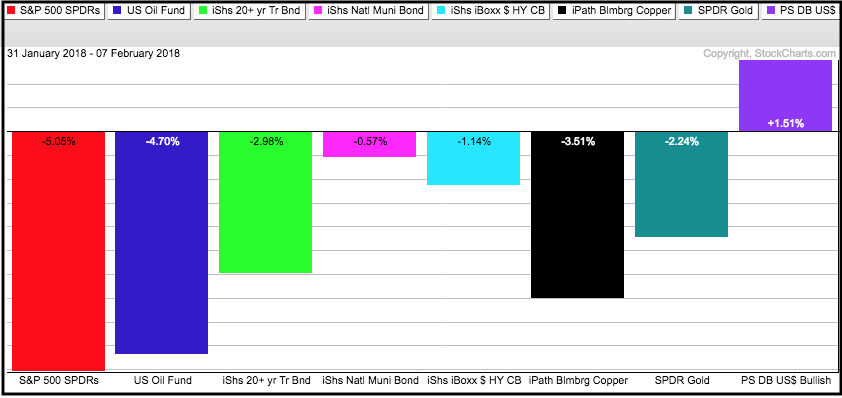
The fact that everything is down except the Dollar suggests that something is amiss in the markets. I don't know what, but usually we see some rotations into other assets. As far as I can tell, only a few soft commodities and short-term Treasury bonds are up, and just up fractionally. These include the Coffee ETF (JO), the Corn ETF (CORN) and the T-Bill ETF (BIL).
Majority of Stocks Remain Weak
As noted on Tuesday, the stock market is in the midst of a correction within a bull market. I do not think Tuesday's reversal day was enough to end the correction because breadth and the VIX remain in bear mode. First, the percentage of stocks above the 50-day EMA remains below 30% for the S&P Mid-Cap 400 and S&P 600. Thus, the vast majority of stocks remain below their 50-day EMAs.
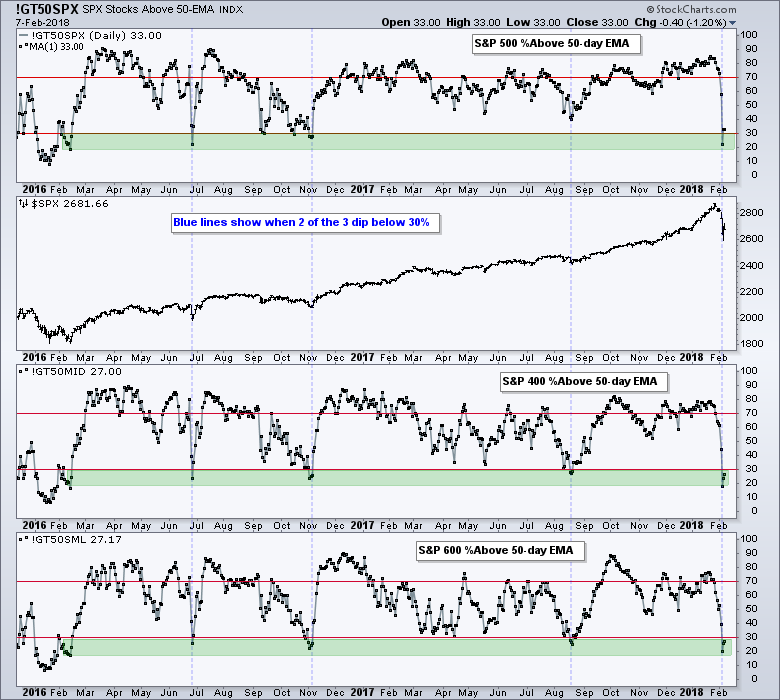
This indicator became oversold (<30%) for the S&P 500, S&P Mid-Cap 400 and S&P Small-Cap 600 on Monday. Oversold within an uptrend is a bullish setup, but we need to see some strengthening for a signal. The indicator moved above 30% for the S&P 500 on Monday, but did not clear the 30% level for the S&P Mid-Cap 400 and the S&P Small-Cap 600. One of these needs to move above 30% for a majority signal (two of three).
VIX Remains at Lofty Levels
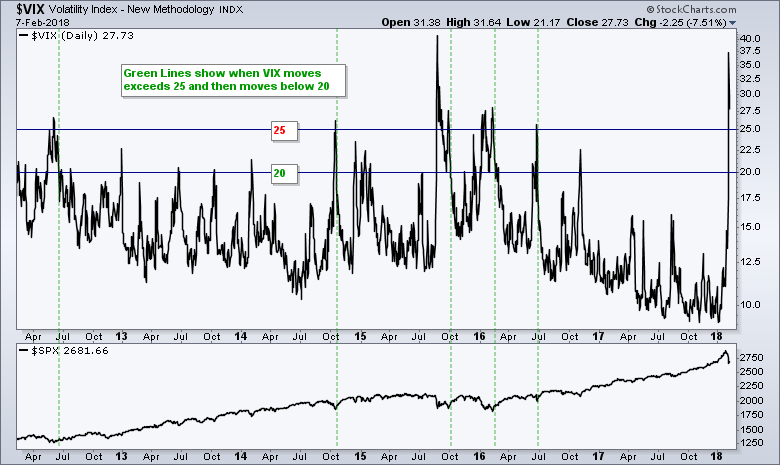
In addition to breadth, the S&P 500 Volatility Index ($VIX) remains above 25 and at elevated levels. Fear lingers within the market and it may take a little more time to calm nerves. Notice how VIX surged above 25 in August 2015 and did not move back below 20 until early October, 30 days later.
As long as I remain in the correction camp, I would expect downward pressure or listless trading for the majority of stocks and stock ETFs. The broader market picture is the single biggest influence on stocks and stock picking will be challenging, to say the least, until the broader market picture improves. Even though there are lots of short-term oversold readings out there (RSI(10) < 30), I am passing on these until I see some bullish signals in broad market breadth and the VIX.
Oil Starts to Correct
Oil was holding up rather well last week, but succumbed to selling pressure on Wednesday and broke below its mid January low. This is a minor support break and the short-term downtrend is still considered a correction within a bigger uptrend.
The middle window of the chart below shows the Light Crude Continuous Contract ($WTIC) hitting new highs in December and January. Oil was up over 50% from its summer lows and ripe for a correction of some sorts.
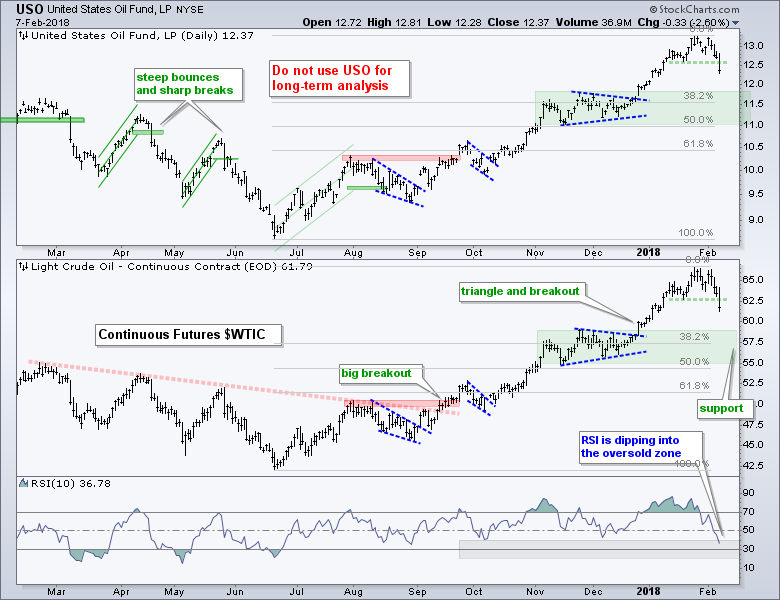
A 38 to 50 percent retracement of the prior advance would extend to the 55-58 area. The November-December consolidation also marks support in this area. This is the first area to watch for firmness and a possible bullish short-term reversal.
The indicator window shows RSI(10) moving below 40 for the first time since August. This is the first time RSI has moved into its oversold zone since summer, which is testament to the strength of the advance. I suspect that RSI will dip below 30 before this correction is complete.
XES Extends Correction and Breaks Wedge Line
Oil peaked on January 26th, but the Oil & Gas Equip & Services SPDR (XES) peaked on January 12th and turned negative for the year this past week. Thus, XES peaked two weeks before oil and relative weakness is a concern for oil and the sector.
As noted on Tuesday, marking support and resistance levels for ETFs and indexes with dozens of moving parts is often a lesson in futility. At best, we are making educated guesses. The green zones on the chart below mark my prior attempts to mark support - and both failed.
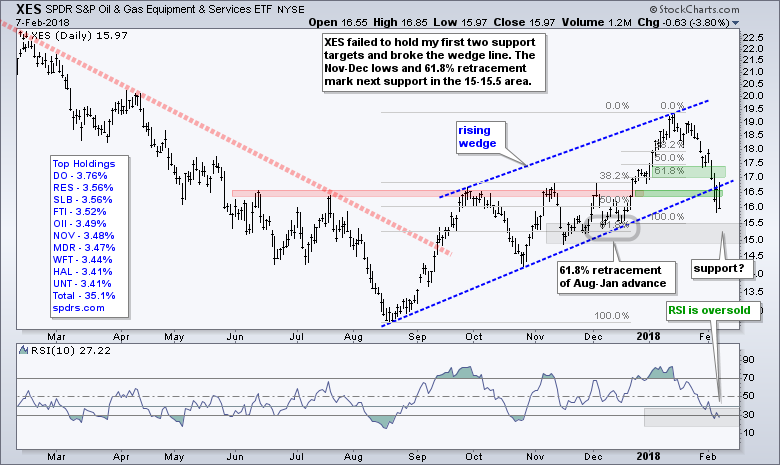
With the sharp decline over the last few weeks, XES broke the wedge line and this could be long-term bearish. In other words, the August-January advance could be just a big counter-trend move within a bigger downtrend. Check out the weekly chart.
The future performance of XES depends on oil and its ability to hold the 55-58 area. I will be watching the 15-15.5 area for XES next because the Nov-Dec lows and 61.8% retracement mark a potential reversal zone.
XLE Triggers Bearish Breadth Signals
Let's look at the price chart before looking at the breadth signals. XLE hit a 52-week high in late January and then fell 12% in two weeks. Does that sound normal for a bull market? Doesn't too me.
With this decline, XLE retraced around 61.8% of the August-January advance and returned to the October-November consolidation zone. One could make the case for support in the 66-68 area, but the recent breadth signals suggest that the long-term trend is changing for XLE.
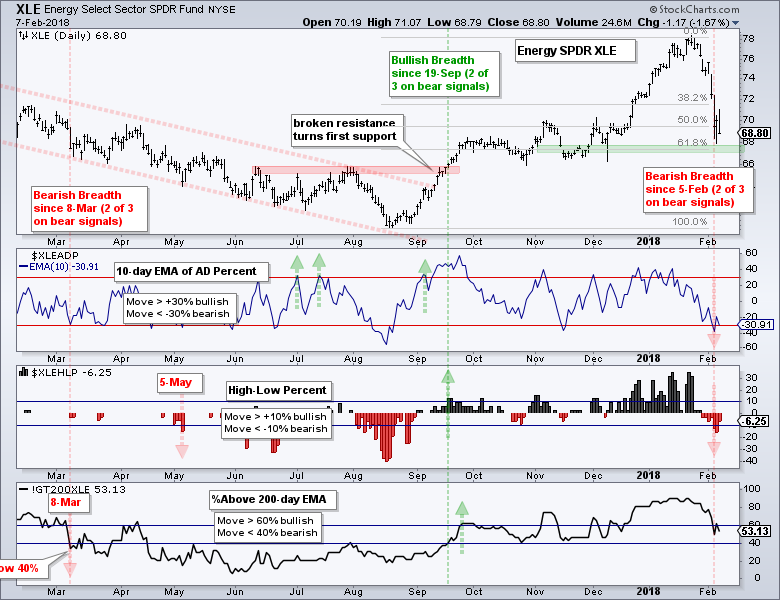
The 10-day EMA of AD Percent moved below -30% and High-Low Percent moved below -10%. Two of the three indicators triggered bearish and energy joins the Utilities SPDR with bearish breadth. At the very least, this makes XLE one of the least preferred sectors right now.
We do not yet track breadth for the Real Estate SPDR (XLRE), but I suspect that breadth would also be bearish for this sector. Thus, we can assume that three of the ten S&P sectors have bearish breadth signals. These three sectors, however, account for just 11% of the S&P 500 (energy 5.84%, utilities 2.67% and REITs 2.66%).
Signal Notes: I track three breadth indicators for each sector SPDR. The 10-day EMA of AD Percent triggers bullish with a move above +30% and bearish with a move below -30%. High-Low% triggers bullish with a move above +10% and bearish with a move below -10%. %Above 200-day EMA (!GT200XLE) triggers bullish with a move above 60% and bearish with a move below 40%. An overall signal triggers when two of the three breadth indicators trigger.
Charting Breadth Indicators
StockCharts members can also plot these indicators for several indexes and the nine sector SPDRs. StockCharts calculates and publishes this indicators on a daily basis and they provide unique insight into the indexes and sectors. The image below shows a symbol catalog search for "advance and decline and percent". You can also search for "high and low and percent" (sans quotation marks).
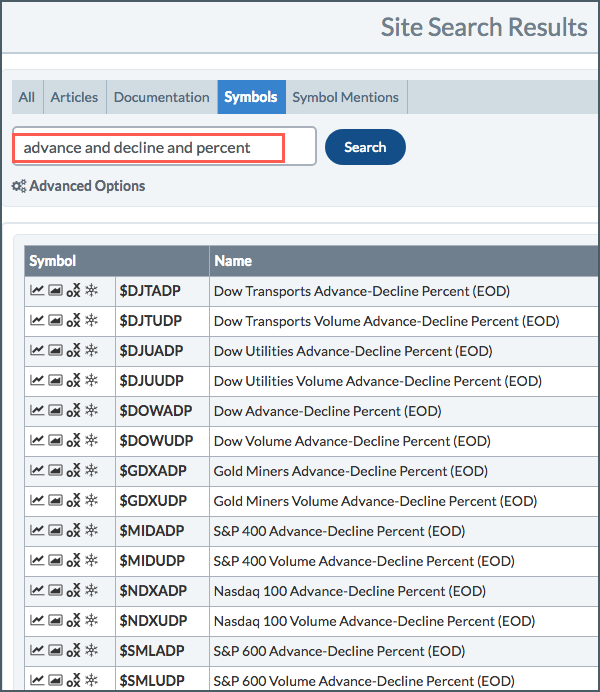
The image above shows the AD Percent indicators ending in ADP and the AD Volume Percent indicators ending in UDP. They all begin with a Dollar sign ($) and contain the index or ETF symbol in the middle. Thus, it is easy to figure out other symbols. For example, $XLEADP becomes $XLFADP for the Financials SPDR (XLF). Also note that !GT200XLE becomes !GT200XLF.
Plan Your Trade and Trade Your Plan.
- Arthur Hill, CMT
Senior Technical Analyst, StockCharts.com
Book: Define the Trend and Trade the Trend
Twitter: Follow @ArthurHill


