- First Things First (Correction or More?).
- Another Perfect Storm.
- Yield Curve Turns Up.
- Oversold Setup in Breadth Indicators.
- A Bullish Setup for VIX.
- Playing the Guessing Game.
- Past Corrections Study.
 First Things First
It is still a bull market. The 50-day EMA for the S&P 500 remains above the 200-day EMA, the index is above the rising 200-day SMA and the index hit a new high less than two weeks ago. Using the EMA golden cross, the S&P 500 has been in a bull market since mid April 2016.
Note that I generally use exponential moving averages for the golden cross because they are weighted towards recent prices. I also use the 50-day and 200-day simple moving averages with the S&P 500 and SPY because these are widely followed. If enough people use them, they become a self-fulfilling prophecy.
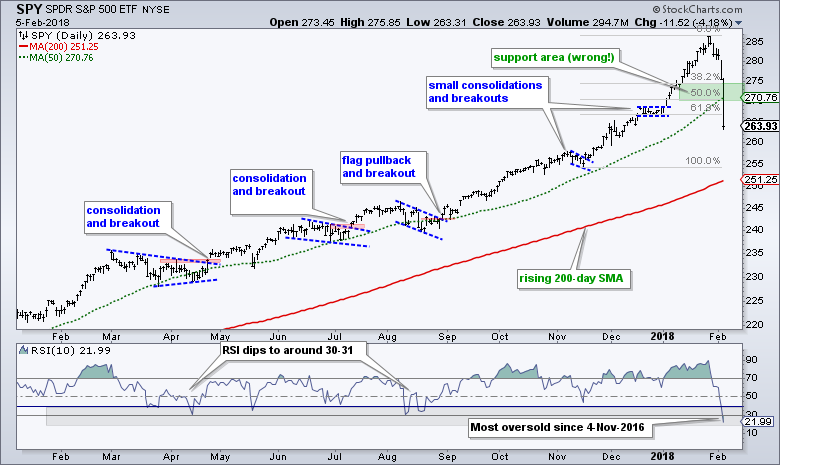
The next support level is anyone's guess, and there are plenty of guesses out there. Note that the S&P 500 and SPY are currently trading between the 50-day EMA/SMA and 200-day EMA/SMA. My first guess was the rising 50-day SMA and the 38-50% retracement zone, but the index went right through this level on Monday. I'll make another guess a little later.
For now, the bull market remains in play and the S&P 500 is the most oversold since November 4th, 2016. The recent decline, while dramatic, is still viewed as a correction within a bull market. RSI(10) reached 21.59 then and is currently at 22.30. A short-term oversold condition in a long-term uptrend is viewed as an opportunity so I am on alert for bullish signals.
The Perfect Storm
The stock market was hit with a perfect storm. As noted last Tuesday, the S&P 500 Volatility Index ($VIX) and the S&P 500 were rising together and this marked a disconnect in the stock market (i.e. something was amiss).
Second, the financial markets were in the midst of violent moves. As noted on Friday, oil, the Dollar, stocks and bonds made big moves from early November to late January. Oil was up over 15%, the Dollar was down over 6%, the 10-yr T-Yield surged over 16% and stocks were up almost 9%. The financial markets were turning volatile and it was not yet reflected in the stock market.
Throw in machine trading, ETF rebalancing and margin calls, and the perfect storm for a stock market flash crash was in place. Note that ETFs have replaced mutual funds as the biggest holders of stocks and they rebalance their holdings. Don't you just love hindsight.
Yield Curve Turns Up
The 10-yr T-Yield ($TNX) and the 30-yr T-Yield ($TYX) fell sharply this year and finally played catchup with the short-end of the yield curve. Note that the 2-yr yield moved higher from February to September 2016, even as long-term yields fell. The chart below shows this dynamic at work in the top window.
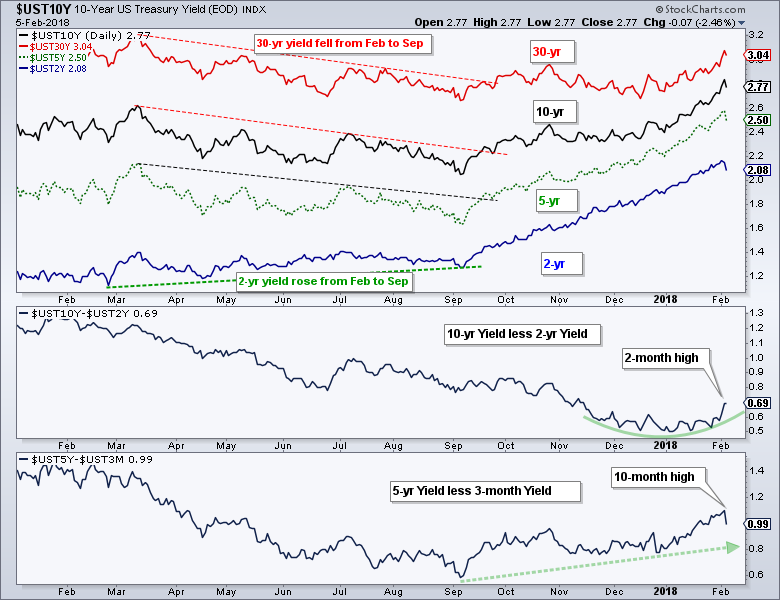
The indicator windows show two measures for the yield curve (10-yr less 2-yr yield and 10-yr less 3-month yield). First and foremost, notice that neither yield curve is even close to becoming inverted. The yield curve becomes inverted when these two move below zero and short-term yields are higher than long-term yields. Thus, the yield curve is currently supportive of the bull market in stocks.
Second, notice that the 10-2 yield curve turned up this year and hit a two-month high last week. Similarly, the 10yr-3mo yield curve bottomed in September and hit a ten month high. Both yield curves are on the rise and this could be positive for banks.
Oversold Setup in Breadth Indicators
I featured the percentage of stocks above the 50-day EMA as a breadth indicator to watch for an oversold setup (S&P 500, S&P Mid-Cap 400 and S&P Small-Cap 600). All three moved below 30% and even below 25%. In fact, all three are at their lowest levels since February 2016. Thus, the oversold setup is in play.
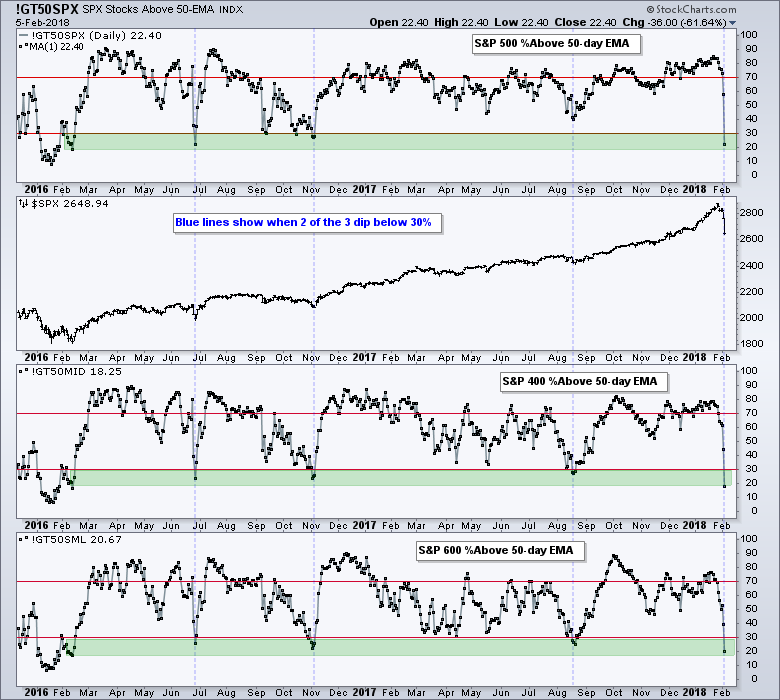
Note that stocks were not in a bull market environment in February because the 50-day EMA of the S&P 500 was below the 200-day EMA at the time. This means the oversold setup was not in play. Stocks moved into a bull market environment in March-April and the first oversold setup in the bull market occurred in June 2016.
With all three indicators oversold in a bull market, it is time to stay alert for some sort of upside catalyst. A move back above 30% would provide the first bullish signal. Also note that an RSI(10) move back above 30 would suggest an oversold bounce. I will be watching 10-day RSI for SPY, IJR, MDY, QQQ and DIA.
A Bullish Setup for VIX
The VIX surged above 25 for at least the fifth time in six years. This shows a surge in the fear-factor, but a high and rising VIX is still negative for stocks. The key is to wait for the VIX to turn down and move below 20.
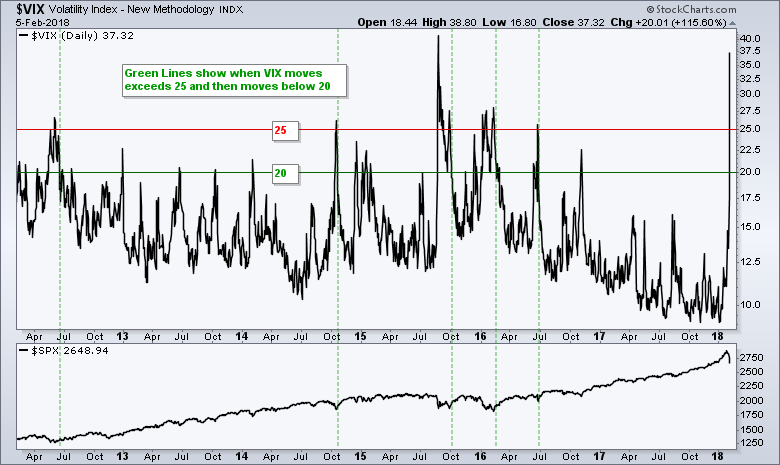
The green lines on the chart show when the VIX moves below 20 (after being above 25). The VIX is currently at 37.32 and is unlikely to move below 20 today. However, chartists looking for a return to normalcy can watch to see if the VIX moves below 20 in the coming days.
Playing the Guessing Game
Predicting support for indexes and ETFs is often a lesson in futility. The same goes for resistance and price targets. First, there are dozens of moving parts in an index/ETF. Second, the weightings of these moving parts changes over time. Third, the component stocks also change. The index/ETF you see today is not the same index/ETF that you saw six months ago.
Yes, there are traded prices for the S&P 500 futures and SPY. These prices can also be used to mark support and resistance levels in the traditional manner. However, the component stocks are also driving the price of the S&P 500 futures and SPY. Not every stock has a support or resistance level that coincides with support or resistance for the S&P 500 futures or SPY. The same applies to ETFs.
Enough with my rant on support and resistance for indexes and ETFs. We all are interested in knowing (guessing) the next support level for the S&P 500 so I will take another stab.
Note that most lines we draw on charts are subjective.
The S&P 500 chart below shows three Fibonacci Retracements starting from the February 2016 low, the June 2016 low and the November 2016 low. They all extend to the January 2018 high and the gray ovals show a cluster in the 2433-2500 area.
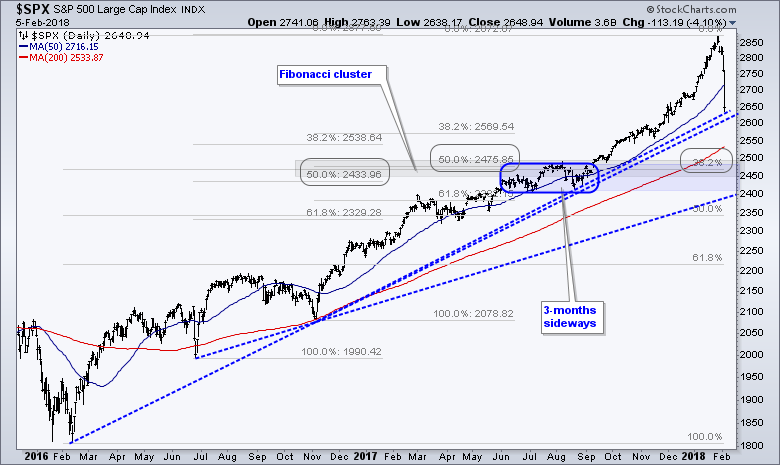
There are three trend lines with two marking support in the 2600-2620 area and support in the 2400 area. There is also the consolidation from June to mid September marking support in the 2400-2500 area. And finally, we have the rising 200-day SMA at 2533.
One of these levels has a good chance of nailing support, but which one!? Your guess is as good as mine. The rising 200-day SMA is as good as any and I think there is a good chance the S&P 500 bounces should it reach the 2500-2550 area, which is another 100 to 150 points lower (3.5% to 5.5% lower).
Past Corrections for Study
The next chart shows the S&P 500 from February 2009 to February 2018 (nine years). The blue areas mark the most significant declines and the green areas mark the garden variety corrections. The big blue zone marks six months of hell. Chartists looking for more insights may want to study these periods. The biggest risk right now is that we see corrections resembling the blue zones.
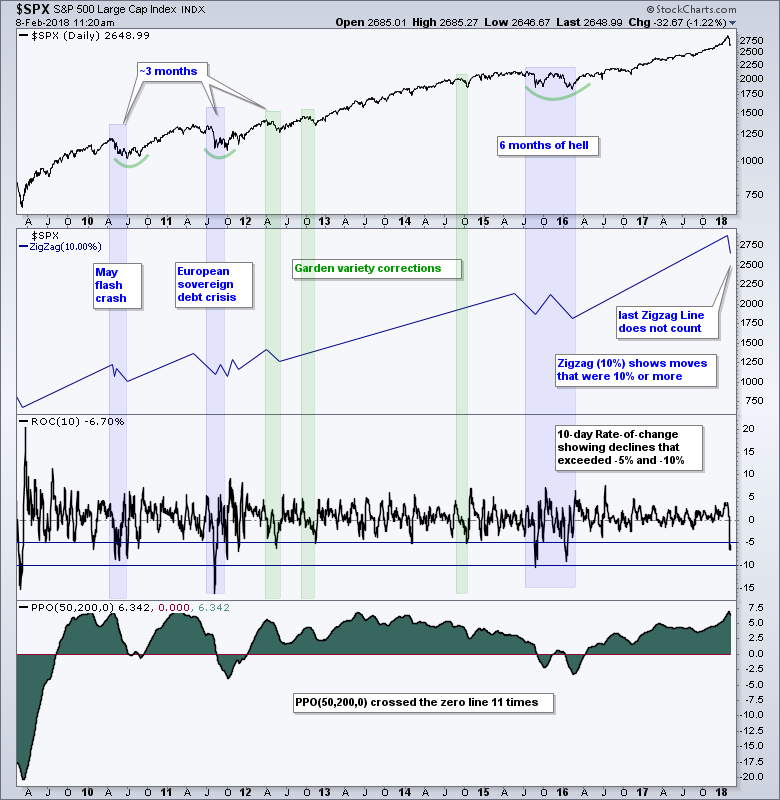 Of note, the S&P 500 fell 10 percent or more from high to low at least eight times over the last nine years. The 10-day Rate-of-Change dipped below -5% at least 15 times and below -10% twice. And finally, the 50-day EMA crossed the 200-day EMA eleven times (PPO(50,200,0).
Plan Your Trade and Trade Your Plan.
- Arthur Hill, CMT
Senior Technical Analyst, StockCharts.com
Book: Define the Trend and Trade the Trend
Twitter: Follow @ArthurHill


