- Turn of the Month Turns Negative.
- SPY Holds the Gap.
- Is the VIX Returning to Normal?.
- S&P 500 Correction Targets.
- Watching for Oversold Breadth.
- IBB Corrects from New High.
- Gold Maintains Upswing as Dollar Falls.
- Notes from the Art's Charts ChartList.
- Videos with Interesting Takes.
 Turn of the Month Turns Negative
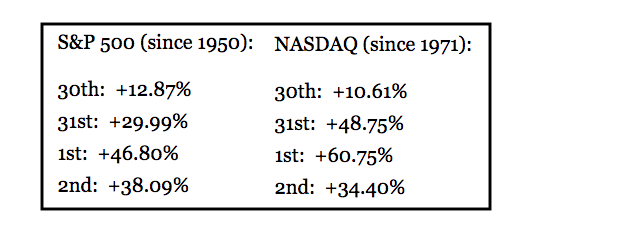
There is a pretty strong bullish bias when looking at price performance from the end of one month and the beginning of the next. The theory is that portfolio managers receive inflows at the end or beginning of the month and put these new funds to work by buying stocks.
Tom Bowley tracks these numbers on a regular basis in is Trading Places blog. Tom notes that the annualized return for the S&P 500 is as follows: +13% for next to last day of the month, 30% for last day, 47% for first day and 38% for second day. Tom also notes that there is no guarantee that these historical tendencies will persist.
January was a stellar month for stocks with the S&P 500 SPDR (SPY) gaining 5.46% and the EW S&P 500 ETF (RSP) surging 4.38%. The end of the month, however, did not fair so well as SPY fell around 1% the last two days of January and RSP fell around 2%. The first day of February is also off to a shaky start with SPY and RSP down fractionally. Today is the second day of the month and stock futures are pointing sharply lower.
While it is understandable to see profit taking after a sharp advance, I think the failure of this bullish tendency is a negative for the market. This does not signal a bear market, but it does reinforce my view that the broader market is ripe for a corrective period and that correction started this week.
----- Art's Charts ChartList (updated February 2nd) -----
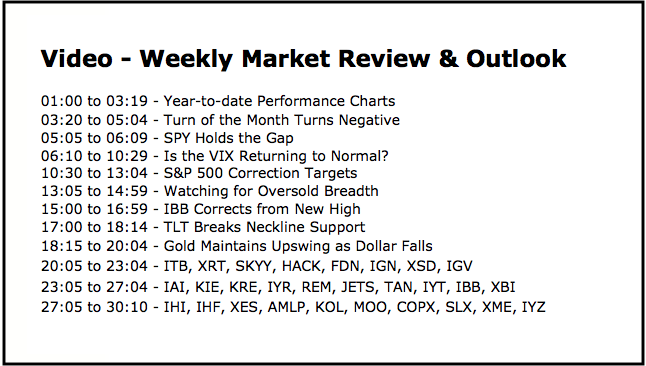
SPY Holds the Gap
The chart below shows 30 minute bars for SPY, QQQ and IJR - and all three gapped down on January 30th. These gaps held for SPY and IJR, and the gap largely held for QQQ. Also note that all three moved lower after the gaps. This means buyers did not step in after the gap and sharp decline. Also notice that IJR peaked on January 24th and started lower first. The red zones mark short-term resistance that traders can use to identify a short-term reversal.
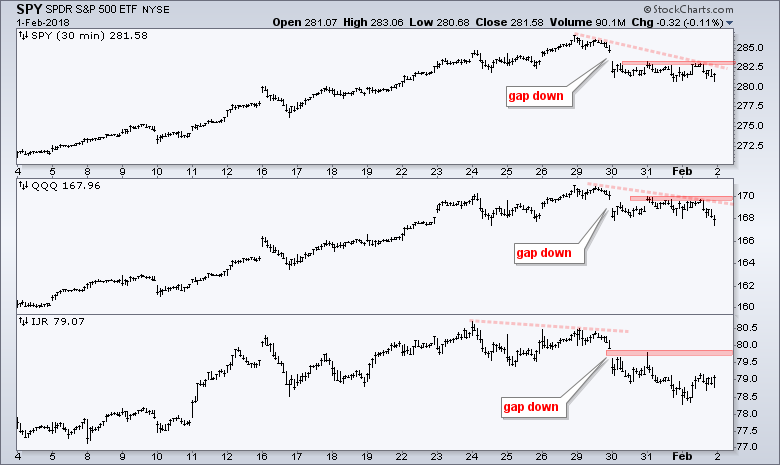
Is the VIX Returning to Normal?
I wrote about the disconnect between the S&P 500 Volatility Index ($VIX) and the S&P 500 on Tuesday. In a nutshell, the VIX and the S&P 500 rose from January 3rd to January 18th and the 10-day Rate-of-Change was positive for both from January 16th to January 29th. It is unusual for both to move in the same direction and this disconnect foreshadowed corrections in the past.
The S&P 500 Volatility Index ($VIX) is also a contrarian indicator that can be used to identify bottoms. I put this indicator through the ringer in June 2017 and came up with a system using the PPO to identify VIX extremes. I will update this article next week.
The challenge with the S&P 500 Volatility Index is that the ranges change over time. The chart below shows the VIX throughout the current bull market. The VIX shot above 40 in 2010 and 2011 because the wounds of 2007 and 2008 were still fresh. The VIX then moved into a nice bull market range where spikes above 20 marked tradable lows in the uptrend.
Volatility returned in 2015 as the VIX surged above 30. Volatility then calmed down in 2016 and we moved into low-vol mode in 2017 where spikes above 15 marked tradable lows. Notice how the VIX dipped below 10 several times from July to January.
Nobody knows what the future holds, but I would not be surprised to see the range for the VIX creep higher. In fact, the 20 level may return as the level to watch for a tradable low in the $SPX uptrend. Similarly, the 12 area may become the new floor.
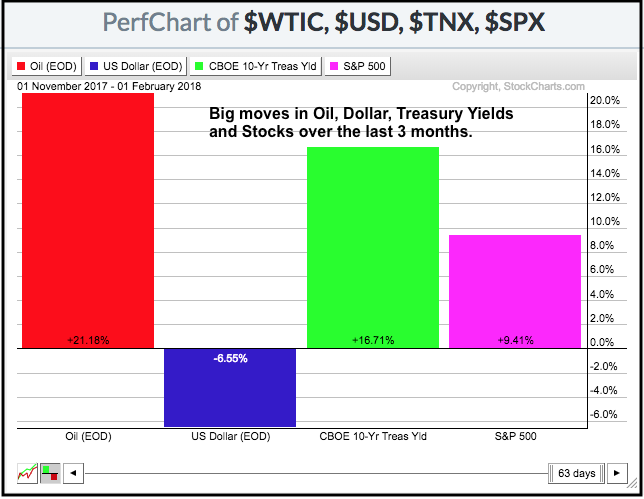
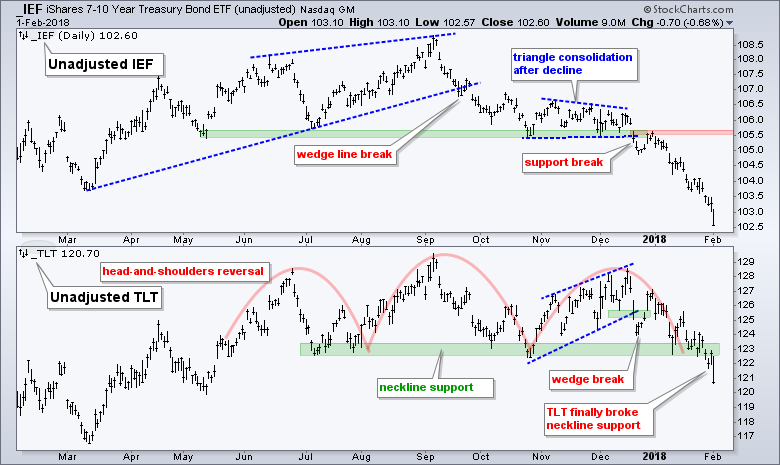
I am suggesting a new VIX range because we are seeing big moves elsewhere in the financial markets, and these could result in more volatility for stocks. The 20+ YR T-Bond ETF (TLT) broke down this week and the 10-yr T-Yield ($TNX) hit its highest level since April 2014. The US Dollar ETF (UUP) also fell sharply the last few months and hit its lowest level since late 2014. Oil is up 20% in three months.
S&P 500 Correction Targets
In his Market Message on Wednesday, John Murphy showed that the last 10% correction ended two years ago (January 2016) and the last 5% correction ended in early November 2016. The chart below hightlights three milder corrections from March to August and then a 12% moonshot from mid August to late January. In particular, notice that the March-April correction was a choppy affair that lasted around six weeks.
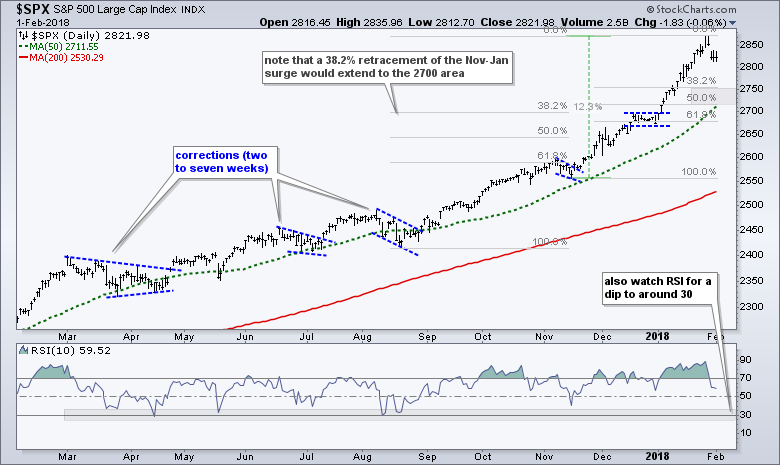
At this point, I am using three tools to estimate a correction target. First, a 38.2% retracement of the August-January advance would extend to the 2700 area. Second, a 38-50% retracement of the November-January advance would extend to the 2720-2750 area (gray shading). Third, the rising 50-day moving average is currently around 2711. A move to 2700 would represent a 6% pullback from the recent high. I would also watch RSI(10) for a dip to around 30 (oversold within an uptrend).
Watching for Oversold Breadth
I am also watching the percentage of stocks above the 50-day EMA for signs of a medium-term oversold condition. The chart below shows this indicator for the S&P 500, S&P Mid-Cap 400 and S&P Small-Cap 600. The blue vertical lines show when two of the three dipped below 30%.
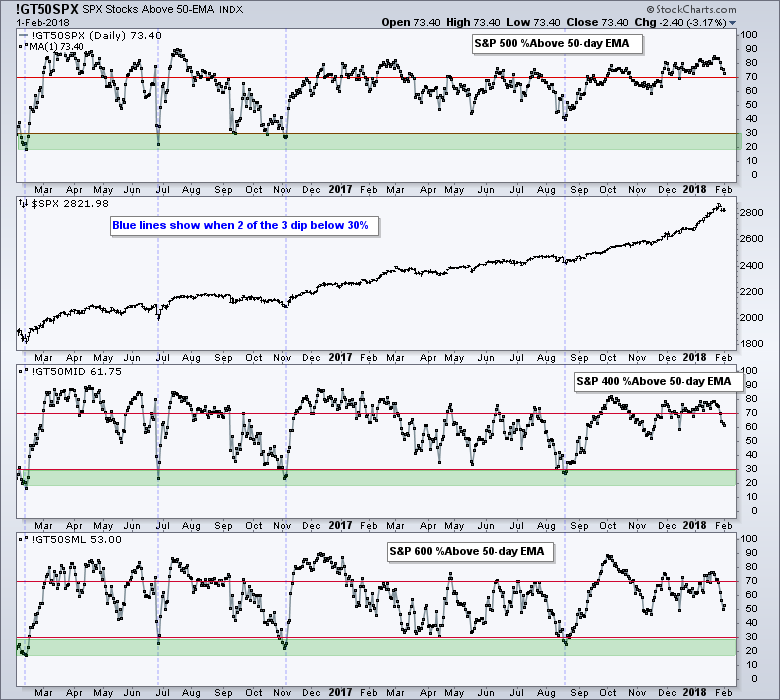
There were just four signals over the last two years (including the February 2016 signal). Chartists should become alert for a tradable low in the market when two of the three dip below 30%. Sometimes a simple move back above 30% is enough to trigger bullish.
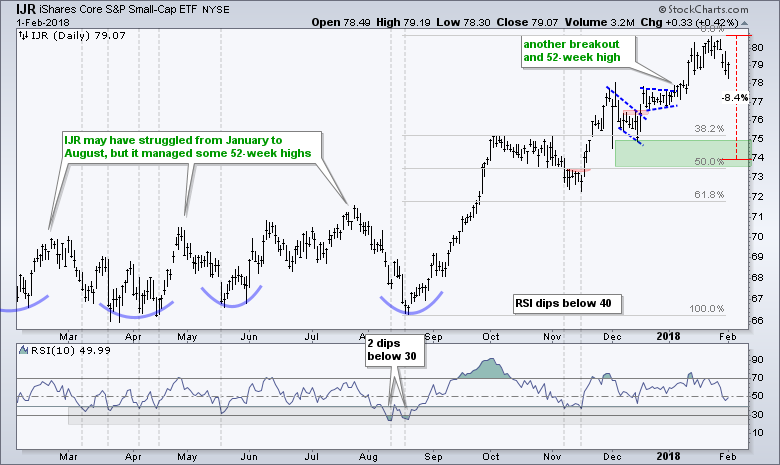
IJR and QQQ Correction Targets
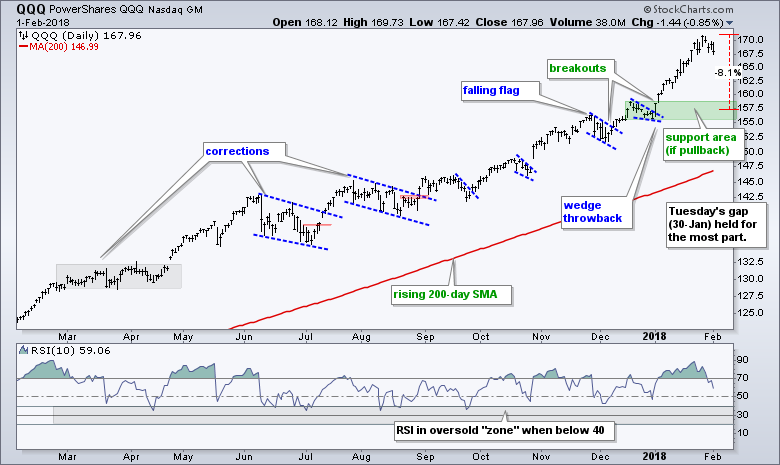
Correction targets for the Nasdaq 100 ETF, S&P SmallCap iShares, sector SPDRs and industry group ETFs could prove futile because the S&P 500 is the main driver for the stock market. The S&P 500 is the main benchmark for the market and the most widely followed index. A five to six percent decline in the S&P 500 would likely lead to bigger declines in IJR and QQQ. Nevertheless, I will attempt to mark support by place the first QQQ support zone around 157 (8% from January high) and the IJR support zone in the 74-75 area.
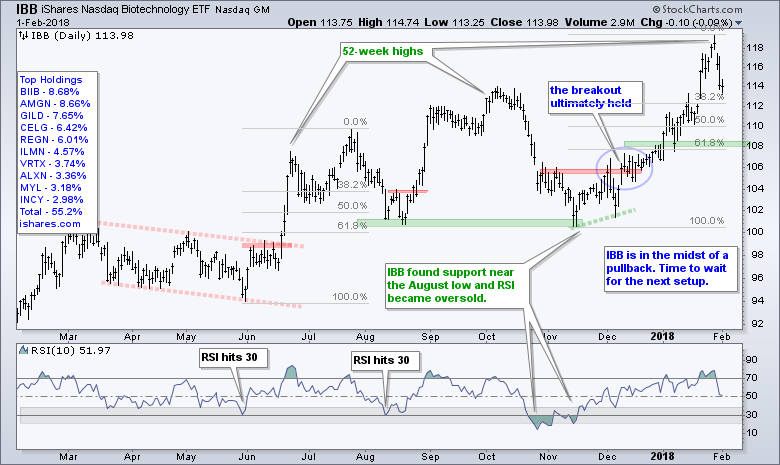
IBB Corrects from New High
The Health Care SPDR (XLV) led the market higher with a 10% gain from the end of December to late January. Healthcare stocks were then hit hard over the last three days with the Biotech iShares (IBB) falling around 4%. With a gap down and sharp decline, I am ready to mark a potential support zone to watch going forward. A 50-61.8% retracement of the November-January advance would extend to the 108-110 area. I will also be watching RSI for a dip into the 30 area (short-term oversold within an uptrend).
TLT Finally Breaks Neckline Support
The 7-10 YR T-Bond ETF (IEF) extended its downtrend again this week and the 20+ YR T-Bond ETF (TLT) broke below its support zone to confirm the head-and-shoulders reversal. Even though I am bearish on bonds, note that the decline accelerated in IEF this week and this acceleration could signal a selling climax of sorts. I would not call for a major low, but we could see an oversold bounce sooner rather than later.
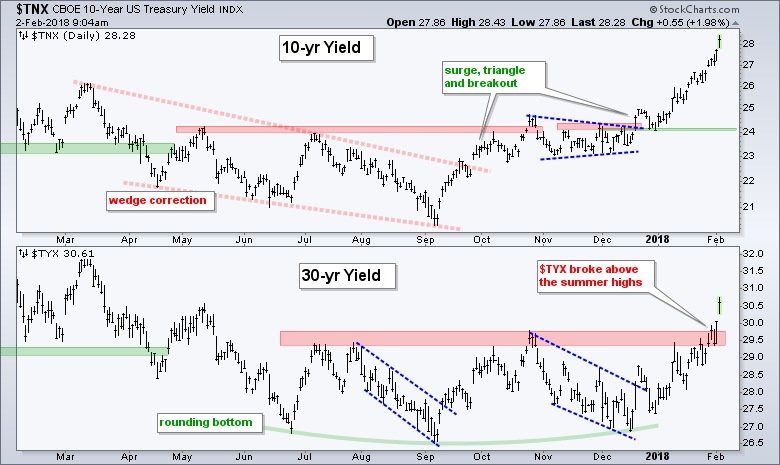
The 10-yr T-Yield ($TNX) surged again on Friday morning and moved above 2.8% for the first time since early April 2014. The 30-yr T-Yield ($TYX) finally broke above its resistance zone to confirm the rounding bottom.
Gold Maintains Upswing as Dollar Falls
The Gold SPDR (GLD) remains in a steep upswing that is defined by the Raff Regression Channel (green lines). The bigger trend is also up since December 2016 with a series of higher highs and higher lows. At this point, I remain focused on upswing support at 125.8 (green area). A break here would reverse the upswing.
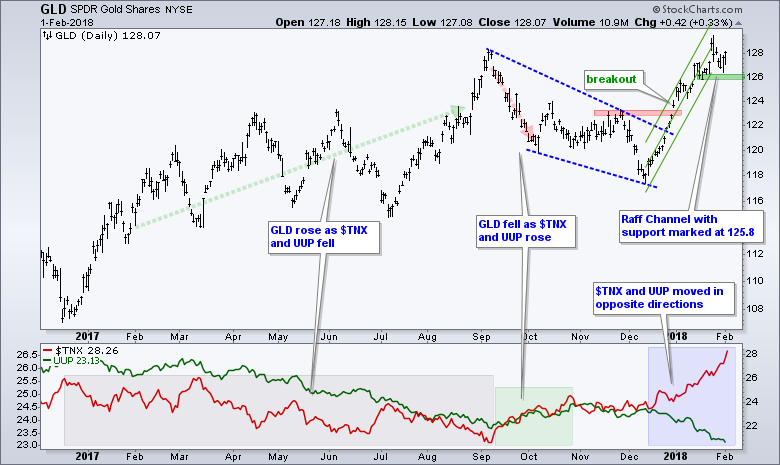
The indicator window shows the 10-yr T-Yield (red) moving sharply higher and the US Dollar ETF (green) moving sharply lower since mid December. There is a bit of a disconnect between these two and this one reason I think volatility could rise in the stock market. Gold is focused on a weak Dollar right now.
Notes from the Art's Charts ChartList
- The Home Construction iShares (ITB) fell to its first support zone and RSI(10) moved below 30 for the first time in over a year.
- The Broker-Dealer iShares (IAI) hit a new high on Thursday and the Regional Bank SPDR (KRE) broke out of a falling flag (thanks, $TNX).
- The REIT iShares (IYR) broke below the Sep-Oct lows and then turned volatile the last few weeks. The break is holding for the most part and it is bearish.
- The Solar Energy ETF (TAN) fell back with a falling flag that retraced 50-61.8% of the prior advance and RSI moved to 32.
- The Biotech iShares (IBB) and Biotech SPDR (XBI) hit new highs on Monday and then fell back sharply. Time to wait for the next setup (pullback within an uptrend).
- The Oil & Gas Equip & Services SPDR (XES) reached its first potential reversal area with a 50% retracement of the December-January surge and RSI dipped below 40.
- The Copper Miners ETF (COPX) did not hold its flag breakout as trading turned choppy. Broken resistance and the 38-50% retracement zone mark first support.
- The Gold Miners ETF (GDX), which has gone nowhere for a year, is testing upswing support in the 23.3-23.5 area.
- The Metals & Mining SPDR (XME) and the Steel ETF (SLX) kicked into corrective mode this week with sharp pullbacks. The first and second support levels are marked on the charts.
- The Telecom iShares (IYZ) did nothing this week and remains within an eight week consolidation.
Videos with Interesting Takes
Ian Bremmer talks global geopolitical risks and the rise of China.
Tony Dwyer, Canaccord Genuity, discusses the VIX, correction issues and what sectors to buy at lows.
Craig Johnson CMT, Piper Jaffray, and Michael Bapis, Bapis Group at Hightower, discuss Tuesday's sell-off in markets with Brian Sullivan.
Forget the iphone numbers.... Gene Munster talks about the growth in Apple services and the number of active hardware users for Apple products.
Plan Your Trade and Trade Your Plan.
- Arthur Hill, CMT
Senior Technical Analyst, StockCharts.com
Book: Define the Trend and Trade the Trend
Twitter: Follow @ArthurHill


