- XLK is Near Top of 2018 Range.
- XLE is Near Bottom of 2018 Range.
- Year-to-date Ranks for Equal-Weight Sectors.
- And Then There was One.
- EW Consumer Discretionary ETF Underperforms.
- Scanning the Major Indexes.
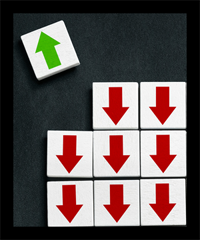
- Majority of Stocks are Struggling.
- Non-Confirmation Among the Offensive Sectors.
 XLK is Near Top of 2018 Range...
The first chart shows the Technology SPDR (XLK) with 40-day Fast Stochastics (40,1). I chose 40-days because this covers 2018 and the range year-to-date. Study this indicator because we will be using it for the next few sections.
The shaded area on the chart shows the 2018 price range from around 61 to 70. Notice that XLK is trading near the top of this range and was the only sector to record a 52-week high this month.

The indicator window shows the 40-day Fast Stochastic Oscillator above 80 and near the top of its range. This makes since because the Stochastic Oscillator measures the position of the current price (68.17) relative to the high low range (60.87 to 69.70). High values mean the close is near the upper end of the price range of the last 40 days.
XLE is Near Bottom of 2018 Range
In contrast to XLK, we can see that the Energy SPDR (XLE) is near the bottom of its 2018 range and the 40-day Fast Stochastic is below 20.
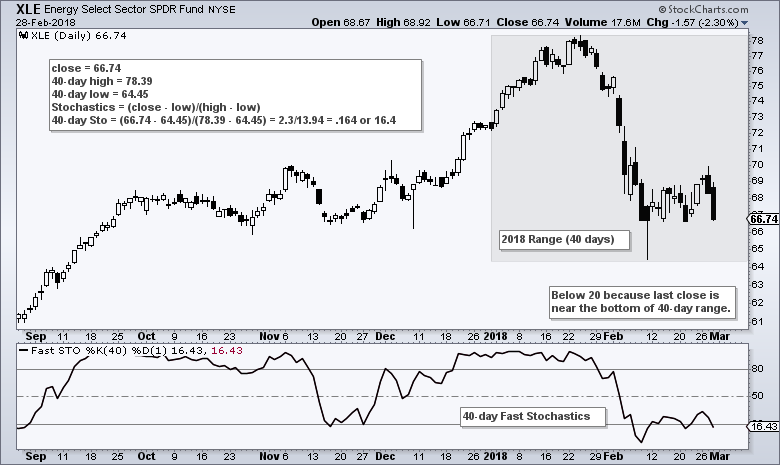
XLK clearly attracted more buying pressure because prices moved to the top of their 2018 range over the last two weeks. This also shows that XLK had one of the strongest recovery bounces. XLE, on the other hand, remained under pressure and had one of the weakest recovery bounces.
Recap: The Stochastic Oscillator measures the position of the close relative to the high-low range over the lookback period. High values mean the close is near the upper end (buying pressure), while low values indicate that the close is near the lower end (selling pressure).
Year-to-date Ranks for Equal-Weight Sectors
Chartists can rank by the Stochastic Oscillator in a scan to find the leaders and the laggards over a period of time. In the example below, I am going to rank the nine equal-weight sector ETFs, the EW S&P 500 ETF (RSP) and SPY by the 40-day Fast Stochastic Oscillator (%K). I am using the equal-weight versions because they reflect performance for the "average" stock in the sector.
[symbol is 'RYT'] or [symbol is 'RYF'] or [symbol is 'RGI']
or [symbol is 'RCD'] or [symbol is 'RYH'] or [symbol is 'RHS']
or [symbol is 'RYE'] or [symbol is 'RTM'] or [symbol is 'RYU']
or [symbol is 'EWRE'] or [symbol is 'RSP'] or [symbol is 'SPY']
Rank by Fast Stoch %K(40,1)
The scan uses [Symbol is 'XLK'] to insert these symbols individually, but StockCharts members can also create a ChartList with these symbols and scan the ChartList. The last line of the scan uses the "Rank by" function to sort by the Stochastic Oscillator value.
And Then There was One
The image below shows the results from this scan and the results are telling. SPY and RSP act as benchmarks of sorts. The EW Technology ETF (RYT) is the only one above 80 and the only one above the benchmark (SPY). Basically, only one sector managed to get close to its prior high during the February bounce. This lack of participation is not a good sign for the broader market.
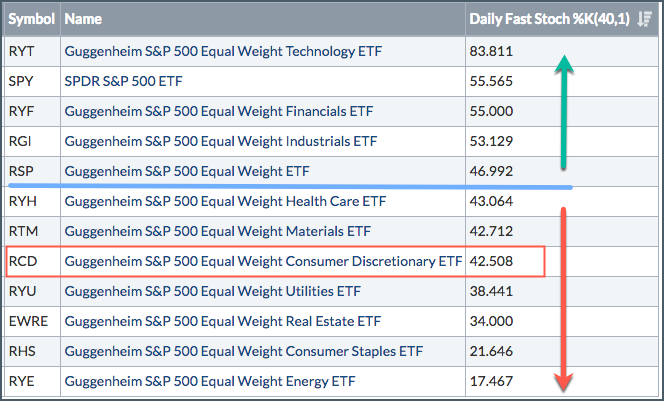
The EW Finance ETF (RYF) and EW Industrials ETF (RGI) are above 50 and above the EW S&P 500 ETF so they are "outperforming" in a certain way. However, a 40-day Stochastic Oscillator around 55 means both are trading in the middle of their 2018 range, which is hardly a vote of confidence. Furthermore, the Stochastic Oscillator for the EW S&P 500 ETF is well below that of SPY and below 50, which means the average stock in the S&P 500 is not performing so well.
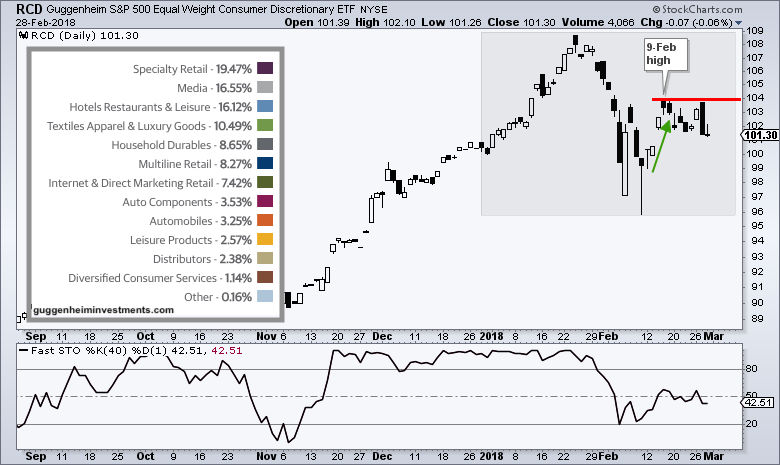
EW Consumer Discretionary ETF Underperforms
Everything under the RSP value (46.9) can be considered underperforming this year. I am especially concerned with relative weakness in the EW Consumer Discretionary ETF (RCD) because it is the most economically sensitive sector. I covered the Home Construction SPDR (ITB) and Retail SPDR (XRT) on Tuesday and these two groups feature prominently in the sector.
We cannot really use RCD for trading because of low volume, but it is still useful for analysis. The ETF surged with the rest of the market from February 9th to 15th (green arrow). RCD then stalled out and did not move above the 9-February high (red line). This is negative until proven otherwise. A break above 104 is needed for a breakout and signal that the consumer discretionary is participating.
Scanning the Major Indexes
We can take this Stochastic Oscillator concept one step further to find the percentage of stocks that are struggling this year.
The Stochastic Oscillator ranges from 0 to 100 with 50 acting as the centerline. Think of 50 as the 50-yard line in football (American football!). I rarely use the exact centerline and prefer to add a buffer for bullish and bearish thresholds. In general, a stock with a 40-day Stochastic Oscillator above 60 is holding up relatively well, and anything below 40 is struggling. The cup is half full above 60 and half empty below 40.
Here is the scan code that I will run:
[group is SP500]
// [group is SP400]
// [group is SP600]
and [Fast Stoch %K(40,1) < 40]
Rank by Fast Stoch %K(40,1)
The two forward slashes are used to "comment out" the S&P Mid-Cap 400 and S&P Small-Cap 600 because I will only scan for one index at a time. In this case I am only scanning for the S&P 500.
Majority of Stocks are Struggling
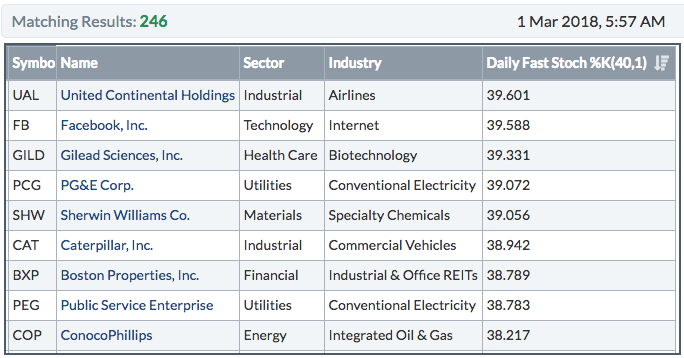
The table below shows that 246 stocks in the S&P 500 are trading with the 40-day Stochastic Oscillator below 40 (cup is half empty). This is around half of the index and this is not a positive sign because at least half of the index is struggling. In fact, it simply reinforces my view that we are still in a corrective period for the broader market and this correction has yet to fully run its course.
The results deteriorate even more when moving to small and mid caps. As of Wednesday's close, 232 (58%) of stocks in the S&P Mid-Cap 400 are struggling (40-day Stochastic Oscillator below 40). Furthermore, 348 (58%) of stocks in the S&P Small-Cap 600 are struggling and remain well below their 2018 highs.
Non-Confirmation Among the Offensive Sectors
The next chart shows the four offensive sector SPDRs. The Technology SPDR (XLK) hit a new high, but the Industrials SPDR (XLI), Financials SPDR (XLF) and Consumer Discretionary SPDR (XLY) did not even challenge their late January highs.
Most of us are familiar with Dow Theory and the concept of confirmation between the Dow Industrials and Dow Transports. Basically, the two averages need to confirm one and other for signals. A non-confirmation occurs when one makes a new high and the other does not.
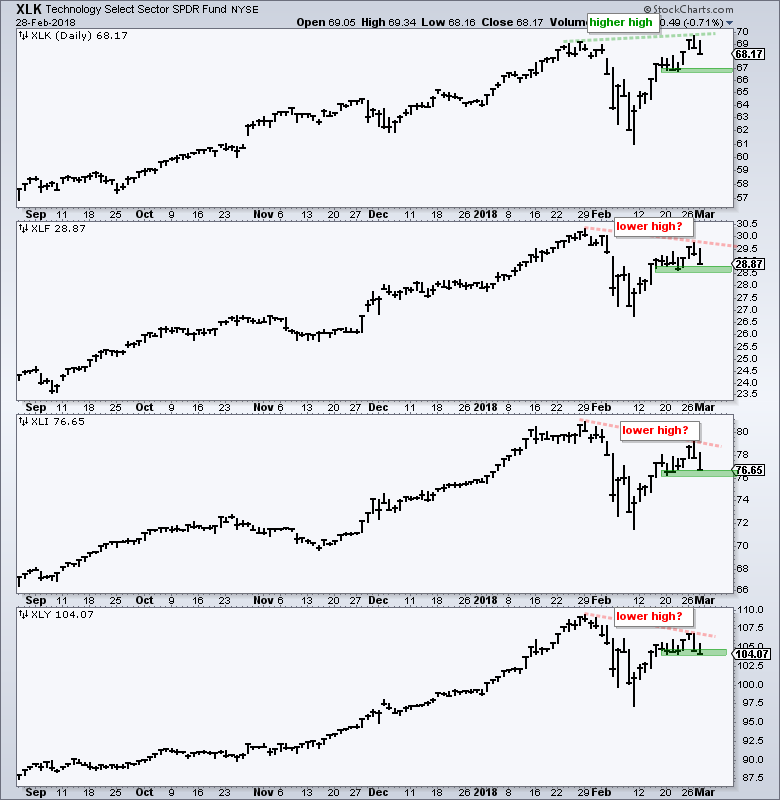
Three of the four offensive sectors formed lower highs and did not confirm the higher high in XLK. I consider this quite negative and it means the market bounce narrowed in February. Also note that the Materials SPDR (XLB) and Health Care SPDR (XLV) are also forming lower highs.
The technology sector is still in a long-term uptrend and by far the biggest sector in the S&P 500, but there is clearly "less strength" outside of technology. Lower highs in five of the six leading sectors bodes ill for the broader market and reinforces my view that we are still in a corrective period.
Note that the Energy SPDR (XLE), Consumer Staples SPDR (XLP), Real Estate SPDR (XLRE) and Utilities SPDR (XLU) are not considered leading sectors because they are already in bear mode. Just take a look at their 40-day Stochastic Oscillator values.
Plan Your Trade and Trade Your Plan.
- Arthur Hill, CMT
Senior Technical Analyst, StockCharts.com
Book: Define the Trend and Trade the Trend
Twitter: Follow @ArthurHill


