- Pullbacks versus Corrections versus Bull Markets.
- Objective Uptrend and Subjective Correction.
- VIX Moves Back above 20.
- Gold Firms at Support Zone.
- Legendary Trader Sounds the Alarm.
- Trend Followers Know What they Don't Know.
- CNBC Interview with Tobias Levkovich.
- Notes from the Art's Charts ChartList.
 Pullbacks, Corrections and Bull Markets...
There is nothing special about the number three, but three is a good number when it comes to simplifying and classifying price movements. We run the risk of getting too granular or too macro when there are more classifications.
Charles Dow noted that there are three market movements: the primary trend, the secondary trend and daily fluctuations. Using this as my basis, I would suggest that we have the long-term trend, corrections and pullbacks.
The long-term trend basically tells us if we are in a bull or a bear market. I use breadth indicators and the golden cross for the S&P 500 to determine if we are in a bull market environment or a bear market environment. I do not know how long the trend will last or when it will reverse. It will simply last until the evidence suggests otherwise.
Pullbacks are one to four week events that occur within the uptrend. They could also be considered corrections with a small "c". Typically we see 10-period RSI dipping to the 30 area as short-term momentum becomes oversold and bullish continuation patterns take shape. These can be falling wedges, falling flags, triangles or flag trading ranges.
Corrections with a capital "C" are longer than pullbacks, but not quite enough to reverse the long-term uptrend. Corrections are tricky because they last longer than pullbacks, but do not follow an easily defined script. A correction can last four to twelve weeks and takes many shapes (give or take a few weeks).
Sometimes we see a correction turn into a bear market and sometimes this bear market signal works wonders, such as October 2000 and January 2008. Sometimes we get whipsaws as corrections end quickly and the bull market resumes, such as August 2011, September 2015 and January 2015. Whipsaws are unavoidable and all part of the process.
Objective Uptrend and Subjective Correction
The long-term trend for the S&P 500 is up because the 50-day SMA is above the 200-day SMA and price is above the rising 200-day SMA. In addition, five of the nine breadth indicators remain on bullish signals. This is the objective part of the equation.
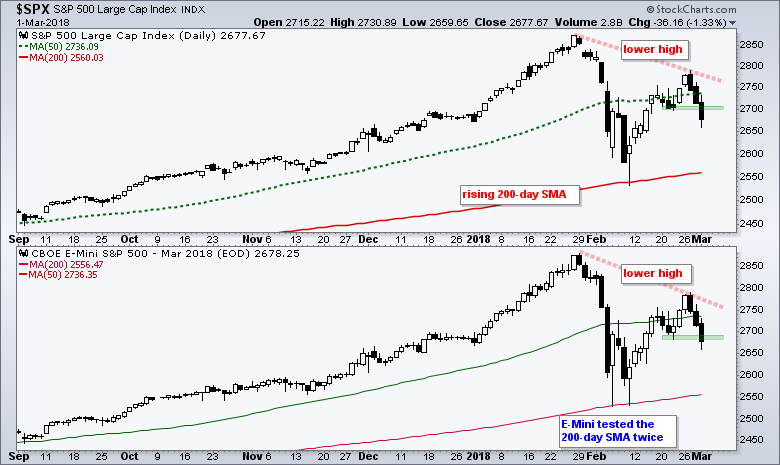
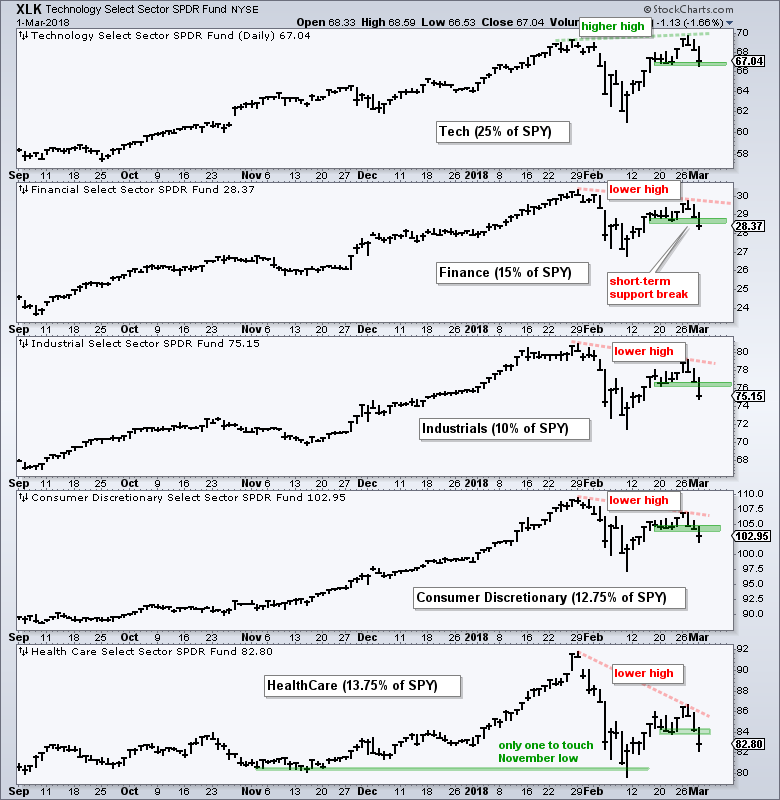
I think (subjective) we are in a correction because four of the nine breadth indicators are bearish (16-Feb report), the volatility range is shifting higher (2-Feb report), participation is narrowing (1-Mar report) and a lower high formed this week in several sector SPDRs. It also looks like the short-term uptrend reversed in the S&P 500 with the support break at 2700.
The obvious target is another test of the 200-day SMA in the 2570 area on the cash S&P 500 ($SPX). Targeting, however, is a dangerous business because it involves the future (think Yogi Berra). In any case, I will remain in the correction camp until I see improvement in breadth and participation. This means I still favor fishing over trading and investing.
VIX Moves Back above 20
The next chart shows the S&P 500 with RSI, the VIX and the Percentage of S&P 500 Stocks Above the 50-day EMA. First, I am not even going to try and mark support because it is pretty much a lesson in futility. A lower high formed and the short-term upswing reversed. The trend is down so picking the next support level is pretty much a lesson in futility.
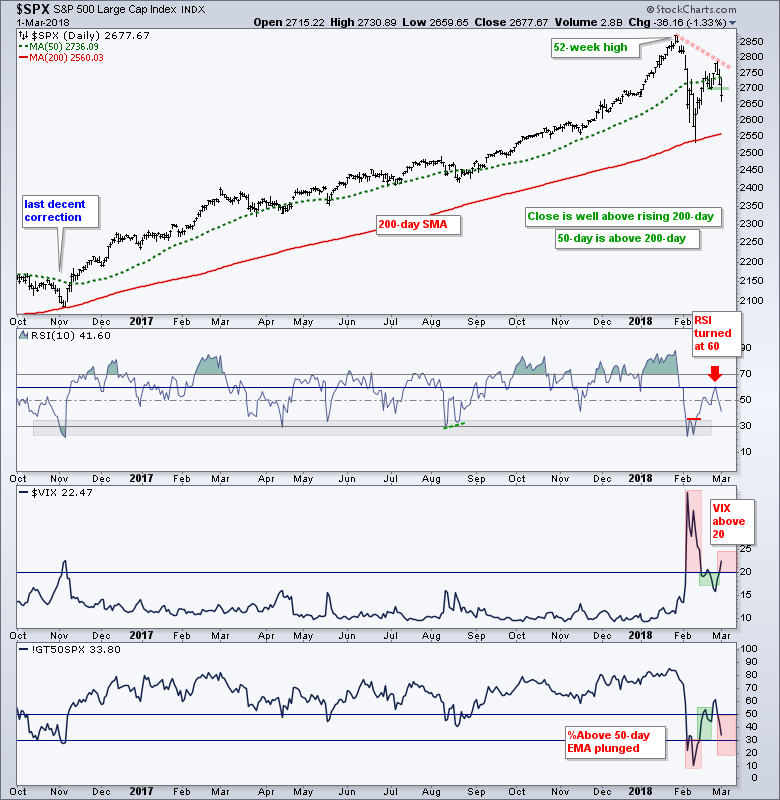
The S&P 500 Volatility Index ($VIX) moved back above 20 and this has been my line in the sand. Anything above 20 shows excessive fear and this is negative for the market. The S&P 500 %Above 50-day EMA (!GT50SPX) moved from 61% to 38% over the last three days and this reflects a swift decline in most stocks.
Richard Russell (RIP) of Dow Theory Letters used to say that the investor or trader that loses the least is the winner in a bear market. That's a paraphrase. While I don't think we are in a bear market, I think we are in a corrective period and most stocks and industry groups will be affected. This is why it is often a fool's errand to have long positions during a broad market correction or bear market.
Gold Firms at Support Zone
Gold backed off of a 52-week high and hit support this week. First and foremost, the long-term trend is up because the Gold SPDR (GLD) hit 52-week highs in September and January. This means we should have a bullish bias when looking at the chart.
Second, GLD broke out with a surge in December and returned to the breakout zone this week. This zone also represents a 50-61% retracement of the Dec-Jan advance. The decline back to the breakout zone formed a falling flag/channel and this is a bullish continuation patterns. A breakout at 128 would be bullish.
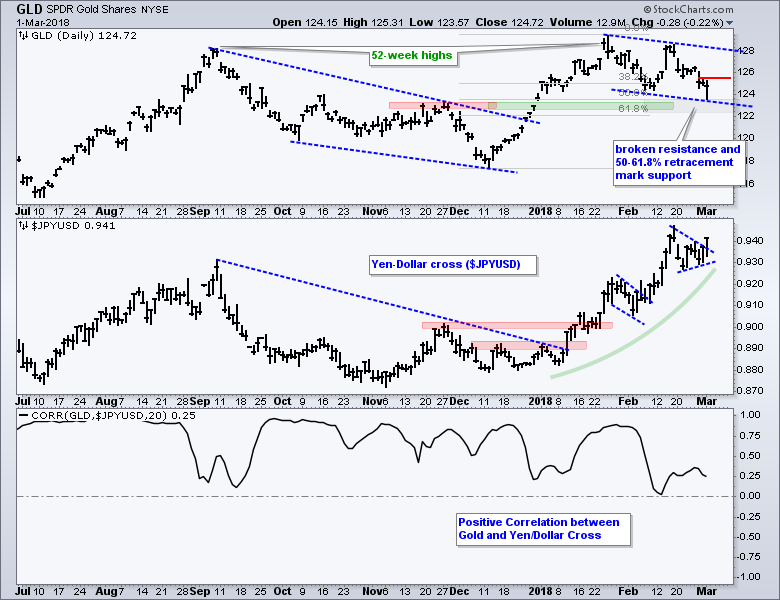
The swing within the falling flag/channel is down but notice how GLD closed near 125 the last three days. Gold is firming and I am marking downswing resistance at 125.5, a break of which would provide the first sign of strength.
The middle window shows the Yen-Dollar Cross ($JPYUSD) and the lower window shows the correlation to GLD. Notice that the correlation is strongly positive and Yen-Dollar has been rising throughout 2018. Yen-Dollar also broke out of a pennant on Thursday and this is positive for gold.
Legendary Trader Sounds the Alarm
I don't normally read ZeroHedge, but they published Allison Nathan's interview with legendary trader Paul Tudor Jones and he is enough to make me click. Jones is quite negative on stocks and bonds, but bullish on commodities and hard assets.
Trend Followers Know What they Don't Know
I have been going through the podcasts at toptradersunplugged.com, a website from Niels Kaastrup-Larsen. Most recently, I listened to a two-part series on Trend Following with Katy Kaminski, Alex Greyserman and Roberto Osorio. Episodes 95 and 96.
It is very high level stuff that sometimes gets geeky, but worth a listen and here are two big takeaways for trend following systems. There are three parts to a trade: entry, exit and position size. Entry is the least important part of the system, but it seems to command the most attention. Second, trend following works because trend followers "know what they don't know". This last nugget comes from Jack Schwager.
What does Schwager mean? He means that trend followers do not know how long a trend will last, where support and resistance will be found or when the trend will reverse. All they know is the CURRENT direction of the trend and they simply ride it until it reverses. There will likely be many whipsaws along the way, but that is just the cost of doing business because a few good trends will pay for these whipsaws.
CNBC Interview with Tobias Levkovich
Tobias Levkovich favors cyclicals over defensives and value over growth in an environment with rising inflationary expectations.
Notes from the Art's Charts ChartList
- The Home Construction iShares (ITB) is still near the 61.8% retracement and oversold, but broke the triangle line and hit a new low for 2018. This is one of the weakest industry group ETFs.
- The Retail SPDR (XRT) has one of the weaker bounces in mid February and broke below short-term support on Thursday.
- HACK is a leader because it exceeded its January high. Not sure which level to watch on a pullback because this ETF is exceptionally volatile.
- The Semiconductor SPDR (XSD) is lagging the rest of the tech group because it fell short of its January high during the February rebound.
- The Broker-Dealer iShares (IAI) challenged the January high and then fell back. Short-term support is set at 64.8 and long-term support at 60.
- The Regional Bank SPDR (KRE) is still one of the strongest ETFs because it reached its January high, but it is unlikely to move higher if the broader market corrects.
- The iShares Aerospace & Defense ETF (ITA) is one of the stronger ETFs because it recorded a new high this week. Watch the 190 area on a pullback.
- The Biotech iShares (IBB) failed to hold the flag breakout and moved below the prior week's low. A big support zone is near, but it may take a while for IBB to find its footing.
- The HealthCare Providers ETF (IHF) and Medical Devices ETF (IHI) reversed near their 61.8% retracements.
- The Oil & Gas Equip & Services SPDR (XES) is one of the weakest ETFs in the market in 2018 and should, therefore, not be on any watchlist for long positions. A break above 16 is needed to change this opinion. #backtobasics
Plan Your Trade and Trade Your Plan.
- Arthur Hill, CMT
Senior Technical Analyst, StockCharts.com
Book: Define the Trend and Trade the Trend
Twitter: Follow @ArthurHill


