- Separating the Leaders from the Laggards.
- Flying Flags for Commercial Metals and Nucor.
- Broker-Dealer iShares Leads with New High.
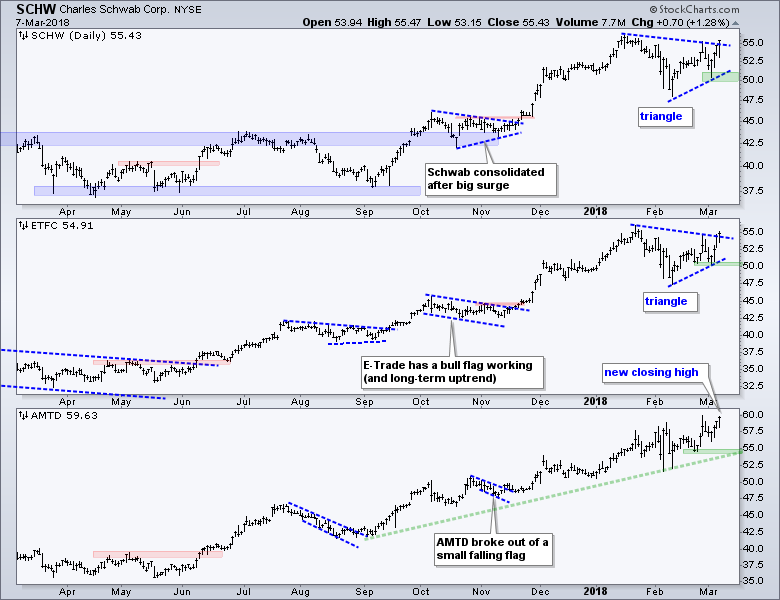
- Morgan Stanley and the 3 Discount Brokers.
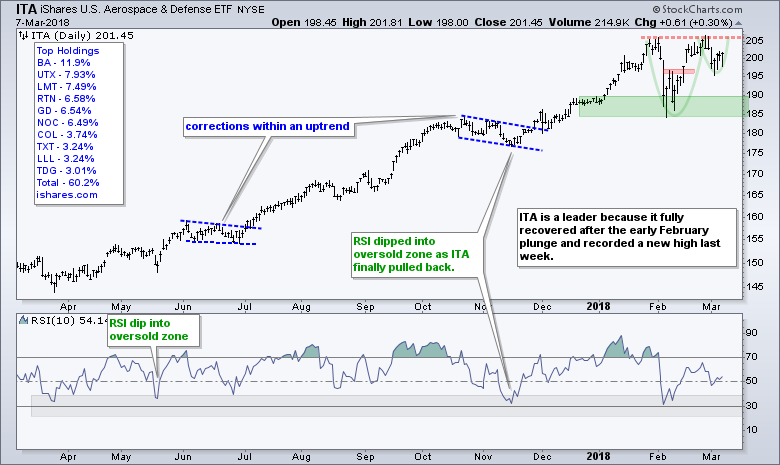
- Defense and Aerospace ETF Fully Recovers.
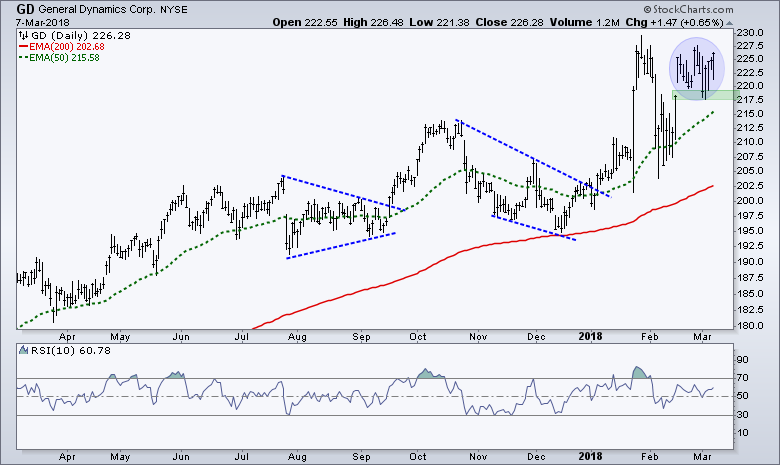
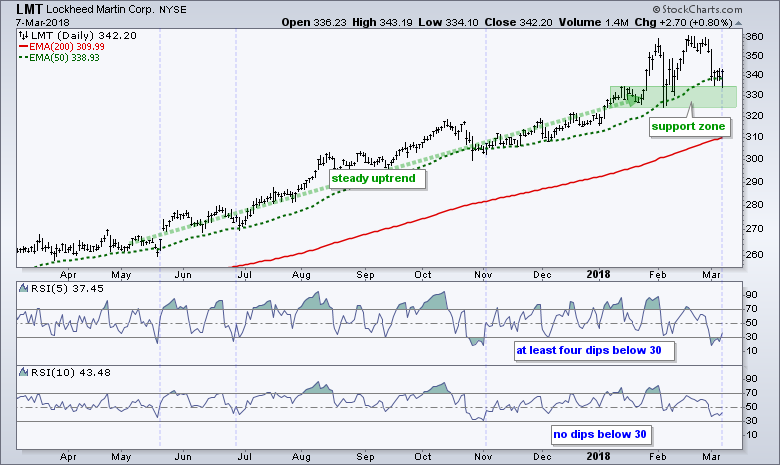
- General Dynamics and Lockheed Martin.
- Verisign, Bristol-Meyers and Fastenal.
 Finding the Strongest Stocks....
When dealing with stocks, we can improve our odds by focusing on stocks in long-term uptrends and stocks showing "chart strength". The charts further down in this commentary highlight stocks with both characteristics.
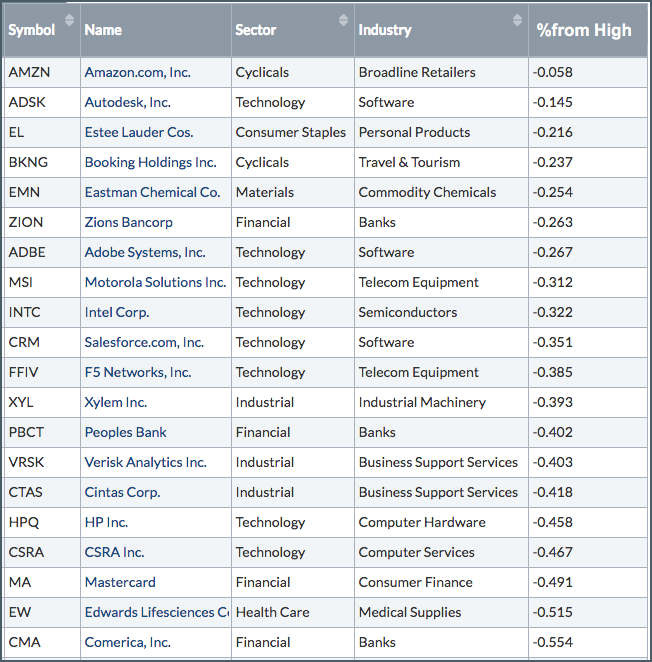
First, each stock recorded a 52-week high this year with most hitting 52-week highs in February. Stocks hitting new highs have strong charts. The more recent the 52-week high, the more recent the strength.
Second, each stock is in a long-term uptrend. The 50-day EMAs are above the 200-day EMAs, and the last close is also above both EMAs. Note that I ran a scan for the S&P 500. Of the 500, 221 stocks (44%) fit these criteria (long-term uptrends).
[group is SP500]
AND [Close > EMA(50,close)]
AND [Close > EMA(200,close)]
AND [PPO Line(50,200,0) > 0]
Rank by [[[close - max(250,high)] / close] * 100]
The table below shows the top twenty stocks in the S&P 500, as ranked by the percent below the 52-week high. This is the last line in the scan code above. The smaller the number, the closer the stock is to a 52-week high. Stocks closest to 52-week highs show serious chart strength and are clear leaders.
For what it is worth, I also ran a scan looking for stocks in long-term downtrends. The 50-day EMA is below the 200-day EMA and the last close is below both EMAs. 101 stocks (20%) qualified and this means a fifth of the S&P 500 is in a long-term downtrend. This is a bit high and explains erratic trading over the last six weeks.
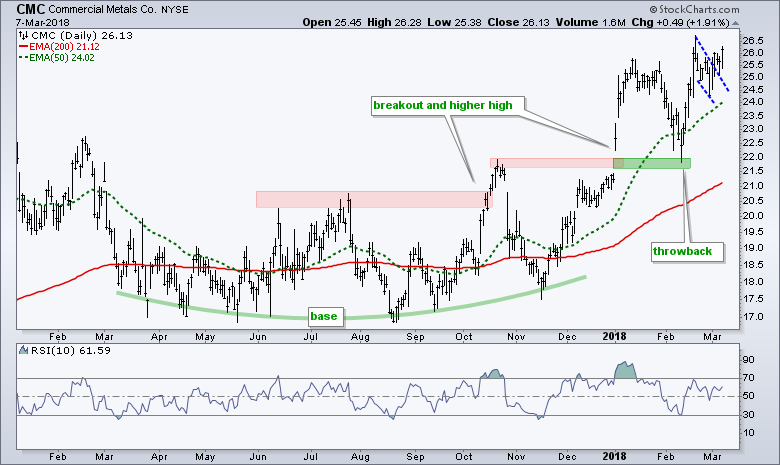
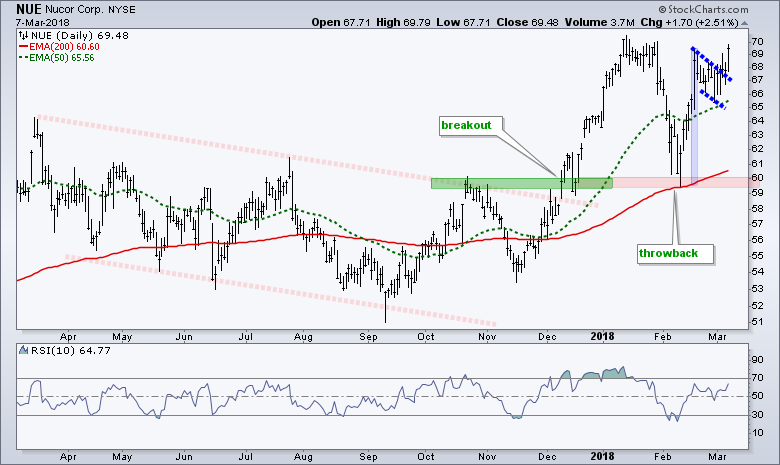
Flying Flags for Commercial Metals and Nucor
I have no idea how the steel tariffs will play out and the exact effect on domestic steel companies. This is a "fluid" issue that could produce some violent swings in the industry.
I mentioned the tariff issue because the first two stocks are steel stocks. I don't like to talk fundamentals because I do not study the fundamental stories indepth. I study the charts! Stories can get in the way of what is happening on the price charts. Price does not lie and tells the real story.
Commercial Metals (CMC) formed a large base or rounding bottom from March to November. The stock first broke out in October and formed another higher high with a surge in early January. After a throwback into mid February, the stock surged to a new high and then formed a falling flag. The CMC broke the flag line late last week and the uptrend looks set to continue.
The next chart shows Nucor (NUE) with a surge in the second half of February, a falling flag into early March and a flag breakout this week.
Broker-Dealer iShares Leads with New High
The next four stocks come from the Financials SPDR (XLF) and three come from the Broker-Dealer iShares (IAI). Note that IAI recorded a new high on Wednesday and is one of the strongest industry group ETFs right now. The late February and early March lows mark first support in the 64-65 area.

Morgan Stanley and the 3 Discount Brokers
Morgan Stanley (MS) has been in a steady uptrend since the breakout in June with a series of higher peaks and higher troughs. The stock formed a possible cup-with-handle the last seven weeks and this is a bullish continuation pattern.
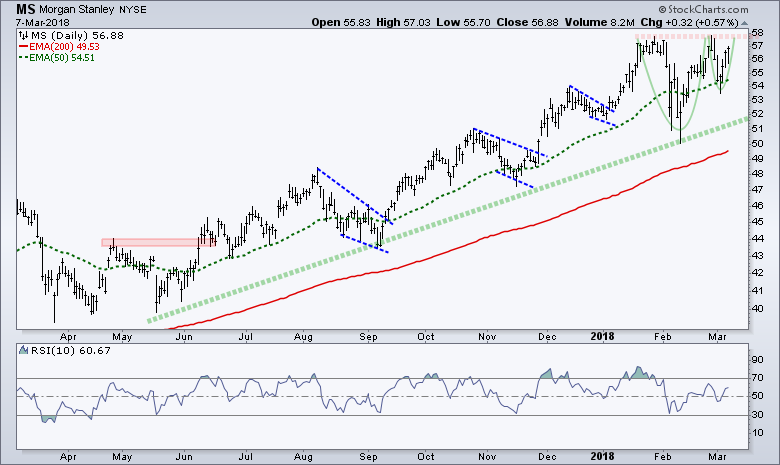
Even though I marked rim resistance at 58, I think resistance is a bit of a misnomer in an uptrend. Higher highs are expected in an uptrend so we should not be surprised when prices move above a prior high. This is the reason I rarely mark resistance levels when the trend is up.
I featured the discount brokers in mid November as all three formed bullish consolidations (see black call out notes on chart below). Schwab (SCHW) and E-Trade (ETFC) hit new highs in January and then consolidated with triangles. Both broke above the upper lines with strength on Wednesday and are close to new highs. The lower window shows the leader, TD Ameritrade (AMTD) hitting a new (closing) high in Wednesday.
Defense and Aerospace ETF Fully Recovers
The iShares Aerospace & Defense ETF (ITA) is also one of the strongest industry group ETFs right now with a fresh 52-week high in late February. The ETF fell back below 200 last week and edged higher the last four days. The long-term trend remains up and a cup-with-handle could be taking shape.
General Dynamics and Lockheed Martin.
General Dynamics (GD) sports an uptrend over the past year with a 52-week high in early February. Trading turned quite volatile the last five weeks and this makes it a challenge to define clear patterns. I would suggest, however, that the blue circle marks a consolidation after the mid February surge-gap and this is a bullish continuation pattern.
I normally use 10-day RSI for stocks, but some stocks are just not volatile enough to push RSI to oversold levels. 10-day RSI did not dip below 30 the entire year for LMT. This is testament to the strength of the uptrend and to the relatively low volatility.
I increased sensitivity in RSI by changing from 10 to 5 periods and now we have some oversold levels. The chart shows LMT falling back to the support zone and the rising 50-day EMA. RSI(5) also moved back above 30 on Wednesday. The blue vertical lines show prior occurrences when RSI(5) moved back above 30. Thus, LMT looks poised for an oversold bounce within a bigger uptrend.
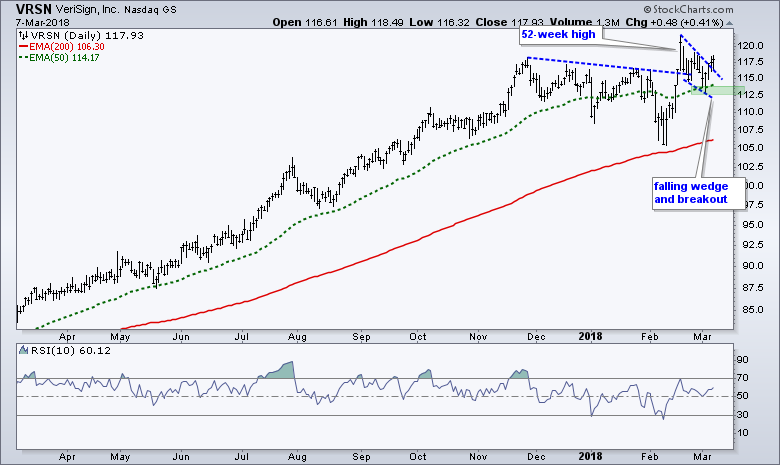
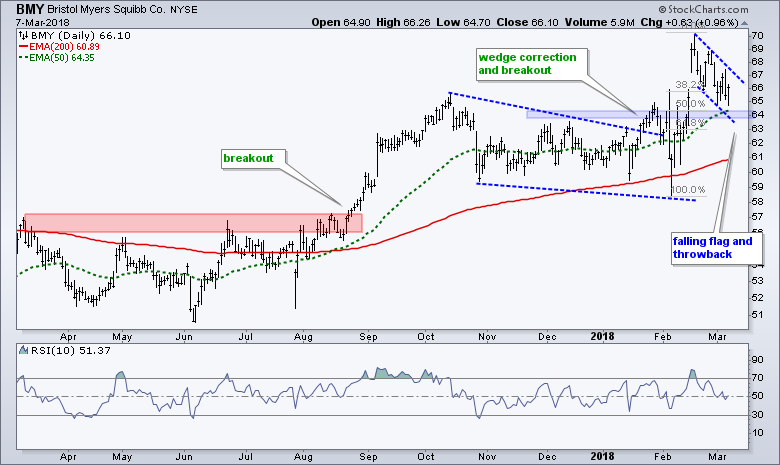
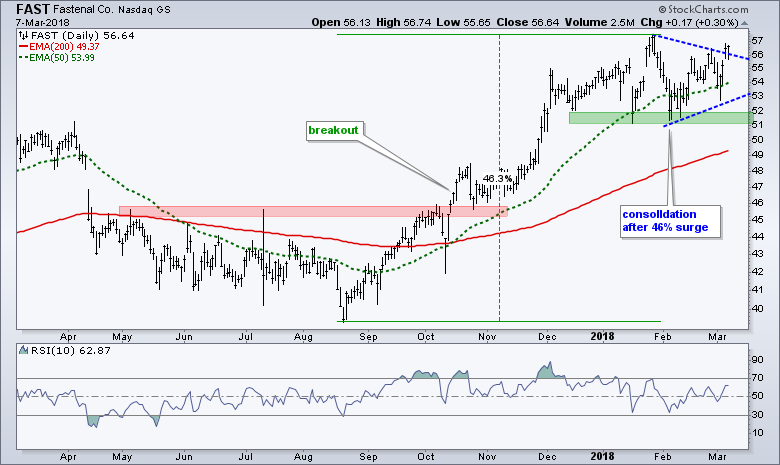
Verisign, Bristol-Meyers and Fastenal
Plan Your Trade and Trade Your Plan.
- Arthur Hill, CMT Senior Technical Analyst, StockCharts.com
Book: Define the Trend and Trade the Trend
Twitter: Follow @ArthurHill


