- Gold and the Dollar Hit Inflection Points.
- Dollar Bumps Into Short-term Resistance.
- Gold Miners Underperform Gold.
- GDX Tests Low End of Range.
 Gold Channels Harden...
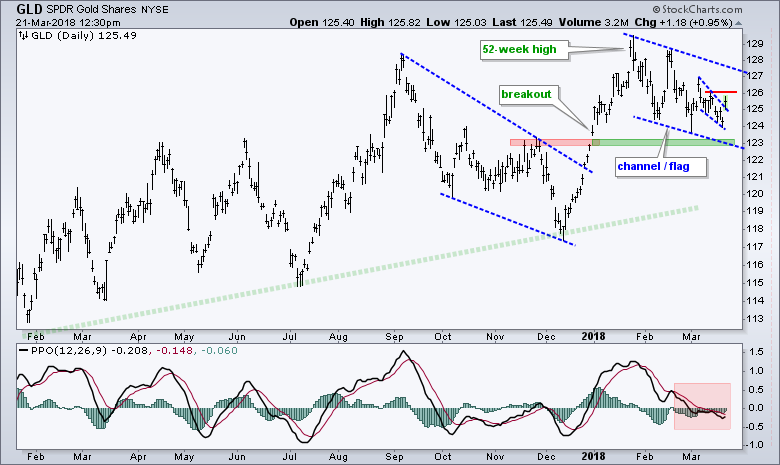
For the third time in six weeks, the Gold SPDR (GLD) is surging above the 125 level and making a bid to reverse within a larger corrective pattern. The first two attempts turned into head fakes worthy of James Harden so I will be watching for a little help from the Dollar, which is negatively correlated to gold.
The first chart shows the Gold SPDR hitting a new high in late January and falling back with a channel over the last eight weeks. This channel could be a fat flag, which would be a bullish continuation pattern. Continuation patterns typically represent a rest or correction within the trend and a breakout at 128 would signal a resumption of the bigger uptrend.
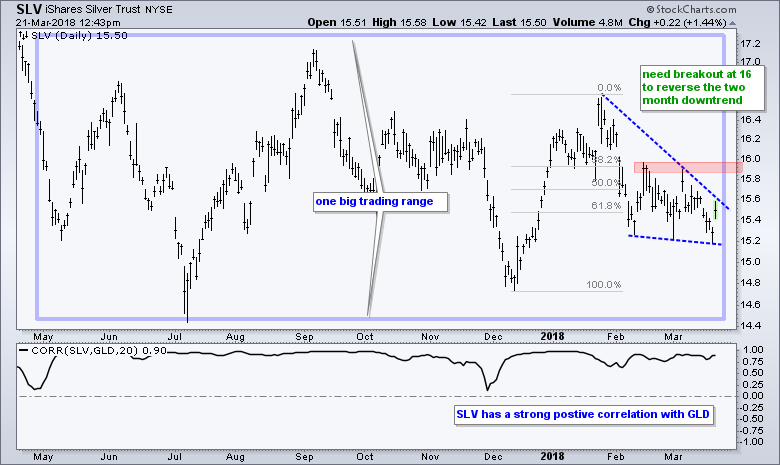
My eyes are on the 126 level first because a breakout here would reverse the downswing within the channel. The indicator window shows the PPO below its signal line since February 20th. Chartists can also watch this momentum indicator for signs of an upturn. The chart below shows the Silver iShares (SLV) for reference.
Dollar Bumps Into Short-term Resistance
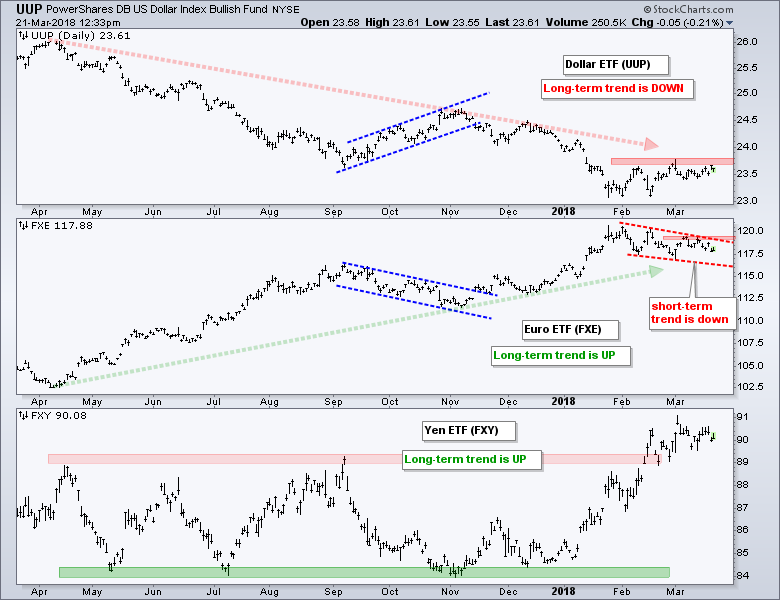
The Dollar and gold are negatively correlated so chartists should also keep a close eye on the greenback. A negative correlation means they tend to move in opposite directions. Note that the Euro is 57.6% of the Dollar ETF so chartist should also watch the Euro ETF (FXE). The Yen is 13.6% and the British Pound is 11.9%.
The top window shows UUP in a long-term downtrend and bumping up against short-term resistance. A breakout would be short-term positive and could derail the bounce in gold. A breakout here, however, would not be enough to reverse the long-term downtrend, which would require a break above the November high.
The middle window shows FXE in a long-term uptrend and a short-term downtrend. A falling wedge is taking shape and a breakout at 119 would be bullish for the Euro (bearish for the Dollar). Gold could maintain its bid as long as the Euro holds its short-term downtrend. A Euro breakout, however, would likely weigh on gold.
Gold Miners Underperform Gold
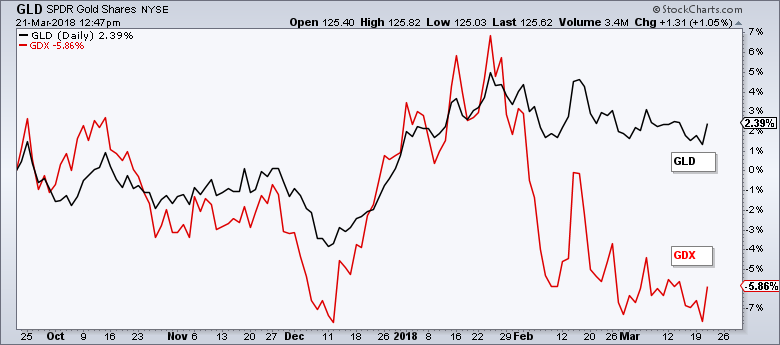
The Gold Miners ETF (GDX) is suffering the same fate as the Oil & Gas Equip & Services SPDR (XES). As noted yesterday, oil is up over 20% the last six months and XES is down over 4%. Similarly, gold is up around 2% over the last six months, but GDX is down around 6%.
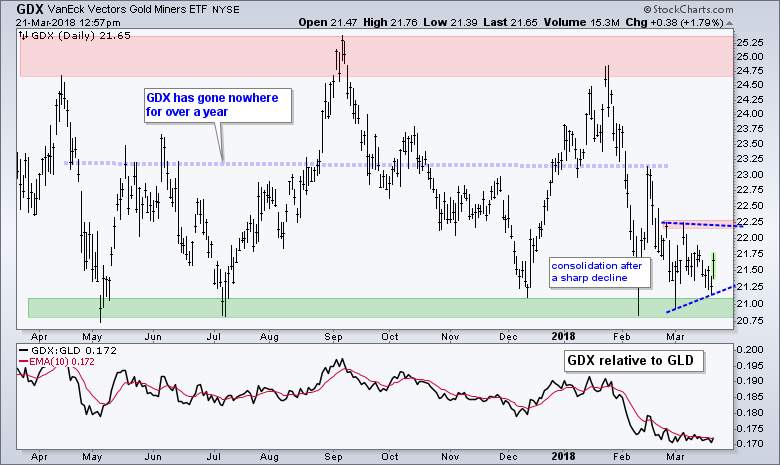
GDX Tests Low End of Range
The Gold Miners ETF (GDX) is one of the worst performing industry-group ETFs over the past year. It is also trading near the low end of its one year range.
These reasons alone are enough to warrant staying away. In general, it is wise to avoid weak stocks and ETFs, and focus on the strong.
GDX has traded between 20.75 and 25.25 for over a year. The ETF fell towards the low end of the range in February and consolidated the last few weeks. Technically, this is a consolidation after a sharp decline and this means it could be a bearish continuation pattern. A break below this week's low would signal a continuation lower.
Despite overall weakness, there is evidence of support in the 21 area and GDX is once again making waves with a bounce today. This is where charts can be used to define risk for bottom pickers. A close below this week's low (call it 21) would negate this bounce and argue for a bigger support break. Further strength above the March highs would break short-term resistance and put GDX back into the middle part of the trading range.
Plan Your Trade and Trade Your Plan.
- Arthur Hill, CMT
Senior Technical Analyst, StockCharts.com
Book: Define the Trend and Trade the Trend
Twitter: Follow @ArthurHill

