- Broad Selling in Technology.
- SPY Erases the Gap.
- New Floors and Ceilings.
- Defense Stocks Buck the Selling.
- Six Stocks with Bullish Continuation Patterns.
- Oil Consolidates within an Uptrend.
- Oil and XES Still Positively Correlated.
- XES Battles Retracement Zone.
 Broad Selling in Technology ...
The technology sector led the way lower as stocks fell with broad selling pressure on Monday. Even though Facebook (FB), social media and user-data garnered all the attention, selling pressure in the technology sector was widespread.
The chart below shows one week performance for the nine equal-weight sectors. I am using the equal-weight versions because they best capture performance for the average stock in the sector.
The EW Technology ETF (green) is down 2.35% over the last five days and this is the most of the four offensive sectors, which include Consumer Discretionary (red), Industrials (magenta) and Finance (blue). Thus, it looks like the market leader could be starting a correction after hitting new highs last week.
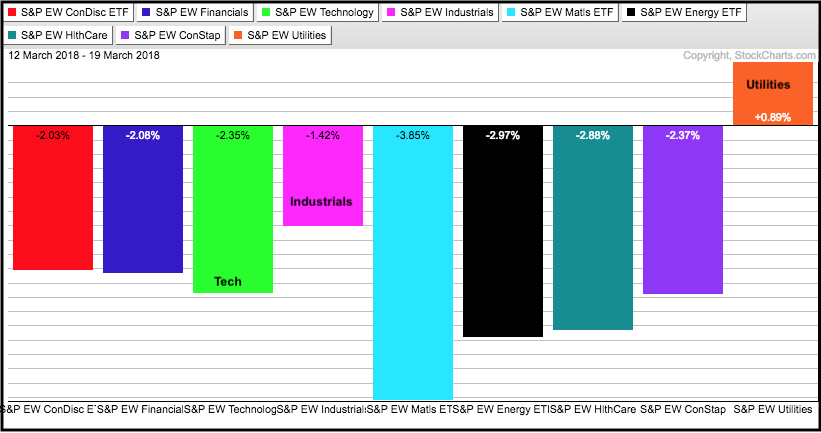
Also note that eight of the nine sectors were down over the last five trading days. This shows broad selling pressure in the stock market. The EW Utilities ETF (orange) was the only gainer, but RYU is below its 200-day SMA and its 50-day SMA is below its 200-day SMA. I would not read too much into this strength because the long-term trend is down.
Seven of the eight sectors were down more than 2%. The EW Industrials ETF (magenta) fell 1.42% and showed a little less weakness, which is also called relative strength. Materials (teal), Energy (black) and Healthcare (sea green) were down the most.
SPY Erases the Gap
The next chart shows the S&P 500 SPDR (SPY) breaking its first support level. The blue lines are based on closing prices and define a rising wedge, which is typical for a counter-trend bounce. The wedge is bullish as long as it rises, but we are seeing the first signs of a wedge reversal with the close below 272. SPY closed below the wedge line and erased the gap that formed on March 9th (employment report).
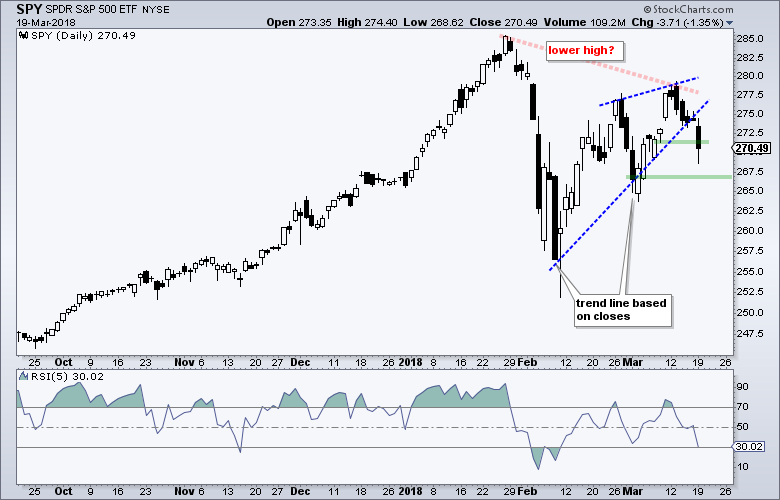
It is now possible that a lower high is taking shape from January to March. The March 1st closing low marks the next support level to watch at 266.63 (call it 266). A close below this level would forge a lower low and fully reverse the upswing that began in early February.
Before getting too bearish, note that SPY is short-term oversold after a five day decline and still above the early March low. RSI(5) is at 30 and this could give way to a short-term bounce. See this System Trader article for more details on the RSI(5) trading strategy.
New Floors and Ceilings
The next chart shows the S&P 500 Volatility Index ($VIX) and the S&P 500 %Above 50-day EMA (!GT50SPX). First, the VIX established a ceiling in the 14-17 area in 2017 and remained at relatively low levels the entire year. This appears to be changing because the VIX found a floor in this area in February-March.
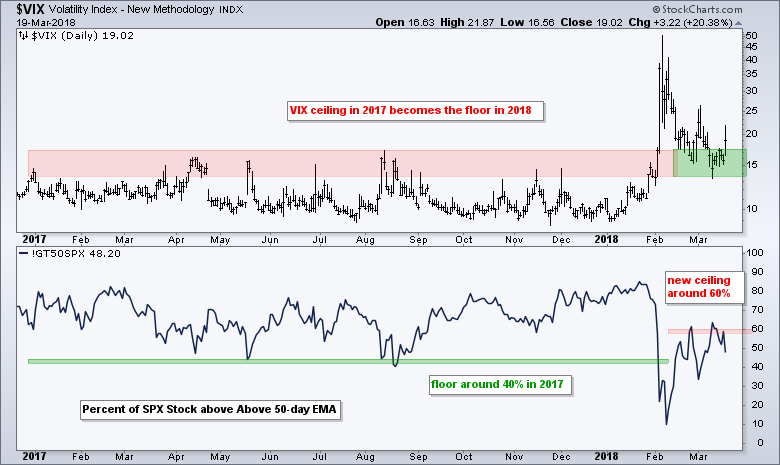
The %Above 50-day EMA established a floor in the 40% area with dips in May and August 2017. The indicator broke this floor with the February plunge and the 60% area could become the new ceiling. Notice how the indicator turned down near this level in February and March.
Defense Stocks Buck the Selling
I track over 50 industry group ETFs and the vast majority of these were down on Monday. In fact, only three were up: the iShares Aerospace & Defense ETF (ITA), the Solar Energy ETF (TAN) and the Gold Miners ETF (GDX). Note that all are down over the last five days and this confirms broad selling pressure.
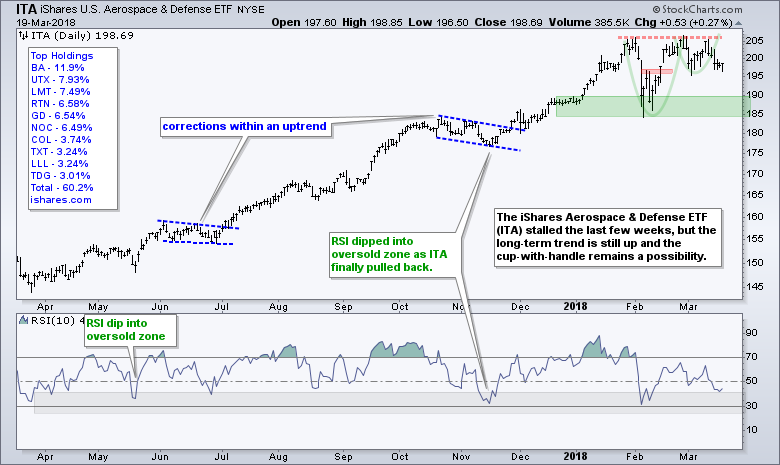
The first chart shows ITA backing off the 205 area three times in the last two months. The long-term trend is up so I would not call this a solid resistance level because resistance levels are supposed to be broken during uptrends. The pattern at work since late January looks like a cup-with-handle, which is a bullish continuation pattern.
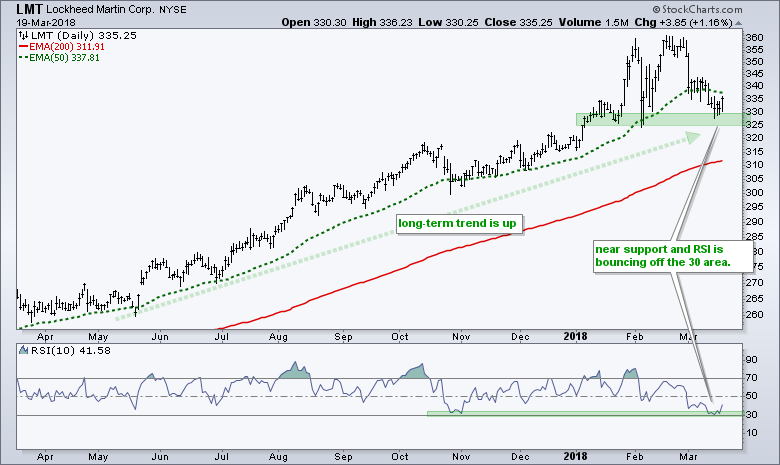
The next chart shows Lockheed Martin (LMT) in a long-term uptrend and near support from the January-February lows. RSI dipped to 30 last week and appears to be turning up.
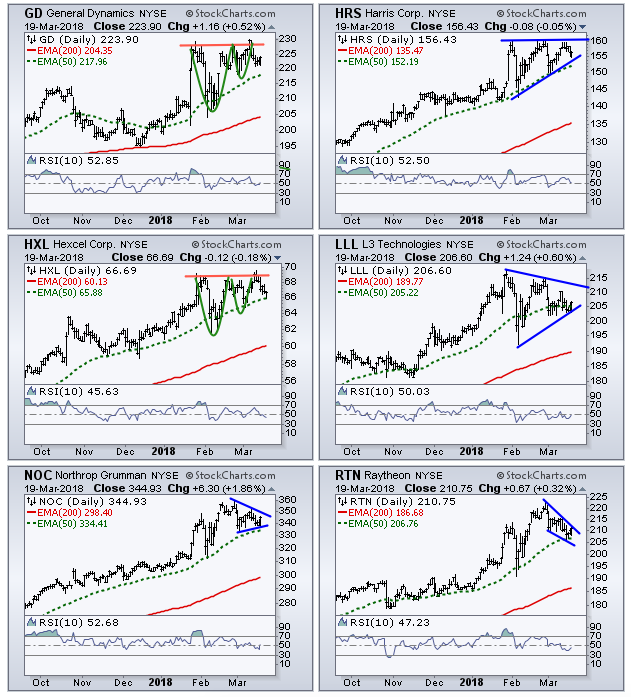
Six Stocks with Bullish Continuation Patterns
The next chart shows six more stocks in the iShares Aerospace & Defense ETF (ITA) and some bullish patterns taking shape. The cup-with-handle is a bullish continuation pattern that was popularized by William O'Neil of IBD. The ascending triangle and symmetrical triangle are consolidations within an uptrend, which makes them bullish continuation patterns. The pennant and wedge represent short corrective periods within an uptrend.
Oil Consolidates within an Uptrend
Speaking of bullish continuation patterns, the USO Oil Fund (USO) and Light Crude Continuous Contract ($WTIC) are consolidating with triangles. Oil hit a new high in late January and then moved into a narrowing range the last seven weeks. Bollinger Bands are not shown, but BandWidth is near its lows of the last five months.
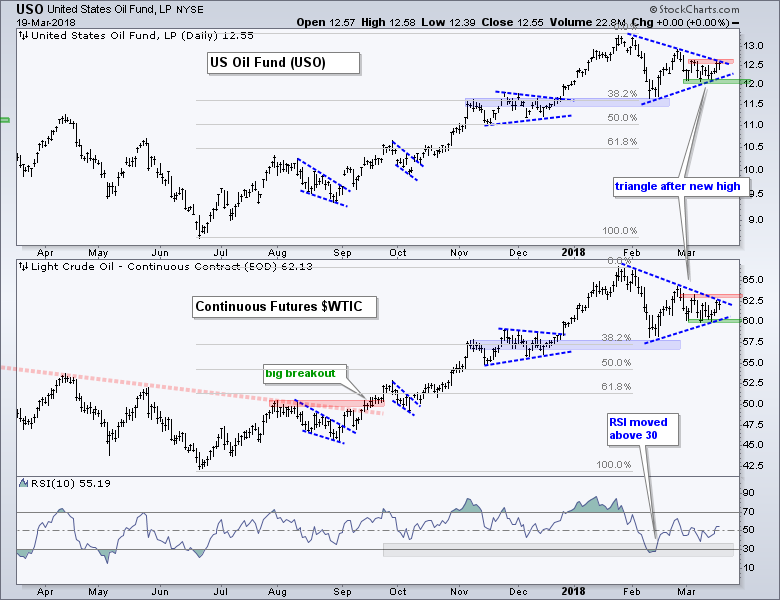 Chartists should watch for an upside breakout here. A break above $63.5 in Light Crude and 12.7 in USO would be bullish and signal a continuation higher. The green zones mark support, a break of which would be negative and signal a deeper pullback.
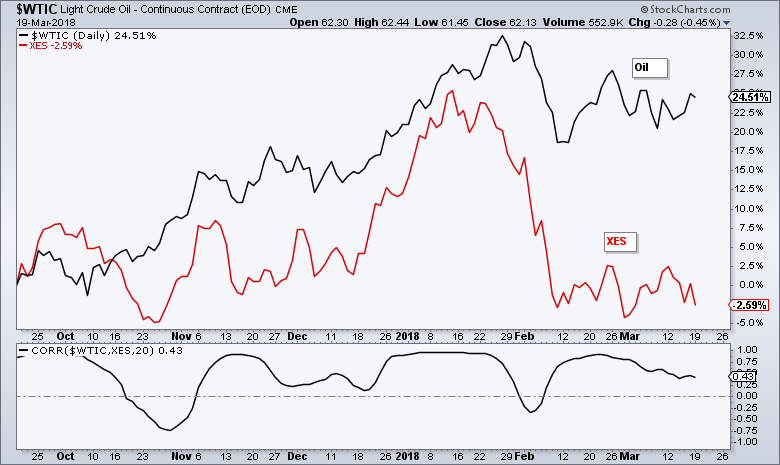
Oil and XES Still Positively Correlated
There is clearly something going on with the Oil & Gas Equip & Services SPDR (XES). I have no idea what the problem is, but note that oil is up some 25% over the last six months and XES is down around 2.5%. The correlation between the two is still largely positive because they still tend to rise and fall together. The performance discrepancy exists because XES tends to fall further and rise less than oil.
XES Battles Retracement Zone
XES is largely off my trading radar because it is one of the weakest industry group ETFs in 2018 and shows pervasive relative weakness. Most recently, XES exceeded its mid November low in February and did not exceed its February high in March. It was weaker than the broader market on the way down and weaker during the bounce.
Technical analysis, however, is not only for chart patterns and relative performance. It can also be used to define risk, even if the odds of moving higher seem diminished. This is the double-edge sword of trading. Strong stocks and ETFs have a greater chance of moving higher than weak stocks and ETFs.
Having clarified all that, note that XES is consolidating near the 61.8% retracement zone. The ETF surged from August to January, fell hard from mid January to mid February and then stalled the last five weeks. There is clearly some support in the 14.50 area and this zone can be used to set stops.
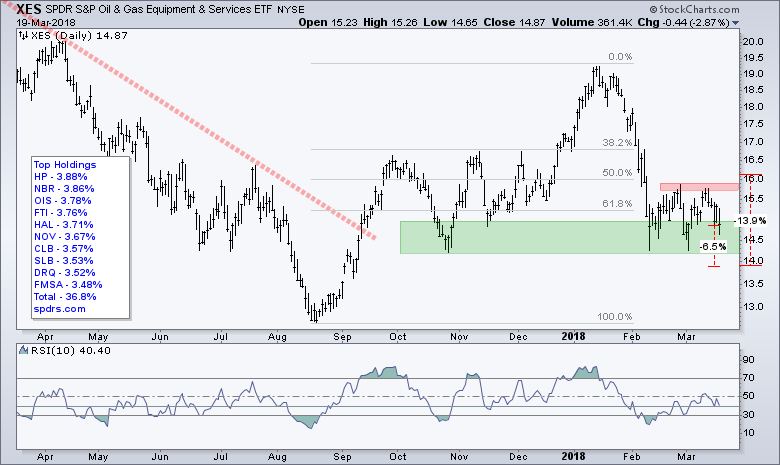 Chartists looking to define risk can cue from the red percentage change lines. Using a stop-loss at 13.9, a trade from current levels would lose around 6.5% if stopped out. A losing trade from the breakout (say 16.1) would be down around 14%.
While we can pretty easily define risk, we cannot readily estimate reward potential. I am not going to estimate potential gains because I do not think there is a robust method for this, breakout or no breakout. Sure, there are plenty of technical analysis techniques for measurement, but these are largely guesswork because they imply that we can see into the future. That is simply my opinion.
Plan Your Trade and Trade Your Plan.
- Arthur Hill, CMT
Senior Technical Analyst, StockCharts.com
Book: Define the Trend and Trade the Trend
Twitter: Follow @ArthurHill


