- Non-confirmations Continue to Nag.
- Setting the Benchmark Highs.
- RSP Sector Weights are Quite Different.
- EW Consumer Discretionary and Industrials Lag.
- XLF and XLY Trigger Triangle Breaks.
- A Stock Picker's Market.
 Non-confirmations Continue to Nag...
The Nasdaq 100 brothers, Nasdaq Composite and Nasdaq 100, were the only two major indexes to record new highs in March. The S&P Small-Cap 600 and Russell 2000 are around 1% below their January highs, which were 52-week highs. The S&P 500 (3.23% below), S&P 500 Equal-Weight Index (3.81% below) and S&P Mid-Cap 400 (2.58% below) are the furthest from their January highs.
It is positive to see the Nasdaq brothers leading and hitting new highs, but non-confirmations in the other indexes are a concern and should be watched going forward. Today I will define two benchmark highs we can use to compare performance, show some scan results using this performance metric and review the sectors.
Setting the Benchmark Highs
The first chart shows the S&P 500 SPDR (SPY), which is my main benchmark for the stock market. The ETF plunged over a 9-day period in early February and rebounded with a 21-day zigzag higher. Yep, the market takes the elevator down and the escalator up. The escalator is still rising, but the climb is proving arduous for some. I will respect the current upswing and highlight key areas to watch going forward.
The bulls deserve the benefit of the doubt as long as the current upswing holds and two levels define this upswing. First, the blue trend line is based on the closing lows on February 8th and March 1st. Adding a small buffer, a close below 272 would break this trend line and fill Friday's gap. This would be the first sign of trouble.
The early March closing low marks a reaction low that can be used as key support. A close below this closing low (call it 267) would clearly reverse the upswing and target a move below the February low. It has not happened yet and the bulls are in control right now, but these nagging non-confirmations are keeping me alert.
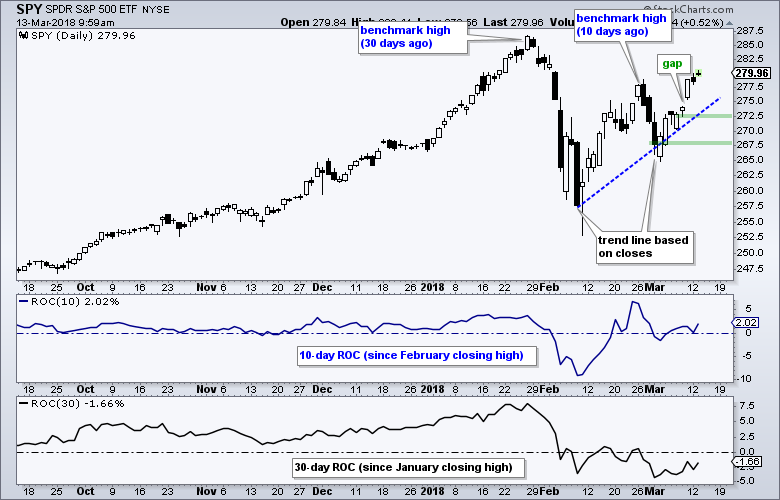 The indicator windows show the 10-day and 30-day Rate-of-Change. I picked these levels because there are 10 trading days since the February high and 30 trading days since the January high. The 10-day ROC is flat and this means SPY is near its February high. The 30-day ROC is negative and this means SPY is below its January high.
I view the January and February highs as benchmark highs that we can use to compare performance. Stocks and ETFs with a positive 10-day ROC are performing well since the late February peak in SPY. Stocks and ETFs with a positive 30-day ROC are performing well since the January peak in SPY.
Sector Weights for SPY and RSP
Before looking at some of the equal-weight sectors, note that the sector weightings for the equal-weight S&P 500 ETF are different than the S&P 500 SPDR (SPY). First and foremost, consumer discretionary is the biggest sector (15.78%). Technology dominates SPY, but this sector is a mere mortal within the equal-weight S&P 500.
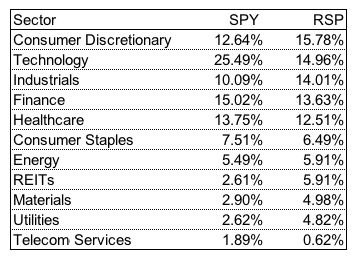
Second, notice that the top five sectors for the EW S&P 500 ETF still account for around 70%. The top five sectors in SPY account for around 76% of the ETF. I think the equal-weight version is more representative of the stock market as a whole, while SPY is clearly dominated by the technology sector. Note that XLK includes telecom services because the three stocks in this "sector" are part of XLK (T, VZ, CTL).
EW Consumer Discretionary and Industrials Lag
The next chart shows the EW S&P 500 ETF and the top five equal-weight sectors. The indicator windows show the 10-day ROC and 30-day ROC. First, notice that RSP and three of the five big sectors are above their February high. The 10-day ROC is positive and this value is shaded green on the right side of each chart.
Second, notice that RSP and four of the five big sectors are below their January high because the 30-day ROC is negative (red shading). This is net negative because it means the current rally is led by one sector (technology). The other sectors have yet to confirm with corresponding highs.
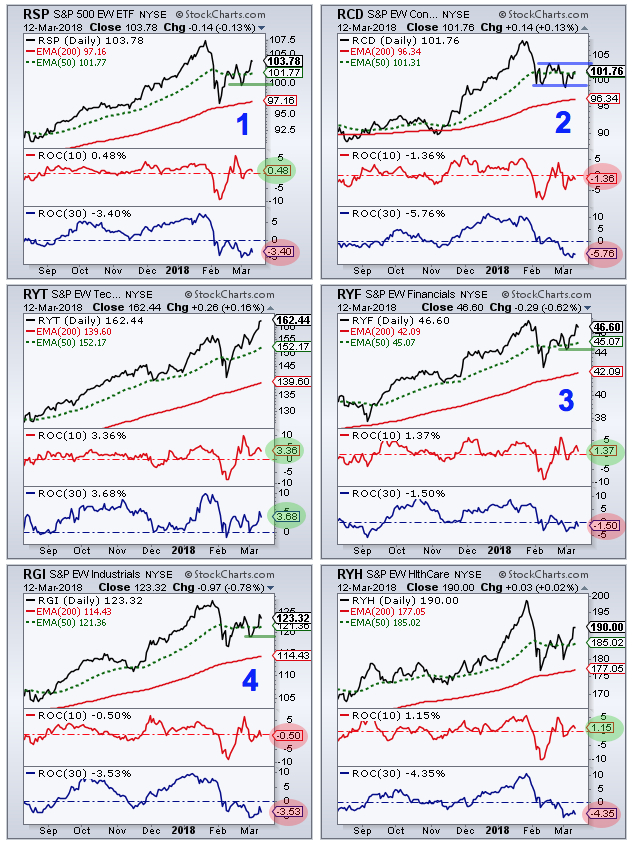
The numbers 1 through 4 show four things to watch.
- 1) The green line marks support for RSP at 100 and a close below this level would be quite negative.
- 2) The EW Consumer Discretionary ETF (RCD) is the weakest of the five sectors because it has the largest negative values for 10-day ROC and 30-day ROC. It is negative to see the most economically sensitive sector lagging. Watch the blue lines for a consolidation break.
- 3) The EW Finance ETF (RYF) is the second strongest sector and the closest to a new high. The green line marks support at 44 and a close below this level would be negative.
- 4) The EW Industrials ETF (RGI) is one of the weaker sectors because the 10-day and 30-day ROCs are negative. Support is marked at 119 and a break here would be bearish.
XLF and XLY Trigger Triangle Breaks
The next chart provides an update to the five big sector SPDRs. The Technology SPDR hit new highs in late February and March to lead the way. The Financials SPDR and Consumer Discretionary SPDR (XLY) broke symmetrical triangle trend lines and this is positive. Strength in these three is enough to keep the market afloat.
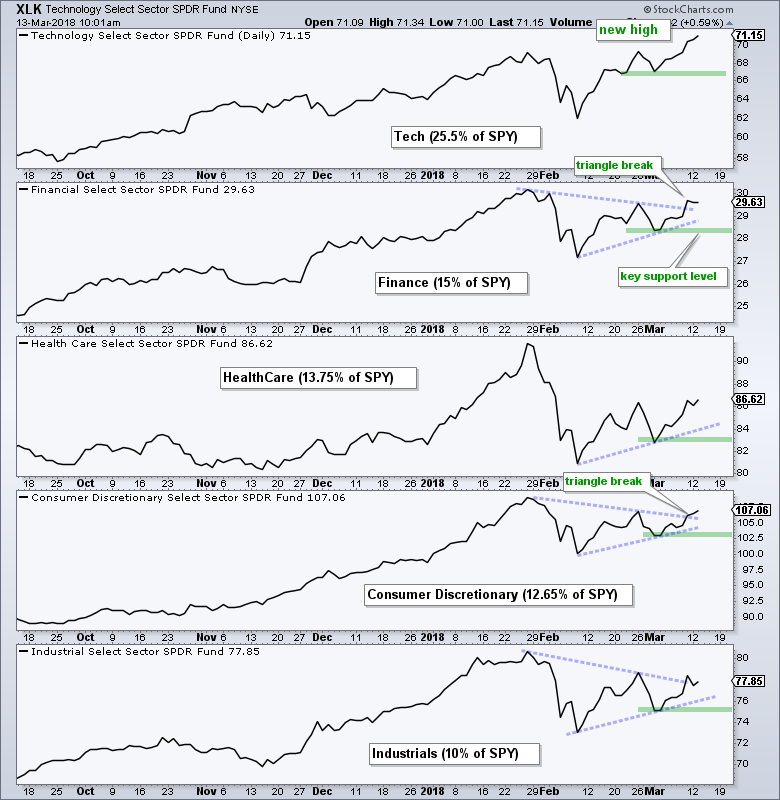 The Industrials SPDR is struggling to break its triangle line and the Health Care SPDR is struggling to stay above the late February high. The green lines mark support from the early March lows. The trouble starts when/if the big sectors start breaking these support levels.
A Stock Pickers Market
I ran a scan to see how many stocks in the S&P 500 are up since the late February high in SPY (10-day ROC is above zero) and how many are up since the January high in SPY (30-day ROC is above zero). The scan code below is for the 30-day ROC. Note that you will have to change this to 31 if scanning with today's data.
[group is SP500]
AND [ROC(30) > 0]
Rank by ROC(30)
264 stocks in the S&P 500 (52.8%) are up since the February high in SPY. Keep in mind that SPY is just above this high because the 10-day ROC is +.22%. This means 238 stocks are down over the last ten days and underperforming SPY.
The results worsen when we look at the 30-day ROC. Only 145 stocks in the S&P 500 (29%) are positive since SPY peaked in late January (30-day ROC is above zero). This means 355 stocks (71%) are down since SPY peaked in late January.
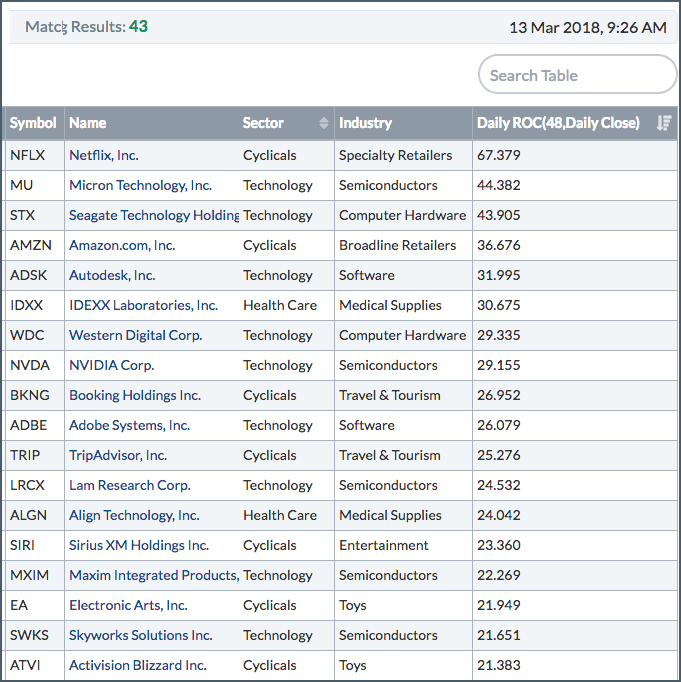
Year-to-date performance, however, is net positive. Chartists interested in year-to-date performance can scan using the 48-day ROC. SPY is up 4.37% and RSP is up 2.72% over this period. Among stocks in the S&P 500, 285 are up year-to-date and 215 are down.
It is clearly a stock picker's market because there are plenty of sizable winners and losers this year. Note that 50 stocks in the S&P 500 are down more than 10% year-to-date, while a surprising 121 stocks are up more than 10% this year. 43 of these 121 stocks are also in the Nasdaq 100 (see table below).
Plan Your Trade and Trade Your Plan.
- Arthur Hill, CMT Senior Technical Analyst, StockCharts.com Book: Define the Trend and Trade the Trend
Twitter: Follow @ArthurHill


