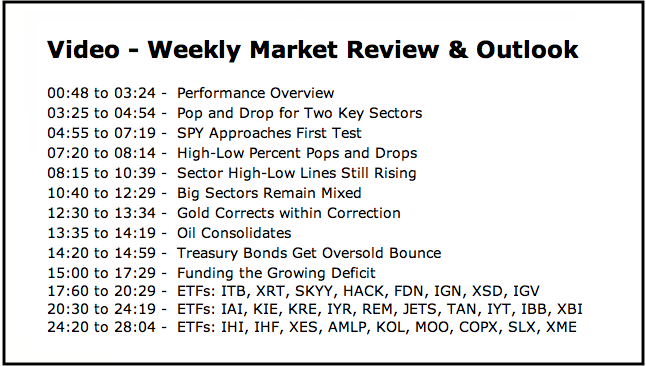
- Pop and Drop for Two Key Sectors.
- SPY Approaches First Test.
- High-Low Percent Pops and Drops.
- Sector High-Low Lines Still Rising.
- Big Sectors Remain Mixed.
- Gold Corrects within Correction.
- Treasury Bonds Get Oversold Bounce.
- Funding the Growing Deficit.
- Notes from the Art's Charts ChartList.

The S&P 500 SPDR (SPY) surged last Friday after the employment report and then dropped the last four days. SPY is still positive over the last five days, but four sectors are trading below last Thursday's open. This means the gains from last Friday have been erased in these sectors.
The table below shows SPY and the nine sector SPDRs ranked by the 5-day Rate-of-Change. Positive values indicate the ETF is still above last Thursday's close. Negative values indicate that the ETF is below last Thursday's close and the gains from last Friday were totally erased.
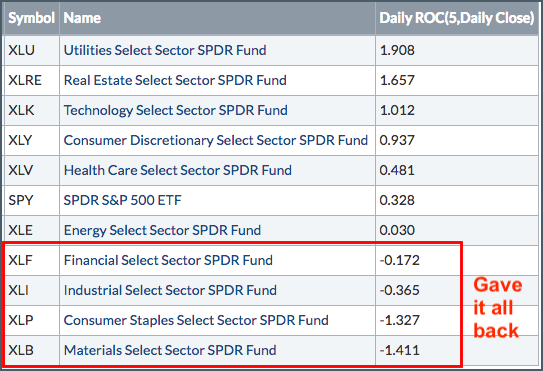
Of note, the Financials SPDR and Industrials SPDR are negative over the last five days. These two negatives are offset by the Technology SPDR, Consumer Discretionary SPDR and Health Care SPDR, which are still positive over the last five days. These five sectors account for around 76% of the S&P 500. The finance and industrials sectors are important sectors and their weakness and weighing on the broader market.
The Utilities SPDR and Real Estate SPDR are the 5-day leaders, but these two are in long-term downtrends so I am not taking the short-term bait. The Energy SPDR sports a positive 5-day ROC, but it too is one of the weakest sectors in 2018 and not on my radar.
SPY Approaches First Test
The S&P 500 SPDR edged above its late February high on Friday-Monday and then fell back over the last three days. The blue lines mark a rising wedge based on closing prices. Trend lines do not mark hard support or resistance levels, in my opinion, but they can be used to define patterns.
The rising wedge is typical for a counter-trend bounce or corrective bounce after a sharp decline. The trend is up as long as the wedge rises so the bulls still get the benefit of the doubt. A close below 272 would break the wedge line, erase last Friday's gain and provide the first sign of a trend reversal in this key benchmark.
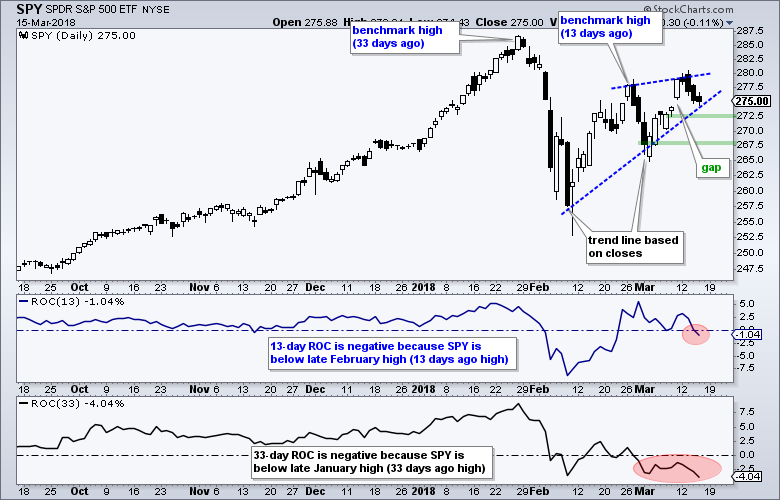
The second green line marks the March 1st closing low (267.7). Adding a little buffer, a close below 267 would forge a lower low and fully reverse the upswing that began in early February. Such a reversal would signal a continuation of the early February decline, and also make the mid-March high a lower high.
The indicator windows show the 13-day ROC and 33-day ROC. Stocks and ETFs with positive readings in these two indicators are outperforming SPY on these timeframes. Note that SPY is back below its late February high and still around 4% below its January high.
High-Low Percent Pops and Drops
I was watching S&P 500 High-Low% ($SPXHLP) for a move above +10% that would signal a new high expansion and signal that the correction was ending. Well, we got this move and I am not so sure the correction has ended. Such is a day in the life of a technical analyst.
The chart below shows High-Low Percent surging above +10% last Friday and then dipping back into negative territory on Thursday. Jeeze, that was quick! There were eight new highs in the S&P 500 on Thursday and 10 new lows. This means net new highs were -2 and High-Low Percent was -.40% (500/-2).
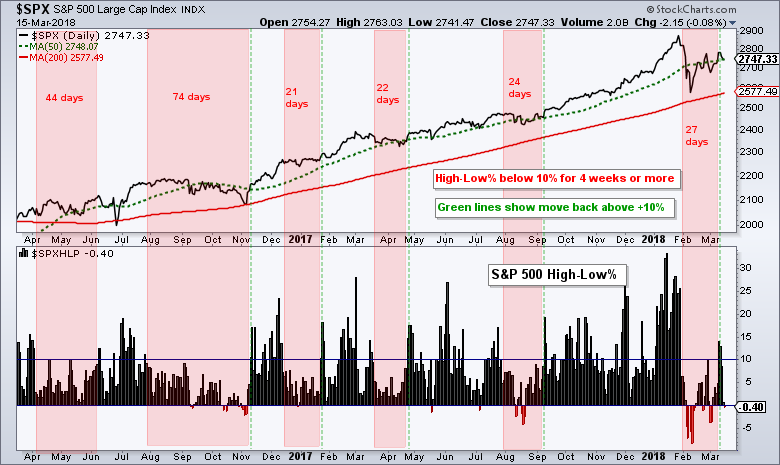
10 new lows (out of 500) is not a big deal, but the sudden appearance of these new lows indicates that there are some weak undercurrents in the market and these weak spots could weigh on broad indexes, such as the S&P 500.
Sector High-Low Lines Still Rising
Chartists can also use the High-Low Percent indicators to create High-Low Lines. These are cumulative indicators based on daily High-Low Percent values. The lines rise as long as new highs outpace new lows and fall when new lows outpace new highs for an extended period.
The next chart shows the High-Low Lines for the S&P 500 and the nine sectors. The pink line is the 20-day EMA and we can use this to identify upturns and downturns in the High-Low Line.
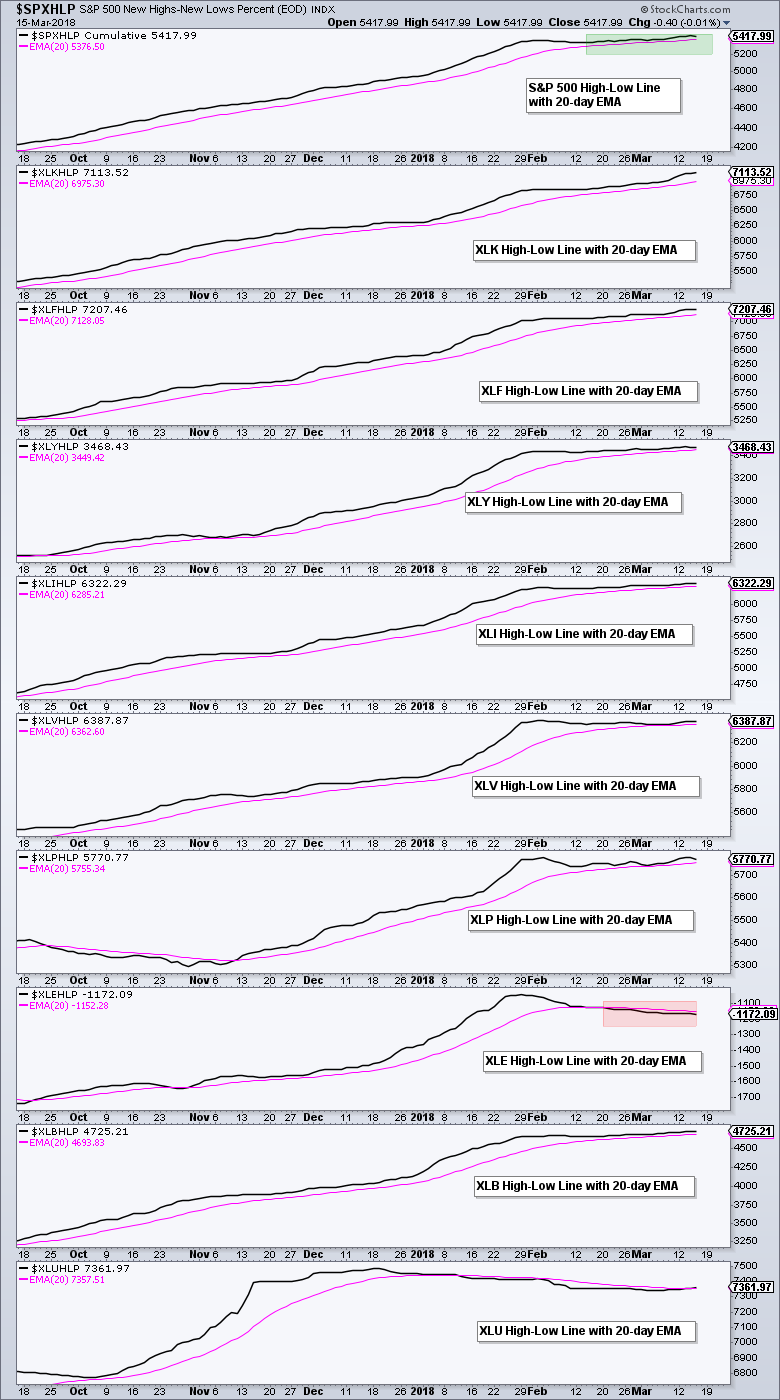 Currently, the S&P 500 High-Low Line is above its 20-day EMA and eight of the nine sector High-Low Lines are above their 20-day EMAs. Thus, new highs are still outpacing new lows for most sectors and this supports the uptrend in the broader market. The trouble starts if/when the S&P 500 High-Low Line and the majority of sector High-Low Lines turn down. Thus, watch these lines over the coming days and weeks.
Big Sectors Remain Mixed
This next chart shows the top five sectors and performance is quite mixed. XLK is the only one to exceed its January and February highs, and is the sole leader. XLF and XLV edged above their February 26th highs, but remain below their January 26th highs. Rising wedges are possible and a break below the early March low would reverse the five week upswing.
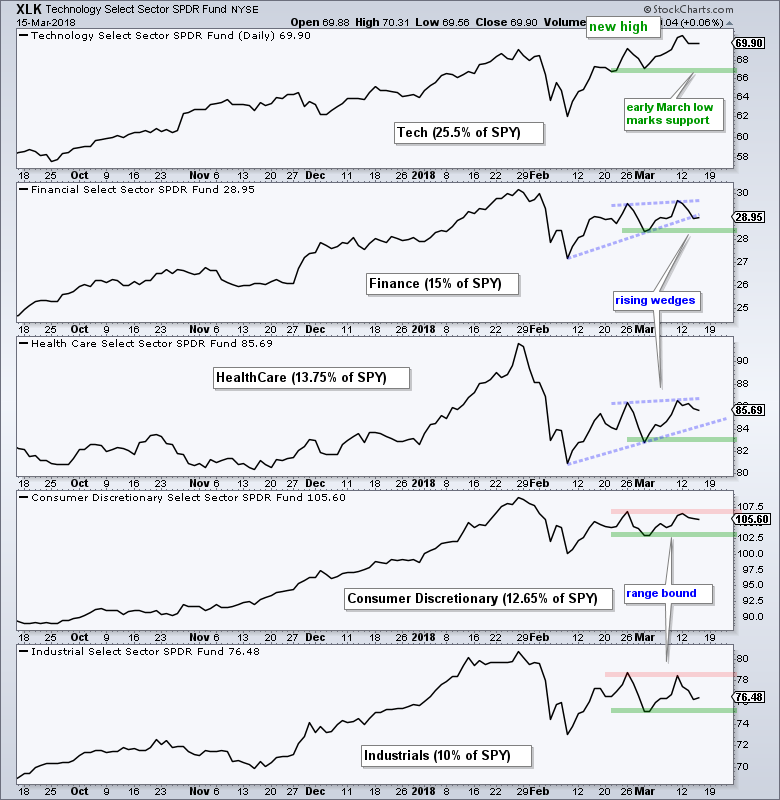
XLI and XLY did not exceed their February 26th highs (red lines). This means they have the weakest charts over the last three weeks. They have yet to break down though and I am watching the early March low.
Though not listed, also note that XLE, XLB, XLP and XLU did not exceed their late February highs. XLB is the only one in any kind of an uptrend, but it only accounts for 2.88% of SPY. XLE and XLP are perhaps the two weakest sectors at the moment. XLU and XLRE got nice bounces, but both are below their 200-day SMAs and off my radar.
Gold Corrects within Correction
The Gold SPDR (GLD) attempted to bounce in early March, but fell back with a small falling wedge taking shape. Overall, I still think the long-term trend is up for gold because it hit a 52-week high in late January. GLD corrected over the last two months with a zigzag towards the breakout zone (123).
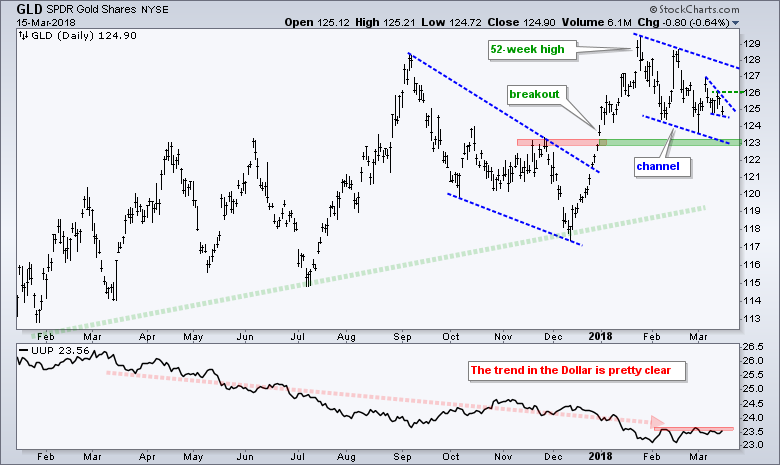
Short-term, I am watching price action within the two month falling channel. GLD bounced in early March and fell back below 125 with a small wedge, which is the correction within the correction. There is now a short-term resistance level to watch at 126.50. A breakout here would argue for a challenge to channel resistance.
The indicator window shows the US Dollar ETF (UUP) hugging the red resistance zone. A breakout in UUP would be negative for gold, while a downturn from resistance would be positive.
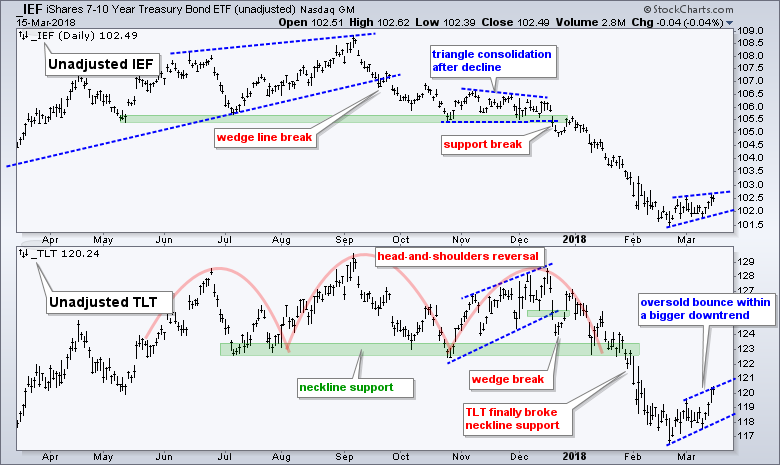
Treasury Bonds Get Oversold Bounce
The 7-10 YR T-Bond ETF (IEF) and 20+ YR T-Bond ETF (TLT) bounced over the last two to three weeks, but these bounces are viewed as counter-trend moves within a bigger downtrend. Note that both IEF and TLT hit 52-week lows in late February and fell sharply from mid December to late February. Both are entitled to a bounce or consolidation.
Funding the Growing Deficit
I am a technical kind of guy, but I follow some macro themes that are developing in the markets. For example, the prospect of record buybacks in 2018 (~800 billion Dollars worth) is a macro theme that could be positive for stocks. Conversely, the the sharp rise in Treasury yields may be rattling the stock market and the VIX seems to be adjusting to a higher range with 14-15 as the new floor.
I watched an interview with David Rosenberg of Gluskin Sheff and he pointed out some macro themes to watch going down the road. In particular, note that the US will need to fund its growing deficit by issuing more Treasury bonds and buyers are needed for these bonds.
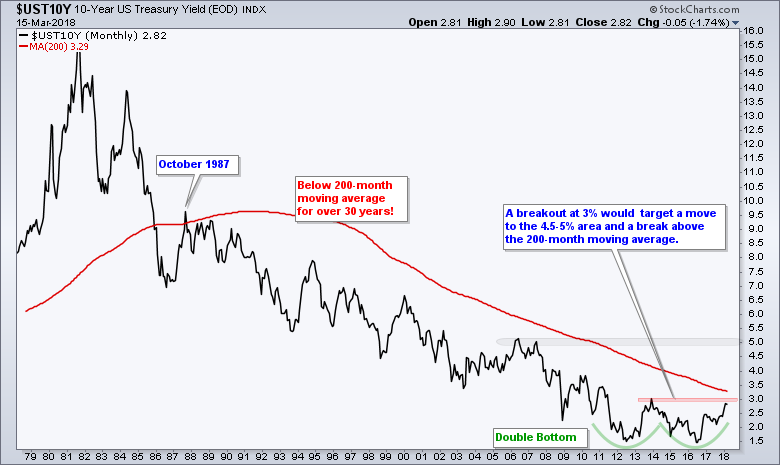
Even though the 10-yr T-Yield ($UST10Y) fell back over the last three weeks, the bigger trend is up and the yield is on the verge of reversing a secular downtrend. The chart below shows a massive double bottom forming and a breakout at 3% would target a move to the 4.5-5% area. Treasury bonds move opposite of Treasury yields so this would be quite bearish for bonds.
Notes from the Art's Charts ChartList
- The Home Construction iShares (ITB) continues to lag because it formed a lower low in early March and did not exceed its late February high.
- The Retail SPDR (XRT) is also lagging because it fell short of the February high. A consolidation formed the last five weeks and a line break would signal a continuation of the February decline.
- The Cloud Computing ETF (SKYY), Cyber Security ETF (HACK), Internet ETF (FDN), the Networking iShares (IGN), the Semiconductor iShares (SOXX), the Semiconductor SPDR (XSD) and the Software iShares (IGV) surged 15+ percent the last five weeks and hit new highs. They are looking extended for the short-term, but not weak and still the leaders.
- The Broker-Dealer iShares (IAI) hit a new high on Monday and remains one of the leading industry-group ETFs.
- The Regional Bank SPDR (KRE) hit a new high on Monday and the overall trend is up.
- The iShares Aerospace & Defense ETF (ITA) stalled the last few weeks, but the long-term trend is still up and the cup-with-handle remains a possibility.
- The Oil & Gas Equip & Services SPDR (XES) is one of the weakest industry group ETFs right now. A consolidation formed after the sharp decline and this is a bearish continuation pattern. A strong breakout at 16 would call for a re-assessment.
- The Agribusiness ETF (MOO) got hit hard the last four days. A lower high could be forming along with the rising wedge. A close below the early March closing low (61.7) would be bearish. The Gold Miners ETF (GDX) may be testing a large support zone, but it is still one of the weakest industry-group ETFs over the last three, six and twelve months.
Plan Your Trade and Trade Your Plan.
- Arthur Hill, CMT
Senior Technical Analyst, StockCharts.com
Book: Define the Trend and Trade the Trend
Twitter: Follow @ArthurHill


