- Breadth Indicators Strengthen.
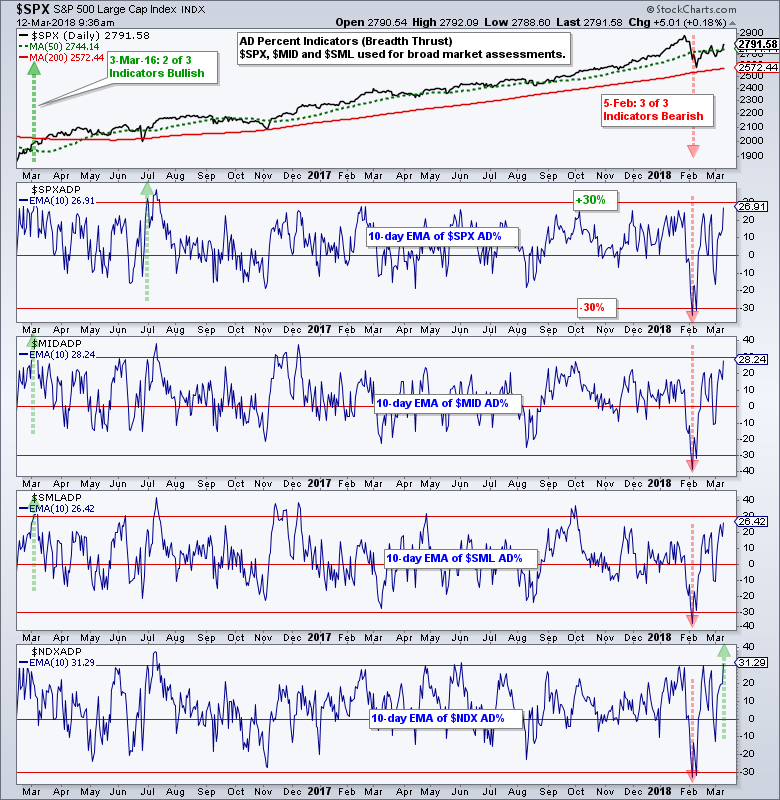
- Nasdaq 100 Leads AD Percent Rebound.
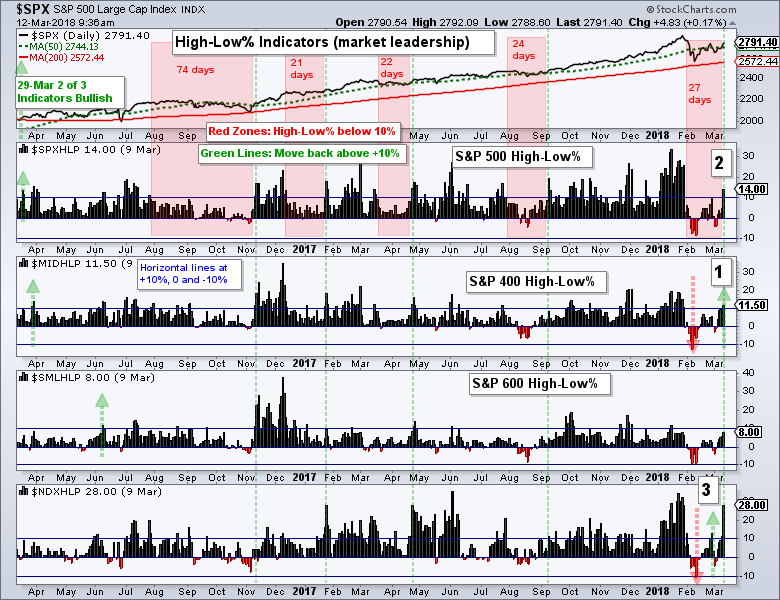
- $SPX High-Low% Signals End of Correction.
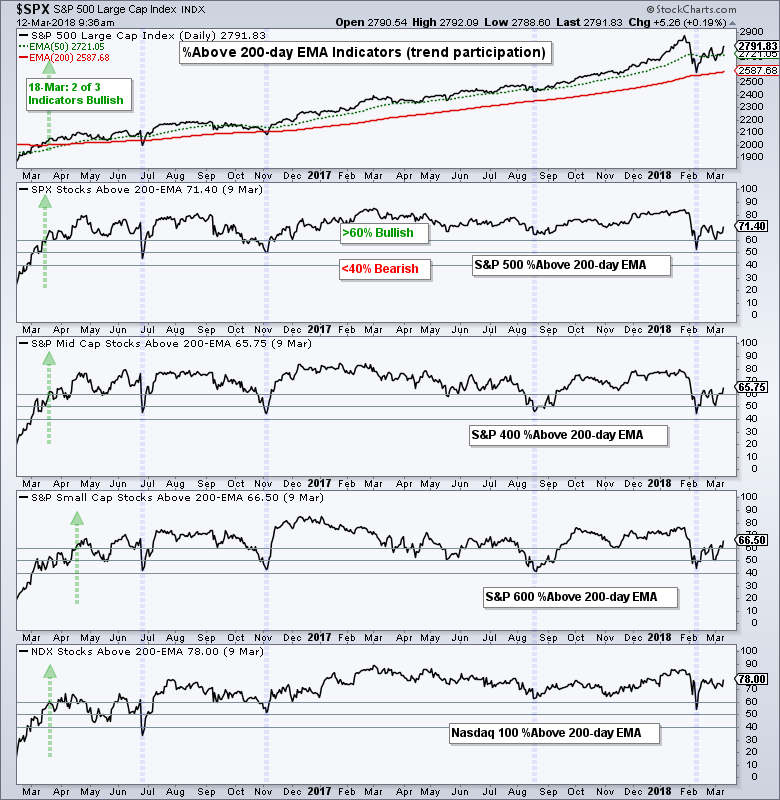
- Large-caps Lead %Above 200-day EMA.
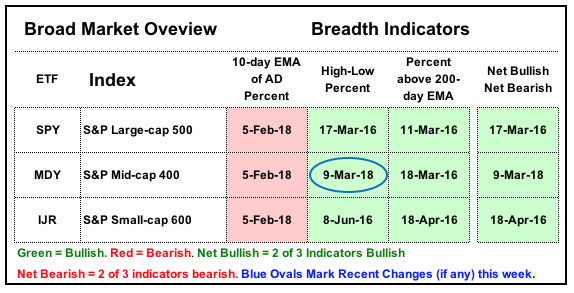
- Broad Market Breadth Table.
- Sector Breadth Table.
- Links for Sector Breadth Charts.
 Breadth Indicators Strengthen...
A couple of breadth indicators flipped from bearish to bullish with last week's surge in stocks. Five of the nine broad market breadth indicators were still bullish heading into the week and now six of nine are bullish. Thus, the weight of the evidence remains bullish for stocks.
With some new signals, this is a good time to update the breadth charts, the broad market breadth table and the sector breadth table. I use these tables to reduce subjectivity and increase objectivity by taking a weight of the evidence approach. Market conditions are bullish when the majority of indicators are on bullish signals, and bearish otherwise.
The breadth assessment is based on three breadth indicators. First, the 10-day EMA of AD Percent is used to measure bearish and bullish breadth thrusts. This is by far the most sensitive of the three. This means it often signals before the other two indicators and can be prone to whipsaws. Second, High-Low Percent is used to measure leadership and strong uptrends. Third, the percentage of stocks above the 200-day EMA is used to measure stocks in long-term uptrends. The name of each indicator is linked to a detailed article explaining its use.
The following charts show these breadth indicators for the S&P 500, S&P Mid-Cap 400, S&P Small-Cap 600 and Nasdaq 100. I added the Nasdaq 100 because of its leadership overall, but do not include it in my broad market assessment table because over 80% of stocks in the Nasdaq 100 are also in the S&P 500. This makes the Nasdaq 100 redundant for a broad market assessment.
Nasdaq 100 Leads AD Percent Rebound
The AD Percent indicators triggered bearish with a downward thrust below -30% on February 5th (red arrows). Last week's surge pushed the 10-day EMA of Nasdaq 100 AD Percent ($NDXADP) back above +30% to reverse its bearish signal. It is the only one to reverse its bearish signal, but the other three are quite close, especially the $MID AD Percent (+28.24%).
$SPX High-Low% Signals End of Correction
The next chart shows the High-Low Percent indicators with three signals labeled on the chart (numbers 1, 2 and 3). First, S&P 400 High-Low% ($MIDHLP) reversed its bearish signal with a surge back above +10% on Friday. Second, S&P 500 High-Low% ($SPXHLP) moved back above +10% for the first time in 27 days. This indicates that market leadership is broadening again and signals that the correction in the S&P 500 is ending. Third, notice that Nasdaq 100 High-Low% ($NDXHLP) triggered bearish on February 9th and reversed this signal with a move above +10% on February 27th. Large-cap techs refuse to stay down.
Large-caps Lead %Above 200-day EMA
The %Above 200-day EMA indicators have been bullish since March 2016, which is when they first exceeded 60%. The blue vertical lines show when these indicators dipped in late June 2016, November 2016, August 2017 and February 2017. These dips, however, did not dip low enough to trigger bearish signals (blue verticals). Notice that %Above 200-day EMA for the S&P 500 and Nasdaq 100 did not break the 50% level in August or February. In contrast, %Above 200-day EMA for the S&P Mid-Cap 400 and S&P Small-Cap 600 dipped below 50%. These large-cap indexes held up better during the dips and have more stocks above the 200-day EMA right now. 78% of Nasdaq 100 stocks and 71.4% of S&P 500 stocks are above their 200-day EMA.
Broad Market Breadth Table
The table below shows the recent signals and the dates for an overview. The column on the far right shows when these indicators were net bullish or net bearish (at least 2 of 3 triggered signals). Notice that the S&P 500 and S&P Mid-Cap 400 have been net bullish since mid March 2016 and this affirms the long-term bull market. The bearish signals in AD Percent have yet to be reversed, but I must take a weight of the evidence approach and stay long-term bullish when the majority of indicators are on bullish signals.
Sector Breadth Table
I also created a table with the sectors and the same indicators. All three breadth indicators are bullish for four of the nine sector SPDRs (sans XLRE). These four account for 66% of the S&P 500 and this is more than enough to keep the bull market going. Notice that the AD Percent indicators recently moved from bearish to bullish for the Industrials SPDR (26-Feb) and the Health Care SPDR (9-Mar).
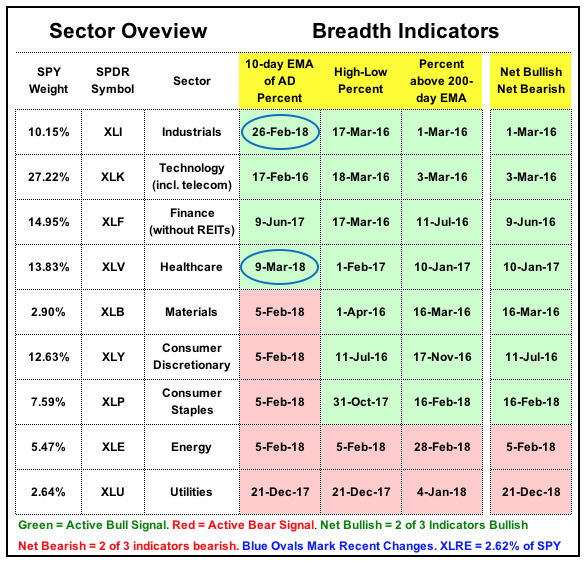 The AD Percent indicators remain bearish for Materials and Consumer Discretionary, but the longer-term breadth indicators did not trigger and remained on bullish signals. Thus, the sectors as a whole remained net bullish because two of the three breadth indicators were still bullish.
The consumer staples sector is all over the place and recently flipped back to bullish on February 16th. Energy and Utilities are bearish overall, but energy could flip with a little more strength this week.
Links for Sector Breadth Charts
Here are links to the individual charts for further study.
- Consumer Discretionary SPDR (XLY)
- Technology SPDR (XLK)
- Financials SPDR (XLF)
- Industrials SPDR (XLI)
- Health Care SPDR (XLV)
- Consumer Staples SPDR (XLP)
- Utilities SPDR (XLU)
- Energy SPDR (XLE)
- Materials SPDR (XLB)
Plan Your Trade and Trade Your Plan.
- Arthur Hill, CMT Senior Technical Analyst, StockCharts.com
Book: Define the Trend and Trade the Trend
Twitter: Follow @ArthurHill


